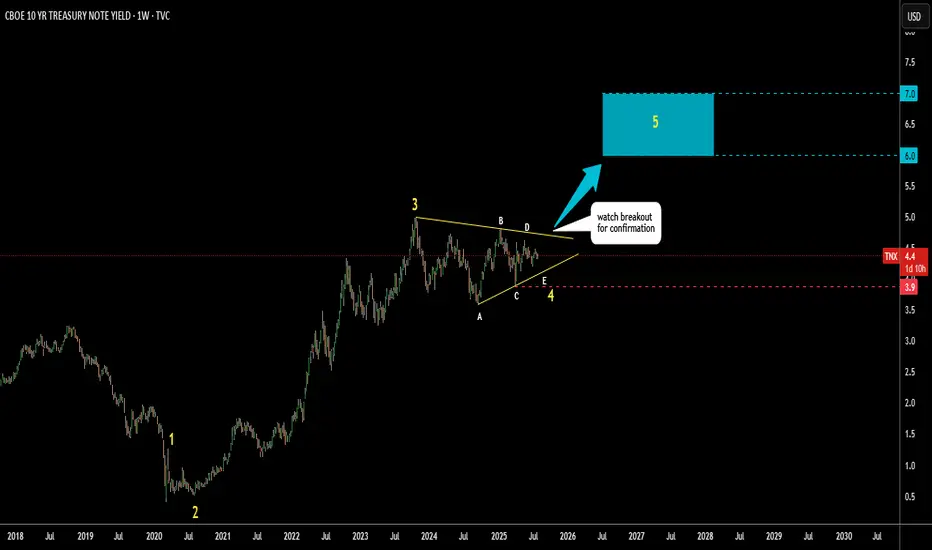
I’ve spotted a well-known triangular pattern forming on the US 10-year Treasury yield.
This appears to be the development of a large Wave 4.
Wave E of Wave 4 may still be unfolding.
Watch to see if it holds above the Wave C low at 3.9%.
A breakout above resistance near 4.7% would confirm the pattern.
The target zone is set between the 38.2% and 61.8% retracement levels of Waves 1 to 3,
highlighted with a blue box between 6% and 7%.
Could tariffs cause a major spike in yields—or will something else trigger it?
Share your thoughts in the comments below.
Haftungsausschluss
Die Informationen und Veröffentlichungen sind nicht als Finanz-, Anlage-, Handels- oder andere Arten von Ratschlägen oder Empfehlungen gedacht, die von TradingView bereitgestellt oder gebilligt werden, und stellen diese nicht dar. Lesen Sie mehr in den Nutzungsbedingungen.
Haftungsausschluss
Die Informationen und Veröffentlichungen sind nicht als Finanz-, Anlage-, Handels- oder andere Arten von Ratschlägen oder Empfehlungen gedacht, die von TradingView bereitgestellt oder gebilligt werden, und stellen diese nicht dar. Lesen Sie mehr in den Nutzungsbedingungen.