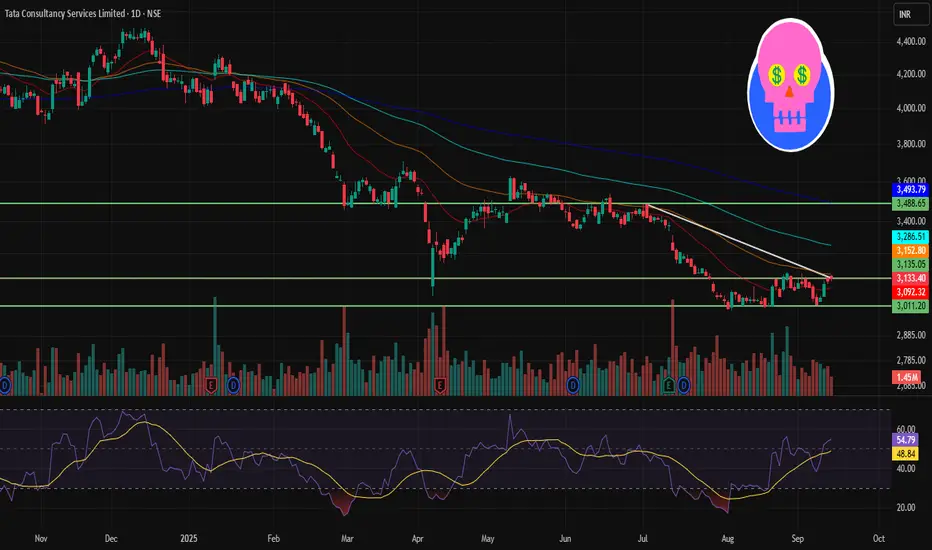
🔢 Current Level
~ ₹3,131
🔑 Key Resistance & Support Levels
Resistance Zones:
~ ₹3,160 – ₹3,180 (near-term resistance)
~ ₹3,200 – ₹3,220 (stronger resistance above)
Support Zones:
~ ₹3,120 – ₹3,100 (immediate support)
~ ₹3,050 – ₹3,000 (secondary support)
~ ₹2,900 (deeper support if weakness intensifies)
📉 Outlook
Bullish Scenario: If TCS holds above ~ ₹3,120 and manages to break past ~ ₹3,180 – ₹3,200, there is potential to move toward ~ ₹3,220+
Bearish Scenario: A drop below ~ ₹3,100 could lead to a slide toward ~ ₹3,050 or lower
Neutral / Range: Between ~ ₹3,100 – ₹3,180, TCS may consolidate until a clearer breakout or breakdown
Haftungsausschluss
Die Informationen und Veröffentlichungen sind nicht als Finanz-, Anlage-, Handels- oder andere Arten von Ratschlägen oder Empfehlungen gedacht, die von TradingView bereitgestellt oder gebilligt werden, und stellen diese nicht dar. Lesen Sie mehr in den Nutzungsbedingungen.
Haftungsausschluss
Die Informationen und Veröffentlichungen sind nicht als Finanz-, Anlage-, Handels- oder andere Arten von Ratschlägen oder Empfehlungen gedacht, die von TradingView bereitgestellt oder gebilligt werden, und stellen diese nicht dar. Lesen Sie mehr in den Nutzungsbedingungen.