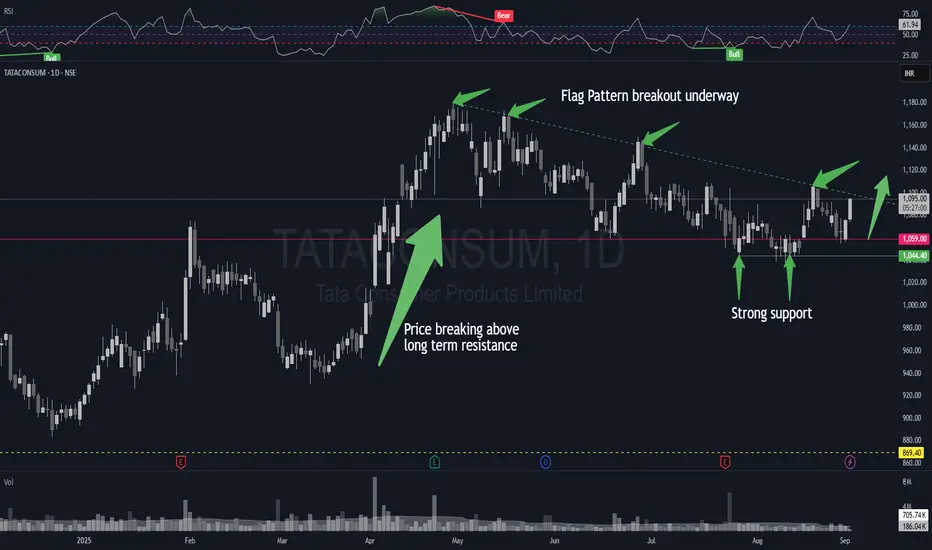
After breaking above a long-term resistance level near 1050 in April, the price consolidated above 1050 and formed a Flag Pattern. Bouncing from the support, showing positive momentum on RSI, and a bullish trend on MACD confirms the bullish view. After the breakout is complete, any pullback towards 9EMA or 21EMA may be used for entry, while keeping SL at 1030 on a daily closing basis.
Disclaimer: This idea is for educational and learning purposes only and not to be construed as a suggestion/advice to buy or sell any instrument. Please consult your investment advisor before making an investment. All the investments are subject to market risks.
Disclaimer: This idea is for educational and learning purposes only and not to be construed as a suggestion/advice to buy or sell any instrument. Please consult your investment advisor before making an investment. All the investments are subject to market risks.
Haftungsausschluss
Die Informationen und Veröffentlichungen sind nicht als Finanz-, Anlage-, Handels- oder andere Arten von Ratschlägen oder Empfehlungen gedacht, die von TradingView bereitgestellt oder gebilligt werden, und stellen diese nicht dar. Lesen Sie mehr in den Nutzungsbedingungen.
Haftungsausschluss
Die Informationen und Veröffentlichungen sind nicht als Finanz-, Anlage-, Handels- oder andere Arten von Ratschlägen oder Empfehlungen gedacht, die von TradingView bereitgestellt oder gebilligt werden, und stellen diese nicht dar. Lesen Sie mehr in den Nutzungsbedingungen.