### **Technical Analysis of Swiggy Ltd. (NSE)**
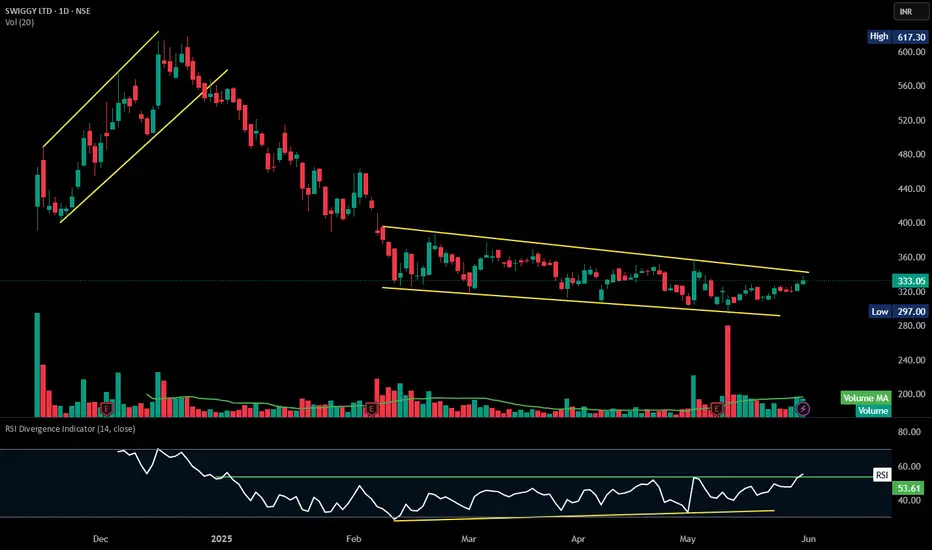
The chart highlights a **descending channel breakout**, indicating a potential trend reversal.
### **Key Observations:**
1. **Descending Channel Formation:**
- Price has oscillated within two downward-sloping trendlines from **January to June 2025**, creating a bearish trend.
- **Breakout above 333.05 INR** suggests buyers may be gaining control.
2. **Volume & Price Action:**
- **Current price:** **333.05 INR**, up **1.28% (+4.20 INR)**.
- **Volume (20-period moving average):** **19.7M vs. 21.35M**—watch for a sustained increase to confirm the breakout.
3. **RSI Divergence:**
- RSI is **55.23**, indicating improving momentum but not yet in overbought territory.
- Divergence suggests weakening bearish pressure, strengthening bullish reversal potential.
- **Support & Resistance:**
- **Support:** **297.00 INR**, the lower boundary of the previous range.
- **Resistance:** **352INR**, the prior high acting as an upside target.
Haftungsausschluss
Die Informationen und Veröffentlichungen sind nicht als Finanz-, Anlage-, Handels- oder andere Arten von Ratschlägen oder Empfehlungen gedacht, die von TradingView bereitgestellt oder gebilligt werden, und stellen diese nicht dar. Lesen Sie mehr in den Nutzungsbedingungen.
Haftungsausschluss
Die Informationen und Veröffentlichungen sind nicht als Finanz-, Anlage-, Handels- oder andere Arten von Ratschlägen oder Empfehlungen gedacht, die von TradingView bereitgestellt oder gebilligt werden, und stellen diese nicht dar. Lesen Sie mehr in den Nutzungsbedingungen.