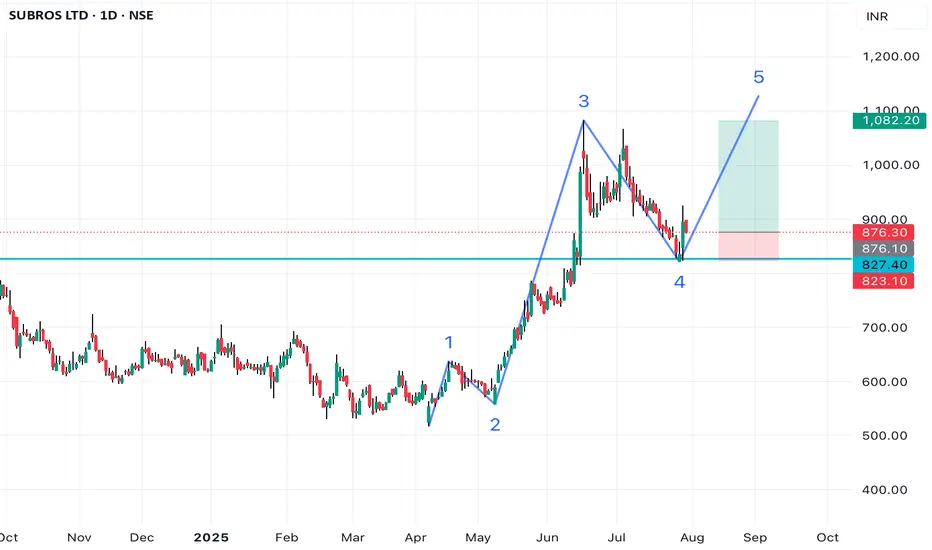
The stock is in clear uptrend on higher time frames (Weekly & Monthly).
It has given a break out on weekly time frame and now has come to retest the same level.
In daily TF we can see the bullish candle on support and a corrective wave (A-B-C).
It has also taken support on 50 EMA.
So the confluence of the 2 context gives some conviction on this chart. If NIFTY goes up then the chances of this stock going up increase dramatically.
NOTE: Pls do not take this as an advice, Just sharing my study.
Haftungsausschluss
Die Informationen und Veröffentlichungen sind nicht als Finanz-, Anlage-, Handels- oder andere Arten von Ratschlägen oder Empfehlungen gedacht, die von TradingView bereitgestellt oder gebilligt werden, und stellen diese nicht dar. Lesen Sie mehr in den Nutzungsbedingungen.
Haftungsausschluss
Die Informationen und Veröffentlichungen sind nicht als Finanz-, Anlage-, Handels- oder andere Arten von Ratschlägen oder Empfehlungen gedacht, die von TradingView bereitgestellt oder gebilligt werden, und stellen diese nicht dar. Lesen Sie mehr in den Nutzungsbedingungen.