Snapshot of the last 4h candle (and what it means)
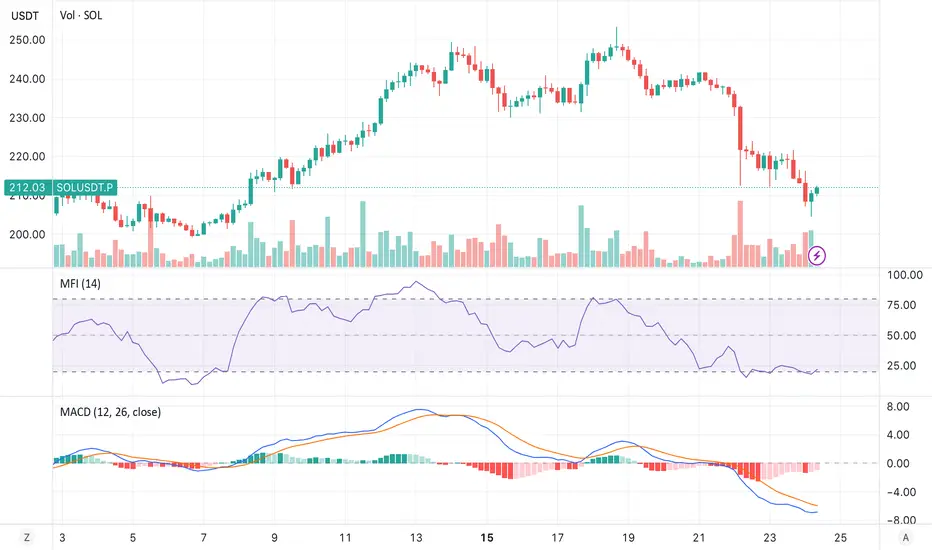
• Price: ~210.56 — current base reference.
• VWAP (entire period): ~201.04; z(Price−VWAP)[100] ≈ −2.25 — price above VWAP by ~9.5$, but "premium to VWAP" is lower than usual for the last 100 bars → space for medium return to the averages upwards without overheating.
• aVWAP (anchors): start 201.04, 60d 201.76, from swing low 223.35, from swing high 220.98 — we are below the swing anchors (locally the seller dominates) and above the global ones (start/60d).
* Donchian 20/55:
-20: High 241.70 / Mid 223.09 / Low 204.49 — trading between Mid and Low → frequent rotation to the Mid.
— 55: High 253.40 / Mid 228.94 / Low 204.49 — a more "distant" average target of 228.9.
• Volume Profile (~60d): POC ~203.21, VAL ~168.24, VAH ~239.71 — higher than POC, but still in the value price zone; POC often acts as a magnet/support.
• RSI(14): ~26.9 — oversold → increased risk of a rebound.
* MFI(14): ~17.9 — cash flow is oversold, similar to RSI but with volume consideration.
• CMF(20): ~−0.13 — total capital outflow, confirms seller pressure.
• MACD(12/26/9): line −6.93 below signal −5.75, hist. −1.18 — bearish momentum is active, but histogram is shrinking (weakening).
• ADX/DMI(14): ADX ~48.6; +DI ~4.7 / −DI ~38.5 — strong downward trend (−DI≫+DI).
* ATR(14): ~5.40$ — characteristic 4h range; useful for buffers.
• Keltner: Upper 232.25 / Mid 221.96 / Lower 211.66 — standing next to KC-Lower → typical rebound zone to Mid.
• Bollinger(20,2): Upper 245.91 / Mid 224.32 / Lower 202.73 — between BB-Lower and BB-Mid; mean-reversion up is a priority.
• BB-Squeeze: OFF — volatility is not compressed; the trend has already been established.
• z(Price−VWAP)[100] ≈ −2.25 — the "premium" to VWAP is below the norm → no overheating, and there is room for подтягивания к средним.
• OBV z-scores: z50 −1.85 / z100 −1.39 / z200 −0.56, OBV ROC(10) ≈ −0.78 — sales dominated, distribution; no fresh influx of buyers yet.
• Open Interest: ~7.95M, z(168) ≈ −0.11, ROC(5/10) ≈ +0.05 / +0.06 — moderate position set (non-aggressive), closer to neutral.
Latest divergences (auto-detector)
• RSI: bearish 13 Sep 03:00 → 14 Sep 03:00, bullish 17 Sep 03:00 → 17 Sep 15:00
• MACD: bullish 8 Sep 23:00 → 9 Sep 15:00, bearish 13 Sep 03:00 → 14 Sep 03:00
• OBV: bullish 30 Aug 15:00 → 1 Sep 03:00, bearish 13 Sep 03:00 → 14 Sep 03:00
• MFI: bearish 18 Sep 03:00 → 18 Sep 19:00, bearish 20 Sep 15:00 → 21 Sep 03:00
Reading divergences: fresh bullish signals are limited; some of the latest ones are bearish (especially on MFI/OBV), which restricts the scale of the rebound, but the oversold RSI/MFI still gives Edge to rotate to the averages.
⸻
What does this mean now
1. Mode: strong downtrend, but the price is pulled towards the lower shells (KC-Lower ~211.7 / BB-Lower ~202.7), the RSI/MFI is oversold, and the "premium to VWAP" is below normal → the base risk scenario is a rotation to the averages (221.9–224.3).
2. Profile: we are above POC ~203.2, inside the value-area (VAH ~239.7 / VAL ~168.2) → a POC retest is possible, but more often inside VA the market tends to average.
3. Derivatives: OI ≈ neutral/slightly ↑, OBV weak — a volume/capital inflow is needed for sustainable growth; otherwise, the rebound risks being “technical”.
⸻
Key levels
Resistances: 221.96 (KC-Mid) → 223.09 (Donch-20 Mid) → 224.32 (BB-Mid) → 228.94 (Donch-55 Mid) → 232.25 (KC-Upper) → 239.71 (VAH) → 241.70 (Donch-20 High) → 253.40 (Donch-55 High).
Supports: 211.66 (KC-Lower) → 204.49 (Donch-Low 20/55) → 202.73 (BB-Lower) → 203.21 (POC / support) → 201.04 (VWAP) → deeper — liquidity pockets from the profile (see JSON).
⸻
Scenarios and triggers (not financial advice)
A) Basic — rotation up to the middle / 222–224
• Trigger: 4h-close > 214.4 (≈ KC-Lower + 0.5×ATR) when RSI > 30, MFI > 25, hist. MACD↑, CMF → 0.
• Targets: 221.9–224.3 (KC/BB-Mid, Donch-20 Mid) → 228.9 → 232.3.
* Invalidator: return < 211.7 (KC-Lower) or sharp puncture < 209 (≈ KC-Lower − 0.5×ATR).
B) Continuation of the downward trend
• Trigger: 4h-close < 204.5 (Donch-Low) together with: ADX ≥ 40, OBV z50 ≤ −2, OI ROC+ on a red candle.
• Targets: 202.7 (BB-Lower) → ≈201.0 (VWAP) → with inertia — passes on LVN from the profile.
• Invalidator: return over 211.7 and hold.
C) Short-squeeze
• Trigger: impulse breakout and hold > 228.9 (Donch-55 Mid) or > 232.3 (KC-Upper) with OI falling on a green candle and OBV growing.
• Targets: 239.7 (VAH) → 241.7 → 253.4.
• Invalidator: fake breakout with return < 224.
⸻
Tactics (example of logic)
• Impulse long: after confirmation > 214.4. Partial fixation at 221.9–224.3, then trail to 228.9 → 232.3; stop under 211.7 or ~0.8–1.2×ATR (4.3–6.5$) from the entry.
• Reversal long (conservative): zones 211.7 (KC-Lower) and 203–205 (POC/Donch-Low) only when demand reacts (RSI/MFI up, CMF→0/+) — targets 223 → 229.
• Contra-trend short: carefully on rejection 228.9–232.3 (RSI<50, hist. MACD↓, OI ROC+) — targets 224 → 222 → 215; stop at 232.5–233.
⸻
In short: what to expect
The base scenario is a technical rebound to 222–224.
• We will fix ourselves above 224 → 229 → 232, and a corridor will open to 239–242.
• We will lose 211.7 and fix ourselves < 204.5 with OI↑, and we will continue down to 202.7 → 201.0 and below through thin zones.
Haftungsausschluss
Die Informationen und Veröffentlichungen sind nicht als Finanz-, Anlage-, Handels- oder andere Arten von Ratschlägen oder Empfehlungen gedacht, die von TradingView bereitgestellt oder gebilligt werden, und stellen diese nicht dar. Lesen Sie mehr in den Nutzungsbedingungen.
Haftungsausschluss
Die Informationen und Veröffentlichungen sind nicht als Finanz-, Anlage-, Handels- oder andere Arten von Ratschlägen oder Empfehlungen gedacht, die von TradingView bereitgestellt oder gebilligt werden, und stellen diese nicht dar. Lesen Sie mehr in den Nutzungsbedingungen.