4-Hour Chart (Swing Context)
Trend: Ascending channel formation after a prior downtrend.
Key Zone: Approaching the 81,900-82,100 supply zone.
Previous Break: Impulsive leg broke above 81,200, now acting as potential demand.
Bias: Bullish momentum, but within a significant resistance zone.
1-Hour Chart (Intraday Context)
Structure: Clear higher highs & higher lows (bullish structure).
Support: 81,200 level (former resistance turned demand) showing strong bounces.
Current Action: Consolidating below the 81,900-82,100 supply.
BOS: Confirms buyer dominance, but upside liquidity appears to be thinning.
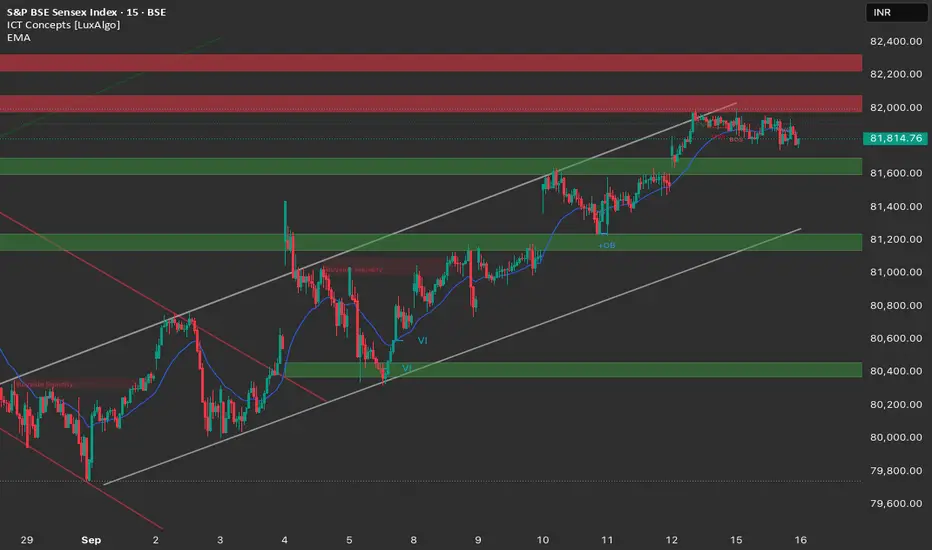
15-Minute Chart (Execution View)
Action: Sideways consolidation below 81,800.
OB: Order block around 81,100-81,200 acts as support buffer.
FVG: Minor FVGs in 81,300-81,350 zone may offer intraday support.
Channel: Price respecting the ascending channel boundaries.
Trade Plan (16th September)
Bullish Scenario
Entry: Buy on retracement near 81,100-81,200 demand zone (OB + structure support).
Targets:
TP1: 81,500 (intraday liquidity)
TP2: 81,900-82,000 (supply zone top & channel resistance)
Stop Loss: Below 81,000 (channel bottom & invalidation).
Bearish Scenario
Entry: Short on rejection of 81,900-82,100 zone with strong bearish signal (e.g., engulfing).
Targets:
TP1: 81,300 (potential FVG fill)
TP2: 81,100-81,200 (major demand zone/OB)
Stop Loss: Above 82,100.
Bias: Neutral-to-Bullish. Expecting a potential pullback to 81,100-81,200 before a move towards the 81,900-82,100 resistance.
Caution: If 81,100-81,200 fails, expect downside acceleration towards 80,800-80,600.
Trend: Ascending channel formation after a prior downtrend.
Key Zone: Approaching the 81,900-82,100 supply zone.
Previous Break: Impulsive leg broke above 81,200, now acting as potential demand.
Bias: Bullish momentum, but within a significant resistance zone.
1-Hour Chart (Intraday Context)
Structure: Clear higher highs & higher lows (bullish structure).
Support: 81,200 level (former resistance turned demand) showing strong bounces.
Current Action: Consolidating below the 81,900-82,100 supply.
BOS: Confirms buyer dominance, but upside liquidity appears to be thinning.
15-Minute Chart (Execution View)
Action: Sideways consolidation below 81,800.
OB: Order block around 81,100-81,200 acts as support buffer.
FVG: Minor FVGs in 81,300-81,350 zone may offer intraday support.
Channel: Price respecting the ascending channel boundaries.
Trade Plan (16th September)
Bullish Scenario
Entry: Buy on retracement near 81,100-81,200 demand zone (OB + structure support).
Targets:
TP1: 81,500 (intraday liquidity)
TP2: 81,900-82,000 (supply zone top & channel resistance)
Stop Loss: Below 81,000 (channel bottom & invalidation).
Bearish Scenario
Entry: Short on rejection of 81,900-82,100 zone with strong bearish signal (e.g., engulfing).
Targets:
TP1: 81,300 (potential FVG fill)
TP2: 81,100-81,200 (major demand zone/OB)
Stop Loss: Above 82,100.
Bias: Neutral-to-Bullish. Expecting a potential pullback to 81,100-81,200 before a move towards the 81,900-82,100 resistance.
Caution: If 81,100-81,200 fails, expect downside acceleration towards 80,800-80,600.
Haftungsausschluss
Die Informationen und Veröffentlichungen sind nicht als Finanz-, Anlage-, Handels- oder andere Arten von Ratschlägen oder Empfehlungen gedacht, die von TradingView bereitgestellt oder gebilligt werden, und stellen diese nicht dar. Lesen Sie mehr in den Nutzungsbedingungen.
Haftungsausschluss
Die Informationen und Veröffentlichungen sind nicht als Finanz-, Anlage-, Handels- oder andere Arten von Ratschlägen oder Empfehlungen gedacht, die von TradingView bereitgestellt oder gebilligt werden, und stellen diese nicht dar. Lesen Sie mehr in den Nutzungsbedingungen.