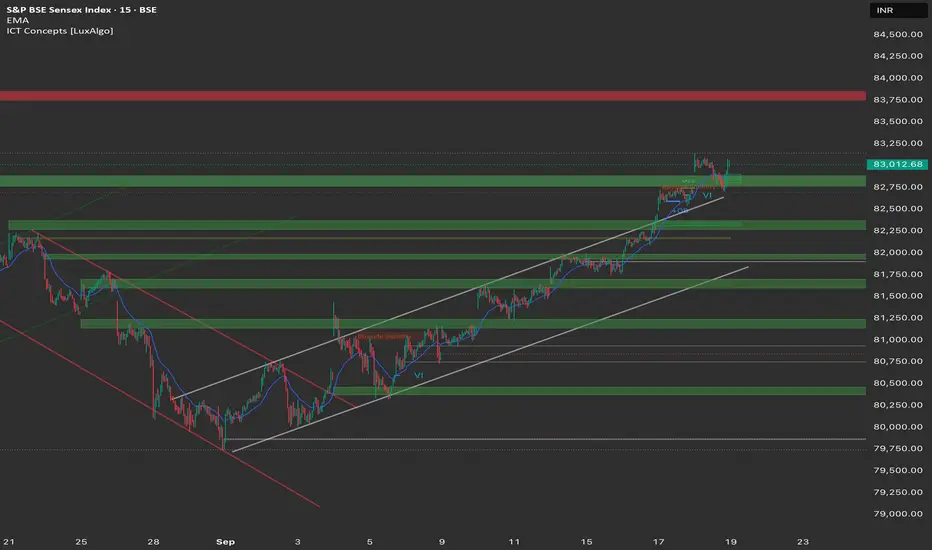
Current SENSEX (Yesterday's Close): 83,013.96
Overarching Theme: Similar to NIFTY and BANKNIFTY, Sensex is in a strong, impulsive uptrend. It has broken out of a recent consolidation and is now challenging a major resistance zone. The overall market sentiment is bullish.
Detailed Market Structure Breakdown
4-Hour Chart (Macro Trend)
Structure: The macro trend is clearly bullish. After a strong downward correction, the index formed an "Order Block" (OB) and then began a new, powerful uptrend. This is confirmed by the continuous "Break of Structure" (BOS) events and the price action staying within a well-defined ascending channel.
Key Levels:
Major Supply Zone (Resistance): 83,750 - 83,900. This is a major resistance level from a previous high. A decisive breakout here would confirm a strong continuation of the rally toward a new all-time high.
Major Demand Zone (Support): 81,800 - 82,000. This zone, which aligns with a previous resistance, has now become a solid support. It also contains a FVG (Fair Value Gap), making it a high-probability reversal area for any major pullback.
Outlook: The 4H chart suggests a bullish continuation. The recent BOS indicates strong buying interest, and any pullback to the 82,500 area would be a healthy re-test of the broken resistance.
1-Hour Chart (Intermediate View)
Structure: The 1H chart shows the short-term trend within the larger bullish structure. The price is trading within the ascending channel and recently broke above the 82,500 level. A minor correction is currently underway, bringing the price back to test the breakout level.
Key Levels:
Immediate Resistance: The recent high around 83,100.
Immediate Support: The 82,750 zone. This area marks the top of the previous consolidation and now acts as immediate support.
Outlook: The 1H chart shows a small correction is likely, but the trend remains bullish. The price is expected to find support at the 82,750 level before resuming its upward move.
15-Minute Chart (Intraday View)
Structure: The 15M chart shows the most recent price action, with the index consolidating after a sharp move up. It is currently trading sideways, and a "Market Structure Shift" (MSS) has occurred, signaling a possible temporary pause or reversal.
Key Levels:
Intraday Supply Zone: The high around 83,100.
Intraday Demand Zone: The low of the recent consolidation around 82,750.
Outlook: The short-term bias is neutral as the market awaits a catalyst. A breakout from this range will determine the intraday direction.
📈 Today's Trade Plan
Market Outlook: Sensex is bullish on all major timeframes. The intraday consolidation is a crucial "decision point" for today's trading.
Bullish Scenario (Primary Plan)
Justification: The strong underlying trend suggests a continuation towards the major resistance zone.
Entry: Place a long entry on a decisive break and 15-minute candle close above the 83,100 intraday high.
Stop Loss (SL): Below 82,900 to protect against a reversal.
Targets:
T1: 83,300 (Minor psychological resistance).
T2: 83,750 (Major 4H chart supply zone).
Bearish Scenario (Counter-Trend Plan)
Justification: This plan is for a short-term correction within the uptrend, should the consolidation break to the downside.
Trigger: A confirmed breakdown and 15-minute candle close below the 82,750 immediate support.
Entry: Short entry on a breakdown retest of the 82,750 level.
Stop Loss (SL): Above 82,900.
Targets:
T1: 82,500 (Previous breakout level and first strong support).
T2: 82,200 (Further demand zone).
Key Levels for Observation:
Immediate Decision Point: 82,750 - 83,100.
Bullish Confirmation: A break above 83,100.
Warning Sign: A drop below 82,750.
Haftungsausschluss
Die Informationen und Veröffentlichungen sind nicht als Finanz-, Anlage-, Handels- oder andere Arten von Ratschlägen oder Empfehlungen gedacht, die von TradingView bereitgestellt oder gebilligt werden, und stellen diese nicht dar. Lesen Sie mehr in den Nutzungsbedingungen.
Haftungsausschluss
Die Informationen und Veröffentlichungen sind nicht als Finanz-, Anlage-, Handels- oder andere Arten von Ratschlägen oder Empfehlungen gedacht, die von TradingView bereitgestellt oder gebilligt werden, und stellen diese nicht dar. Lesen Sie mehr in den Nutzungsbedingungen.