Descending Channel Near Breakout! Bulls Watching $45.8 Zone 🔥
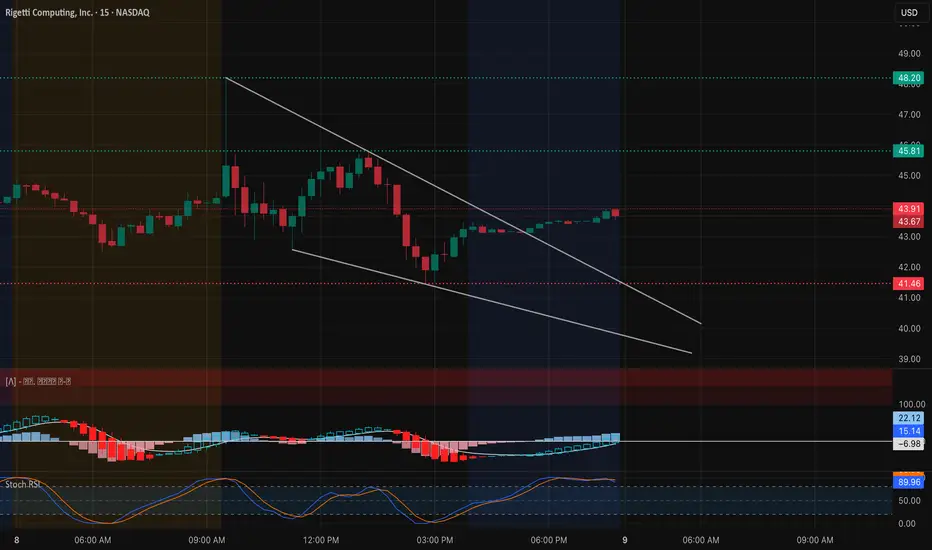
Rigetti Computing (RGTI) has been moving inside a descending channel, forming a clear base near $43 while showing multiple CHoCH signals that suggest potential reversal behavior. The 15-minute chart reveals that buyers have stepped in around $41.4 — a critical support zone — and price is now pressing against the upper channel trendline.
The recent CHoCH at $43.9 confirms short-term accumulation, and MACD is now trending upward from negative territory with momentum gradually improving. The Stoch RSI remains high, suggesting that while momentum is bullish, short-term cooling may occur before another leg higher.
A breakout above the descending channel around $44.5–$45 could trigger a technical rally toward $46–$48, while failure to hold $43 support may reopen the path toward $41.4 or lower.
Support and Resistance Levels:
* Immediate Resistance: $44.5 → $45.8
* Major Resistance (Target Zone): $48.2 → $49.0
* Immediate Support: $43.0 → $42.2
* Key Support Zone: $41.4 → $40.5
Technical Insights:
* Descending Channel: Price is nearing the upper trendline — a breakout could mark the start of a short-term bullish reversal.
* MACD: Histogram bars are turning positive, signaling recovering momentum after a deep pullback.
* Stoch RSI: Overbought but holding firm, showing that buyers are still active while momentum consolidates.
* Volume: Uptick in green bars during CHoCH levels shows gradual accumulation by buyers.
Trade Scenarios:
Bullish Setup:
* Entry: Above $44.5 breakout confirmation
* Target 1: $45.8
* Target 2: $48.2
* Stop-Loss: Below $42.8
* Rationale: Clear structure shift, bullish MACD crossover, and breakout from descending channel support a reversal toward upper resistance.
Bearish Setup:
* Entry: Below $42.8 breakdown
* Target 1: $41.4
* Target 2: $40.5
* Stop-Loss: Above $44.0
* Rationale: A rejection from the upper channel or false breakout could lead to renewed selling back to the lower boundary.
RGTI is at a pivotal technical point — a confirmed breakout from the descending channel could send it back toward the $46–$48 zone, while a failure here might see a retest of the $41.4 support base. Watch momentum closely around $44.5 for direction confirmation.
Disclaimer: This analysis is for educational purposes only and does not constitute financial advice. Always do your own research and manage your risk before trading.
If anyone needs me to TA any stock, PM me.
Haftungsausschluss
Die Informationen und Veröffentlichungen sind nicht als Finanz-, Anlage-, Handels- oder andere Arten von Ratschlägen oder Empfehlungen gedacht, die von TradingView bereitgestellt oder gebilligt werden, und stellen diese nicht dar. Lesen Sie mehr in den Nutzungsbedingungen.
Haftungsausschluss
Die Informationen und Veröffentlichungen sind nicht als Finanz-, Anlage-, Handels- oder andere Arten von Ratschlägen oder Empfehlungen gedacht, die von TradingView bereitgestellt oder gebilligt werden, und stellen diese nicht dar. Lesen Sie mehr in den Nutzungsbedingungen.