Topic Statement:
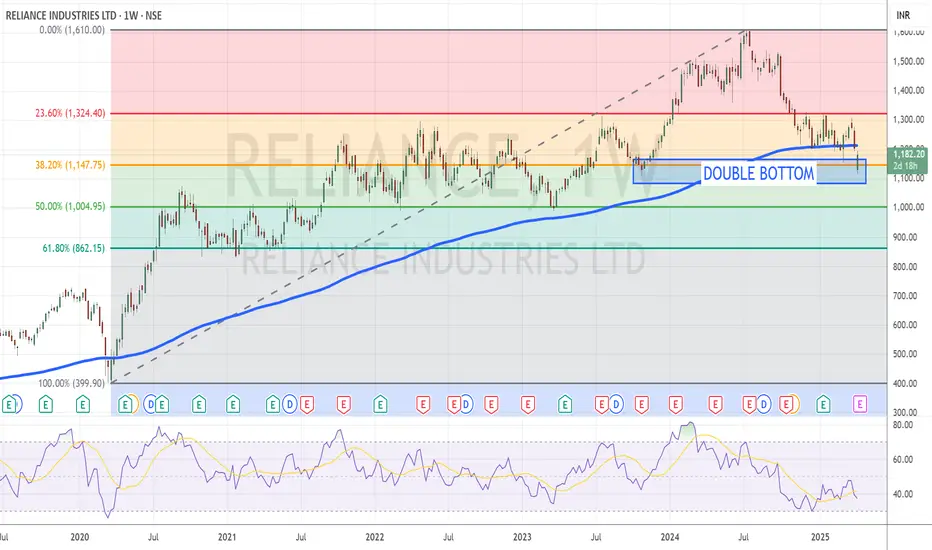
Reliance has undergone a healthy correction in line with the broader market and is showing signs of a potential reversal from key support levels.
Key Points:
- The stock is taking strong support at the 38.2% Fibonacci retracement level near ₹1147.
- Candlestick pattern indicates the formation of a potential double bottom.
- Price is trading below the 180-day EMA, suggesting an oversold condition.
- Weekly RSI stands at 37.5, further confirming the stock is in an oversold zone.
Haftungsausschluss
Die Informationen und Veröffentlichungen sind nicht als Finanz-, Anlage-, Handels- oder andere Arten von Ratschlägen oder Empfehlungen gedacht, die von TradingView bereitgestellt oder gebilligt werden, und stellen diese nicht dar. Lesen Sie mehr in den Nutzungsbedingungen.
Haftungsausschluss
Die Informationen und Veröffentlichungen sind nicht als Finanz-, Anlage-, Handels- oder andere Arten von Ratschlägen oder Empfehlungen gedacht, die von TradingView bereitgestellt oder gebilligt werden, und stellen diese nicht dar. Lesen Sie mehr in den Nutzungsbedingungen.