https://www.tradingview.com/x/xVJOxxVJ
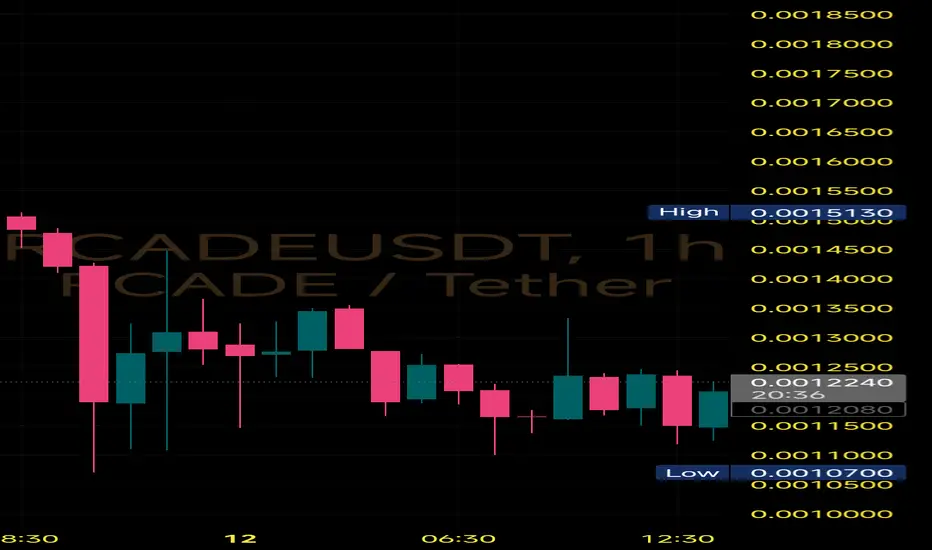
#RCADE is showing signs of a potential reversal on the 1Hr timeframe, forming a Double Bottom near the 0.00117 support zone.
🔹Bottom 1 and Bottom 2 are now clearly defined
🔹Neckline resistance at ~0.00145
🔹Current price hovering around 0.00122
Bullish only if -
A breakout and close above 0.00145 with volume = confirmation of reversal
Target zone = 0.00160–0.00170
Breakdown below 0.00117 would invalidate the double bottom setup
⏳ Price is compressing—watch for breakout attempts soon.
Haftungsausschluss
Die Informationen und Veröffentlichungen sind nicht als Finanz-, Anlage-, Handels- oder andere Arten von Ratschlägen oder Empfehlungen gedacht, die von TradingView bereitgestellt oder gebilligt werden, und stellen diese nicht dar. Lesen Sie mehr in den Nutzungsbedingungen.
Haftungsausschluss
Die Informationen und Veröffentlichungen sind nicht als Finanz-, Anlage-, Handels- oder andere Arten von Ratschlägen oder Empfehlungen gedacht, die von TradingView bereitgestellt oder gebilligt werden, und stellen diese nicht dar. Lesen Sie mehr in den Nutzungsbedingungen.