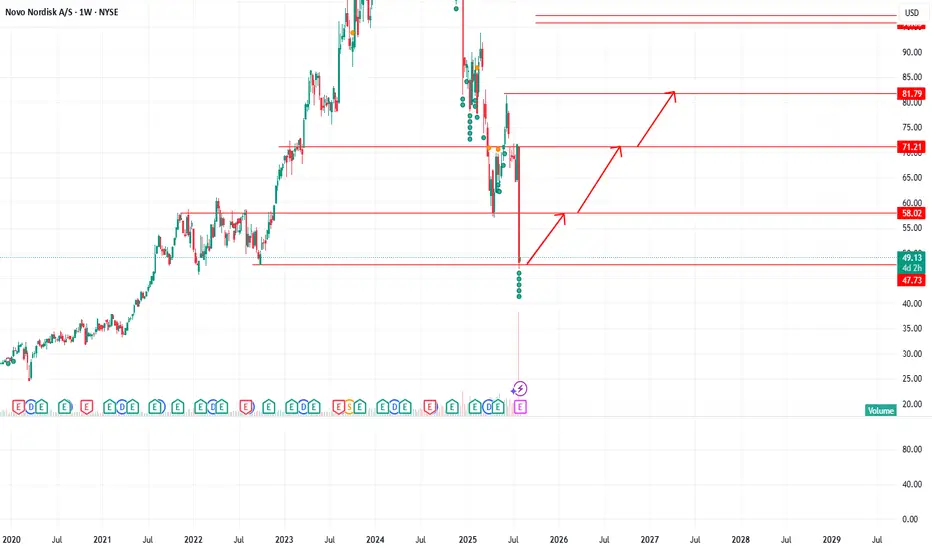
Novo Nordisk (NVO) recently saw a sharp drop with heavy volume, signaling strong selling pressure. The chart shows a potential recovery path if the stock holds support near $47.
🔄 Possible rebound levels:
First target: $58
Mid target: $71
Final target: $82
📊 Options flow shows strong call activity (bullish bets), with a low put/call ratio, suggesting some traders expect a bounce. However, momentum is still weak, and if $47 fails, further downside toward $36 or lower is possible.
Haftungsausschluss
Die Informationen und Veröffentlichungen sind nicht als Finanz-, Anlage-, Handels- oder andere Arten von Ratschlägen oder Empfehlungen gedacht, die von TradingView bereitgestellt oder gebilligt werden, und stellen diese nicht dar. Lesen Sie mehr in den Nutzungsbedingungen.
Haftungsausschluss
Die Informationen und Veröffentlichungen sind nicht als Finanz-, Anlage-, Handels- oder andere Arten von Ratschlägen oder Empfehlungen gedacht, die von TradingView bereitgestellt oder gebilligt werden, und stellen diese nicht dar. Lesen Sie mehr in den Nutzungsbedingungen.