Based on the charts and the market's performance on Thursday, September 25, the Nifty has seen a decisive breakdown of a critical demand zone, accelerating the short-term correction. The market is now officially in a short-term bearish phase.
Detailed Market Structure Breakdown
4-Hour Chart (Macro Trend)
Structure: The Nifty has definitively broken the 25,050 - 25,100 major demand zone. This is a significant technical development that signals the failure of the bulls to defend the primary breakout level, confirming the Market Structure Shift (MSS) to the downside. The price is now trading in a steep descending channel.
Key Levels:
Major Supply (Resistance): 25,050 - 25,100. This previous support is now a crucial overhead resistance. Any bounce will likely be sold here.
Major Demand (Support): The next strong support zone is around 24,850 - 24,900, which includes the closing price and a small consolidation area. The most significant macro support below that is at 24,650 - 24,700.
Outlook: The long-term bias is now turning cautiously bearish. A sustained move below 25,000 implies targets of 24,700 and possibly lower.
1-Hour Chart (Intermediate View)
Structure: The 1H chart is clearly bearish, trading in a well-defined descending channel and consistently printing lower highs and lower lows. The sharp move on Thursday broke the final line of defense at 25,000.
Key Levels:
Immediate Resistance: The upper trendline of the descending channel and the 25,050 level.
Immediate Support: The bottom of the descending channel, currently around 24,880.
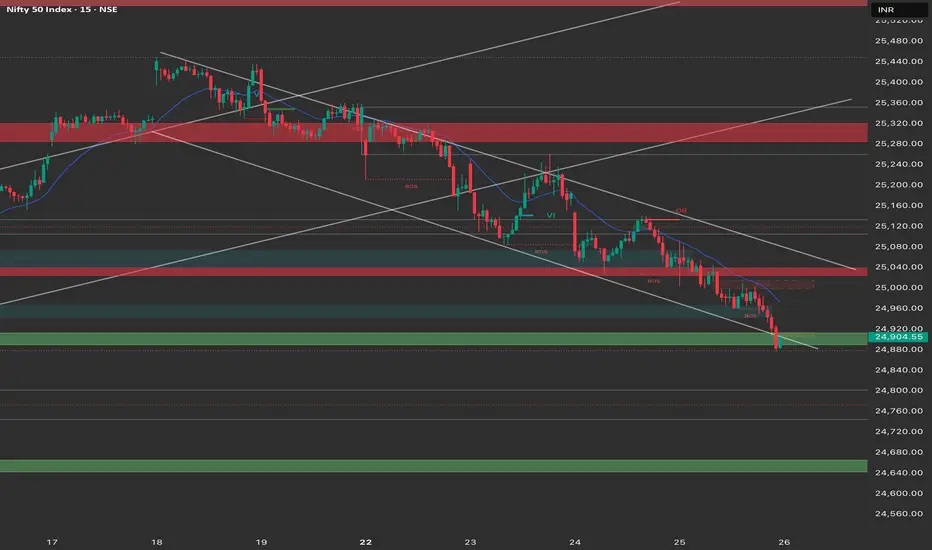
15-Minute Chart (Intraday View)
Structure: The 15M chart shows relentless selling pressure. The price made a clear BOS (Break of Structure) below 25,000 and the subsequent bounce was sold off immediately. The market closed near its daily low, confirming strong bearish control.
Key Levels:
Intraday Supply: 24,960 - 25,000. This area represents the high of the recent small consolidation and the psychological resistance.
Intraday Demand: 24,850 - 24,900. This zone, which includes the closing price, is the final immediate buffer before the next leg down.
Outlook: The intraday bias is strongly bearish. A "sell on rise" strategy is highly favored.
Trade Plan (Friday, 26th September)
Market Outlook: The Nifty is bearish across all timeframes. The primary strategy should focus on shorting on any rise toward resistance or a clean breakdown of the immediate support.
Bearish Scenario (Primary Plan)
Justification: The breakdown of the 25,000 support is a powerful bearish signal. The trend is now firmly down.
Entry: Look for a short entry on a retest of the 24,960 - 25,000 resistance zone and rejection. Alternatively, a decisive break and 15-minute close below 24,870 (breaking the current low).
Stop Loss (SL): Place a stop loss above 25,030 (above the immediate swing high).
Targets:
T1: 24,800 (Next major psychological level).
T2: 24,650 - 24,700 (Major 4H demand zone).
Bullish Scenario (Counter-Trend Plan)
Justification: This is a high-risk, counter-trend plan and should only be taken on a strong move.
Trigger: A sustained move and close above the major resistance at 25,050.
Entry: Long entry on a confirmed 15-minute close above 25,050.
Stop Loss (SL): Below 24,960.
Targets:
T1: 25,180 (Breakdown level and minor resistance).
T2: 25,300 (Upper end of the descending channel).
Key Levels for Observation:
Immediate Decision Point: 24,870 - 25,000.
Bearish Confirmation: A break and sustained move below 24,870.
Bullish Confirmation: A recapture of the 25,050 level.
Line in the Sand: 25,050. The market remains under bearish pressure below this level.
Detailed Market Structure Breakdown
4-Hour Chart (Macro Trend)
Structure: The Nifty has definitively broken the 25,050 - 25,100 major demand zone. This is a significant technical development that signals the failure of the bulls to defend the primary breakout level, confirming the Market Structure Shift (MSS) to the downside. The price is now trading in a steep descending channel.
Key Levels:
Major Supply (Resistance): 25,050 - 25,100. This previous support is now a crucial overhead resistance. Any bounce will likely be sold here.
Major Demand (Support): The next strong support zone is around 24,850 - 24,900, which includes the closing price and a small consolidation area. The most significant macro support below that is at 24,650 - 24,700.
Outlook: The long-term bias is now turning cautiously bearish. A sustained move below 25,000 implies targets of 24,700 and possibly lower.
1-Hour Chart (Intermediate View)
Structure: The 1H chart is clearly bearish, trading in a well-defined descending channel and consistently printing lower highs and lower lows. The sharp move on Thursday broke the final line of defense at 25,000.
Key Levels:
Immediate Resistance: The upper trendline of the descending channel and the 25,050 level.
Immediate Support: The bottom of the descending channel, currently around 24,880.
15-Minute Chart (Intraday View)
Structure: The 15M chart shows relentless selling pressure. The price made a clear BOS (Break of Structure) below 25,000 and the subsequent bounce was sold off immediately. The market closed near its daily low, confirming strong bearish control.
Key Levels:
Intraday Supply: 24,960 - 25,000. This area represents the high of the recent small consolidation and the psychological resistance.
Intraday Demand: 24,850 - 24,900. This zone, which includes the closing price, is the final immediate buffer before the next leg down.
Outlook: The intraday bias is strongly bearish. A "sell on rise" strategy is highly favored.
Trade Plan (Friday, 26th September)
Market Outlook: The Nifty is bearish across all timeframes. The primary strategy should focus on shorting on any rise toward resistance or a clean breakdown of the immediate support.
Bearish Scenario (Primary Plan)
Justification: The breakdown of the 25,000 support is a powerful bearish signal. The trend is now firmly down.
Entry: Look for a short entry on a retest of the 24,960 - 25,000 resistance zone and rejection. Alternatively, a decisive break and 15-minute close below 24,870 (breaking the current low).
Stop Loss (SL): Place a stop loss above 25,030 (above the immediate swing high).
Targets:
T1: 24,800 (Next major psychological level).
T2: 24,650 - 24,700 (Major 4H demand zone).
Bullish Scenario (Counter-Trend Plan)
Justification: This is a high-risk, counter-trend plan and should only be taken on a strong move.
Trigger: A sustained move and close above the major resistance at 25,050.
Entry: Long entry on a confirmed 15-minute close above 25,050.
Stop Loss (SL): Below 24,960.
Targets:
T1: 25,180 (Breakdown level and minor resistance).
T2: 25,300 (Upper end of the descending channel).
Key Levels for Observation:
Immediate Decision Point: 24,870 - 25,000.
Bearish Confirmation: A break and sustained move below 24,870.
Bullish Confirmation: A recapture of the 25,050 level.
Line in the Sand: 25,050. The market remains under bearish pressure below this level.
Haftungsausschluss
Die Informationen und Veröffentlichungen sind nicht als Finanz-, Anlage-, Handels- oder andere Arten von Ratschlägen oder Empfehlungen gedacht, die von TradingView bereitgestellt oder gebilligt werden, und stellen diese nicht dar. Lesen Sie mehr in den Nutzungsbedingungen.
Haftungsausschluss
Die Informationen und Veröffentlichungen sind nicht als Finanz-, Anlage-, Handels- oder andere Arten von Ratschlägen oder Empfehlungen gedacht, die von TradingView bereitgestellt oder gebilligt werden, und stellen diese nicht dar. Lesen Sie mehr in den Nutzungsbedingungen.