4-Hour Chart:
Trend Context: The market has been in a strong uptrend, but recent action shows consolidation. Price is nearing a significant overhead resistance.
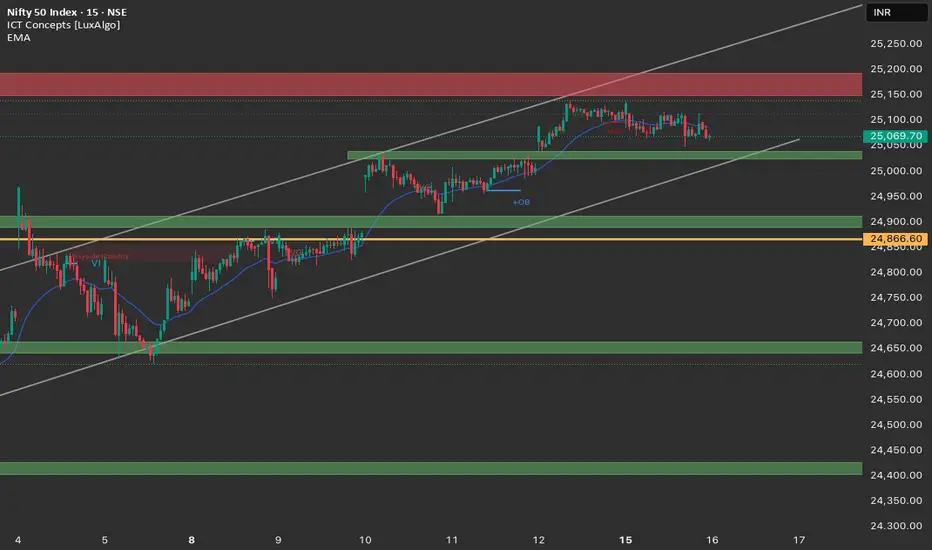
Key Resistance: The zone around 25,150 - 25,250 has been a strong area of selling pressure.
Key Support: The area between 25,000 - 25,070 is crucial. This was previously resistance broken to the upside and is now being tested as support, also coinciding with the lower boundary of an ascending channel.
Observation: Price is consolidating within this range, indicating a potential decision point.
1-Hour Chart:
Intraday Structure: The 1-hour chart confirms the sideways consolidation. Bullish momentum appears to be waning as price struggles to push higher.
EMA (20): Currently hovering around 25,051, acting as a dynamic intraday pivot. Price has recently been trading around or below it.
Liquidity: Expect buy-side liquidity above the resistance zone (25,150 - 25,250) and sell-side liquidity below the support zone (25,000).
Summary of Key Dynamics:
Nifty is at a critical juncture, squeezed between strong resistance and a support zone that also forms the lower edge of an ascending channel. The coming session will likely dictate the short-term direction.
Trade Plan - Nifty 50 (16th September 2025)
Bullish Scenario:
Entry Triggers:
A confirmed hold and bounce from the 25,000 - 25,070 support zone, showing bullish strength.
A decisive, sustained break and close above 25,150.
Target Levels:
25,100 (immediate target on bounce)
25,150 - 25,250 (major resistance zone)
25,300+ (potential extension if resistance breaks cleanly)
Stop Loss:
For entries around support: Below 25,000.
For breakout entries: Below 25,100 or the low of the breakout candle.
Bearish Scenario:
Entry Triggers:
A clear breakdown and sustained trade below the 25,000 - 25,070 support and the ascending channel.
A strong bearish rejection at the 25,150 - 25,250 resistance zone.
Target Levels:
24,950 (psychological level)
24,900 (previous key support)
24,800 - 24,850 (lower demand zone)
Stop Loss:
For breakdown entries: Above 25,050 or the recent high formed before the breakdown.
For rejection entries: Above the high of the bearish rejection candle at resistance.
🎯 Bias for 16th September 2025
Neutral to Cautiously Bearish in the Short Term. The market is consolidating at a key resistance. A breakdown below 25,000 would signal immediate weakness.
Conversely, a firm break and hold above 25,150 would rekindle bullish sentiment. The reaction at the 25,000 - 25,070 support will be the primary determinant of intraday direction.
Trend Context: The market has been in a strong uptrend, but recent action shows consolidation. Price is nearing a significant overhead resistance.
Key Resistance: The zone around 25,150 - 25,250 has been a strong area of selling pressure.
Key Support: The area between 25,000 - 25,070 is crucial. This was previously resistance broken to the upside and is now being tested as support, also coinciding with the lower boundary of an ascending channel.
Observation: Price is consolidating within this range, indicating a potential decision point.
1-Hour Chart:
Intraday Structure: The 1-hour chart confirms the sideways consolidation. Bullish momentum appears to be waning as price struggles to push higher.
EMA (20): Currently hovering around 25,051, acting as a dynamic intraday pivot. Price has recently been trading around or below it.
Liquidity: Expect buy-side liquidity above the resistance zone (25,150 - 25,250) and sell-side liquidity below the support zone (25,000).
Summary of Key Dynamics:
Nifty is at a critical juncture, squeezed between strong resistance and a support zone that also forms the lower edge of an ascending channel. The coming session will likely dictate the short-term direction.
Trade Plan - Nifty 50 (16th September 2025)
Bullish Scenario:
Entry Triggers:
A confirmed hold and bounce from the 25,000 - 25,070 support zone, showing bullish strength.
A decisive, sustained break and close above 25,150.
Target Levels:
25,100 (immediate target on bounce)
25,150 - 25,250 (major resistance zone)
25,300+ (potential extension if resistance breaks cleanly)
Stop Loss:
For entries around support: Below 25,000.
For breakout entries: Below 25,100 or the low of the breakout candle.
Bearish Scenario:
Entry Triggers:
A clear breakdown and sustained trade below the 25,000 - 25,070 support and the ascending channel.
A strong bearish rejection at the 25,150 - 25,250 resistance zone.
Target Levels:
24,950 (psychological level)
24,900 (previous key support)
24,800 - 24,850 (lower demand zone)
Stop Loss:
For breakdown entries: Above 25,050 or the recent high formed before the breakdown.
For rejection entries: Above the high of the bearish rejection candle at resistance.
🎯 Bias for 16th September 2025
Neutral to Cautiously Bearish in the Short Term. The market is consolidating at a key resistance. A breakdown below 25,000 would signal immediate weakness.
Conversely, a firm break and hold above 25,150 would rekindle bullish sentiment. The reaction at the 25,000 - 25,070 support will be the primary determinant of intraday direction.
Haftungsausschluss
Die Informationen und Veröffentlichungen sind nicht als Finanz-, Anlage-, Handels- oder andere Arten von Ratschlägen oder Empfehlungen gedacht, die von TradingView bereitgestellt oder gebilligt werden, und stellen diese nicht dar. Lesen Sie mehr in den Nutzungsbedingungen.
Haftungsausschluss
Die Informationen und Veröffentlichungen sind nicht als Finanz-, Anlage-, Handels- oder andere Arten von Ratschlägen oder Empfehlungen gedacht, die von TradingView bereitgestellt oder gebilligt werden, und stellen diese nicht dar. Lesen Sie mehr in den Nutzungsbedingungen.