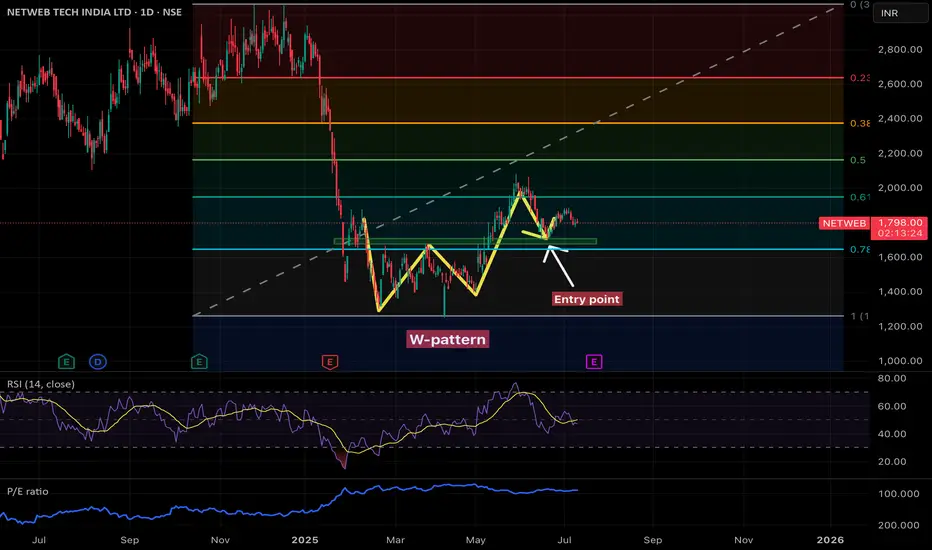
🧩 Chart Type: Daily (1D)
🔍 Pattern Observed: W-Pattern (Double Bottom)
• The W-pattern (double bottom) is a bullish reversal pattern.
• It indicates that the stock found strong support at a similar price level twice, suggesting potential accumulation.
• Breakout occurred after the second bottom, which was followed by a rally.
🎯 Key Technical Elements:
✅ Entry Point:
• Clearly marked just after the breakout from the neckline of the W-pattern.
• This aligns with a previous resistance level turning into support — a classic bullish confirmation.
• The green zone shows a support area, acting as a cushion for price retracement.
📏 Fibonacci Retracement Levels:
• Levels shown range from 0 to 1 (bottom to top of the recent trend).
• Price is hovering near the 0.618 Fibonacci level, a key retracement support (often termed the “golden ratio”).
• Below 0.618 lies the 0.786 level, which aligns with the marked support area — critical zone to watch for bulls.
📉 Indicators:
🔵 RSI (Relative Strength Index - 14):
• Currently in the neutral zone (~40-50) — neither overbought nor oversold.
• RSI previously bounced from oversold levels during W-pattern formation.
• No bullish divergence noted currently, but a bounce from 40 RSI could trigger a buying signal.
📘 P/E Ratio (Blue Line):
• Remains relatively steady after a spike — valuation seems to have normalized.
• Watch for any sharp moves that deviate from price action.
📌 Support and Resistance:
• Support:
• 1,700–1,750 INR (green zone, 0.786 level, neckline retest)
Resistance:
• ~1,950 INR (0.618 Fibonacci level)
• ~2,200 INR (0.5 Fibonacci level)
⚠️ Risk Factors:
• If price closes below the 0.786 retracement zone, W-pattern may fail.
• Volume data isn’t shown in detail, so confirmation on breakout strength is missing.
• A break below 1,650 INR could trigger stop-losses and invalidate the pattern.
✅ Conclusion:
• Bullish bias remains intact as long as price holds above the neckline and Fibonacci support.
• Entry near the support zone (green box) offers a favorable risk-to-reward ratio.
• Target levels: 1,950, 2,200, and possibly 2,400+ INR on trend continuation.
• Keep RSI and price action in sync for re-entry or exit signals.
Haftungsausschluss
Die Informationen und Veröffentlichungen sind nicht als Finanz-, Anlage-, Handels- oder andere Arten von Ratschlägen oder Empfehlungen gedacht, die von TradingView bereitgestellt oder gebilligt werden, und stellen diese nicht dar. Lesen Sie mehr in den Nutzungsbedingungen.
Haftungsausschluss
Die Informationen und Veröffentlichungen sind nicht als Finanz-, Anlage-, Handels- oder andere Arten von Ratschlägen oder Empfehlungen gedacht, die von TradingView bereitgestellt oder gebilligt werden, und stellen diese nicht dar. Lesen Sie mehr in den Nutzungsbedingungen.