*Due to the platform's features, the charts are arranged in sequence from left to right, from the first to the Eighth chart.
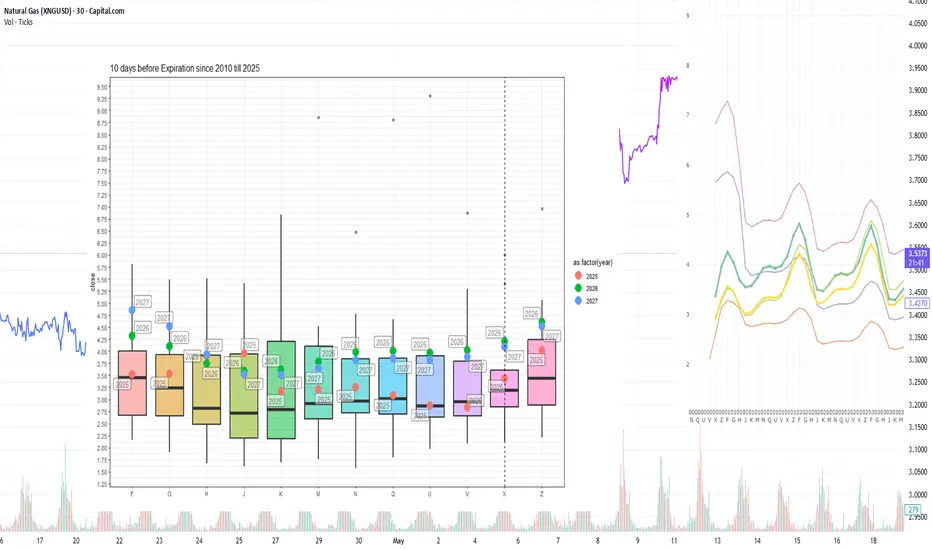
Current prices compared to price dispersion 10 days before expiration by month since 2010
[Chart-1]
The next NGX25 contract is trading above the 10-day average level before expiration and is showing significant volatility during this period. Prices for 2026 winter contracts continue to remain above the upper limit of the interquartile range, reflecting a steady upward trend ahead of the winter period.
Forward curve compared to 2020-2025
[Chart-2]
The shape of the forward curve in 2025 remains stable and converges even more closely with the configurations observed in 2023 and 2024 for similar dates. This trend is most evident for contracts with delivery terms of three years or more, where there is a steady convergence towards historical price levels.
Current stocks and forecast for next week compared to 2019-2024
[Chart-3]
According to the forecast for week 39 (September 22–28), underground storage stocks will increase by +64 BCF to reach 3,572 BCF, exceeding the level for the same week last year. The growth in stocks is supported by high production volumes, which remain the main driver of stock growth.
Weekly HDD+CDD sum based on current NOAA data and forecast for the next two weeks compared to 1994-2024
[Chart-4]
In week 40 of this year, HDD+CDD values for the continental United States remain significantly below the average values for the last 30 years of observations, as clearly shown in the graph for 2025. The forecast for week 41 also indicates that this trend will continue: a further decline in values relative to historical levels is expected, which may continue to exert downward pressure on demand and energy prices.
Explanation of the graph: the candles represent quantiles for 30 years from 1994 to 2024. Red dots represent 2024, green dots represent 2025, and blue dots represent the 2025 forecast.
Weekly HDD+CDD total based on current NOAA data and forecast for the next two weeks compared to 1994-2024 by region
[Chart-5]
A steady trend is observed in the leading regions: HDD+CDD values in 2025 remain below the historical averages for 1995–2024 in virtually all areas. The lag in indicators corresponds to the generally mild weather of the season and reduced energy demand for heating and cooling, which is recorded in all major regions.
Weekly total supply/demand difference compared to 2014-2024
[Chart-6]
This week, the difference between supply and demand in 2025 is at the average values for 2014–2024.
Number of days for delivery from warehouses
[Chart-7]
The graph shows the number of days of supply from storage alone, based on current consumption levels. In February–March 2025, reserves will be at 10–18 days, which is comparable to or slightly below average. In May–August, reserves will increase to 25–35 days, which is slightly below the 10-year average. At the beginning of October 2025, the number of days of consumption from reserves will have increased to 35 days, which is at the lower end of the IQR. The moderate level of storage adequacy to meet current demand creates a fundamentally tighter market, where even moderate production disruptions or minor spikes in demand can cause disproportionate price reactions, especially in late winter and early spring.
Anomalies in weather (HDD+CDD) and fundamental factors
[Chart-8]
Overall, fundamental factors and weather anomalies are within the expected range, with no systemic deviations, except for isolated declines in LNG exports caused by technical work at individual terminals.
This analysis was conducted in cooperation with Anastasia Volkova, analyst of LSE.
Head of Analytics Center at the European broker Mind-Money.eu
👉 mind-money.eu
Website
👉 igorisaev.com/
👉 mind-money.eu
Website
👉 igorisaev.com/
Haftungsausschluss
Die Informationen und Veröffentlichungen sind nicht als Finanz-, Anlage-, Handels- oder andere Arten von Ratschlägen oder Empfehlungen gedacht, die von TradingView bereitgestellt oder gebilligt werden, und stellen diese nicht dar. Lesen Sie mehr in den Nutzungsbedingungen.