1-Hour Technical Outlook
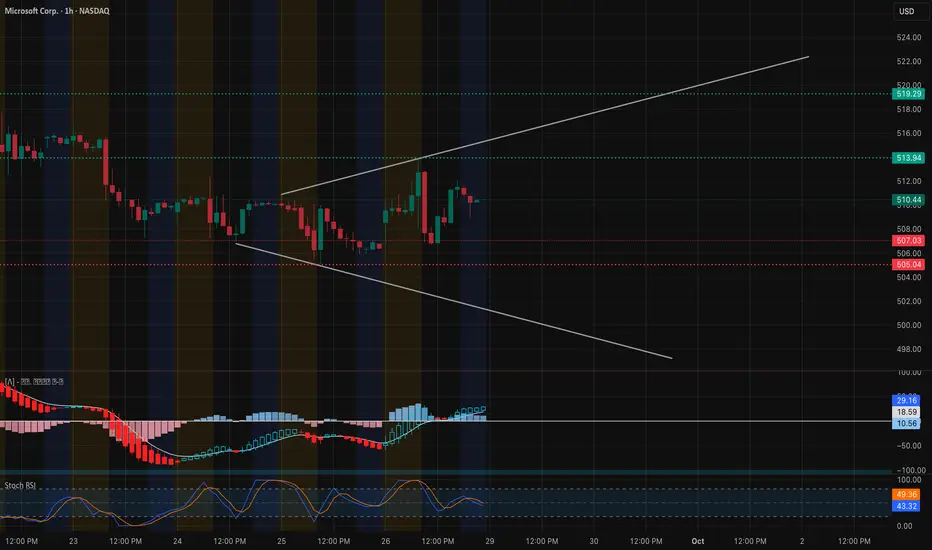
Microsoft is forming an expanding wedge after a week of sideways-to-up action. Price is trading around $510–$511, testing mid-wedge support after a strong bounce from the $505 floor. MACD histogram is positive and climbing, and the Stoch RSI is curling up from mid-range, signaling that momentum is resetting for another potential leg higher.
Key resistance to watch is $513.9, with heavier supply stacked at $519–$520. On the downside, the critical support remains $505, with a safety net near $500.
Gamma Exposure (GEX) Confirmation

Options positioning provides solid backup to the chart:
Largest positive GEX / Call Resistance sits at $512, now acting as the key breakout trigger.
Next call walls cluster at $519–$520 (~44% call interest), matching the top of the expanding wedge.
On the downside, put support is significant at $500, aligning with the technical safety zone.
This GEX structure suggests that a strong hourly close above $513.9 could unleash dealer hedging that pushes MSFT quickly toward $519–$520. If $505 fails, negative gamma flow may accelerate selling to the $500 area.
Trade Ideas & Option Plays for This Week
Bullish Play: Go long on a sustained move above $513.9, targeting $519–$520. Options: 1-week 515 calls or 515/520 call spreads to keep risk contained.
Protective Hedge / Bearish Setup: Short below $505, looking for a slide to $500. Suitable instruments: 505/500 put spreads or short-dated puts.
With IVR near 21.4 and IVx around 22.9, premiums are relatively mild—ideal for debit spreads.
My Take
MSFT is showing early signs of accumulation inside a broadening formation. Gamma levels perfectly reinforce the $512 breakout line and the $505 fail-safe. Unless sellers regain control under $505, the stock leans toward a bullish continuation this week.
Disclaimer: This analysis is for educational purposes only and does not constitute financial advice. Always do your own research and manage risk before trading.
Microsoft is forming an expanding wedge after a week of sideways-to-up action. Price is trading around $510–$511, testing mid-wedge support after a strong bounce from the $505 floor. MACD histogram is positive and climbing, and the Stoch RSI is curling up from mid-range, signaling that momentum is resetting for another potential leg higher.
Key resistance to watch is $513.9, with heavier supply stacked at $519–$520. On the downside, the critical support remains $505, with a safety net near $500.
Gamma Exposure (GEX) Confirmation
Options positioning provides solid backup to the chart:
Largest positive GEX / Call Resistance sits at $512, now acting as the key breakout trigger.
Next call walls cluster at $519–$520 (~44% call interest), matching the top of the expanding wedge.
On the downside, put support is significant at $500, aligning with the technical safety zone.
This GEX structure suggests that a strong hourly close above $513.9 could unleash dealer hedging that pushes MSFT quickly toward $519–$520. If $505 fails, negative gamma flow may accelerate selling to the $500 area.
Trade Ideas & Option Plays for This Week
Bullish Play: Go long on a sustained move above $513.9, targeting $519–$520. Options: 1-week 515 calls or 515/520 call spreads to keep risk contained.
Protective Hedge / Bearish Setup: Short below $505, looking for a slide to $500. Suitable instruments: 505/500 put spreads or short-dated puts.
With IVR near 21.4 and IVx around 22.9, premiums are relatively mild—ideal for debit spreads.
My Take
MSFT is showing early signs of accumulation inside a broadening formation. Gamma levels perfectly reinforce the $512 breakout line and the $505 fail-safe. Unless sellers regain control under $505, the stock leans toward a bullish continuation this week.
Disclaimer: This analysis is for educational purposes only and does not constitute financial advice. Always do your own research and manage risk before trading.
Haftungsausschluss
Die Informationen und Veröffentlichungen sind nicht als Finanz-, Anlage-, Handels- oder andere Arten von Ratschlägen oder Empfehlungen gedacht, die von TradingView bereitgestellt oder gebilligt werden, und stellen diese nicht dar. Lesen Sie mehr in den Nutzungsbedingungen.
Haftungsausschluss
Die Informationen und Veröffentlichungen sind nicht als Finanz-, Anlage-, Handels- oder andere Arten von Ratschlägen oder Empfehlungen gedacht, die von TradingView bereitgestellt oder gebilligt werden, und stellen diese nicht dar. Lesen Sie mehr in den Nutzungsbedingungen.