RSI divergence is a technical analysis tool used to identify potential reversals or weakening momentum in price trends.
Here's how it works:
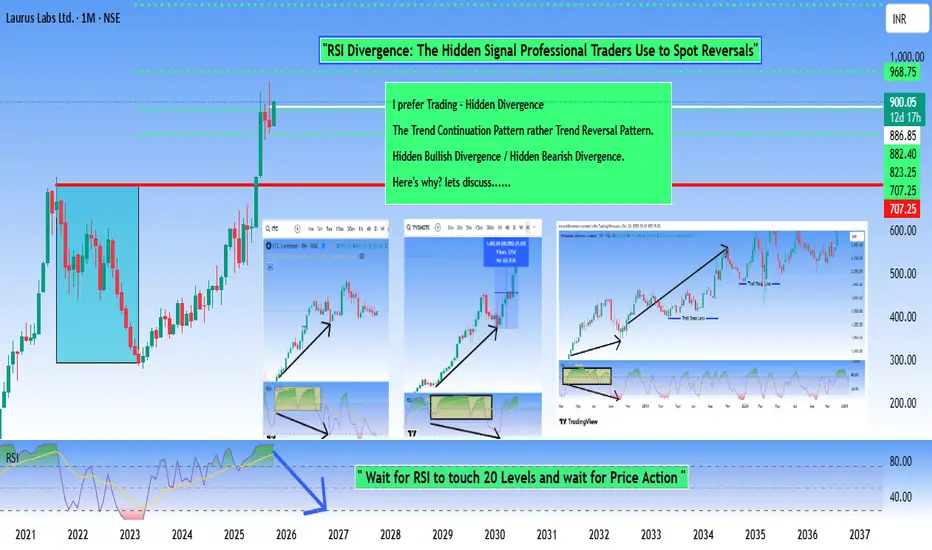
RSI (Relative Strength Index) Divergence occurs when the price of an asset moves in one direction while the RSI indicator moves in the opposite direction.
This disconnect between Price action and Momentum is what traders find significant.
Bullish / Bearish Divergence - This Divergence occurs at the end of a trend, be it Bullish or Bearish Trend.
RSI Hidden Divergence is a more subtle and advanced form of divergence that occurs within trending markets. It's different from regular divergence because it suggests the trend will continue rather than reverse.
Why It's Called "Hidden" ?
Regular divergence is more "obvious" because Price and RSI move in completely opposite directions. Hidden divergence is subtler—It appears within the flow of an existing trend and is easy to miss, hence the name.
Reasons to Prefer Hidden Divergence Rather then Classic Divergence !!!
When we follow Classic Divergence, the possible results are....
False Signals
The biggest issue is that divergences frequently fail to produce reversals. A price may form a lower low while RSI forms a higher low, suggesting a reversal is coming, but the price continues in the original direction anyway. This can lead traders into losing trades if they act on divergence signals prematurely.
Lagging Nature
RSI divergence is a lagging indicator—by the time you spot it clearly, a significant portion of the move may already be complete. You're often trading what's already happened rather than predicting what's about to happen. The reversal might be weeks away, making it difficult for short-term traders.
Subjectivity in Identification
Identifying divergence requires drawing trend lines and choosing which highs and lows to compare. Different traders might draw these lines differently, leading to inconsistent identification of the same divergence. This subjectivity makes it harder to create reliable, mechanical trading rules.
Here's how it works:
RSI (Relative Strength Index) Divergence occurs when the price of an asset moves in one direction while the RSI indicator moves in the opposite direction.
This disconnect between Price action and Momentum is what traders find significant.
Bullish / Bearish Divergence - This Divergence occurs at the end of a trend, be it Bullish or Bearish Trend.
RSI Hidden Divergence is a more subtle and advanced form of divergence that occurs within trending markets. It's different from regular divergence because it suggests the trend will continue rather than reverse.
Why It's Called "Hidden" ?
Regular divergence is more "obvious" because Price and RSI move in completely opposite directions. Hidden divergence is subtler—It appears within the flow of an existing trend and is easy to miss, hence the name.
Reasons to Prefer Hidden Divergence Rather then Classic Divergence !!!
When we follow Classic Divergence, the possible results are....
False Signals
The biggest issue is that divergences frequently fail to produce reversals. A price may form a lower low while RSI forms a higher low, suggesting a reversal is coming, but the price continues in the original direction anyway. This can lead traders into losing trades if they act on divergence signals prematurely.
Lagging Nature
RSI divergence is a lagging indicator—by the time you spot it clearly, a significant portion of the move may already be complete. You're often trading what's already happened rather than predicting what's about to happen. The reversal might be weeks away, making it difficult for short-term traders.
Subjectivity in Identification
Identifying divergence requires drawing trend lines and choosing which highs and lows to compare. Different traders might draw these lines differently, leading to inconsistent identification of the same divergence. This subjectivity makes it harder to create reliable, mechanical trading rules.
Verbundene Veröffentlichungen
Haftungsausschluss
Die Informationen und Veröffentlichungen sind nicht als Finanz-, Anlage-, Handels- oder andere Arten von Ratschlägen oder Empfehlungen gedacht, die von TradingView bereitgestellt oder gebilligt werden, und stellen diese nicht dar. Lesen Sie mehr in den Nutzungsbedingungen.