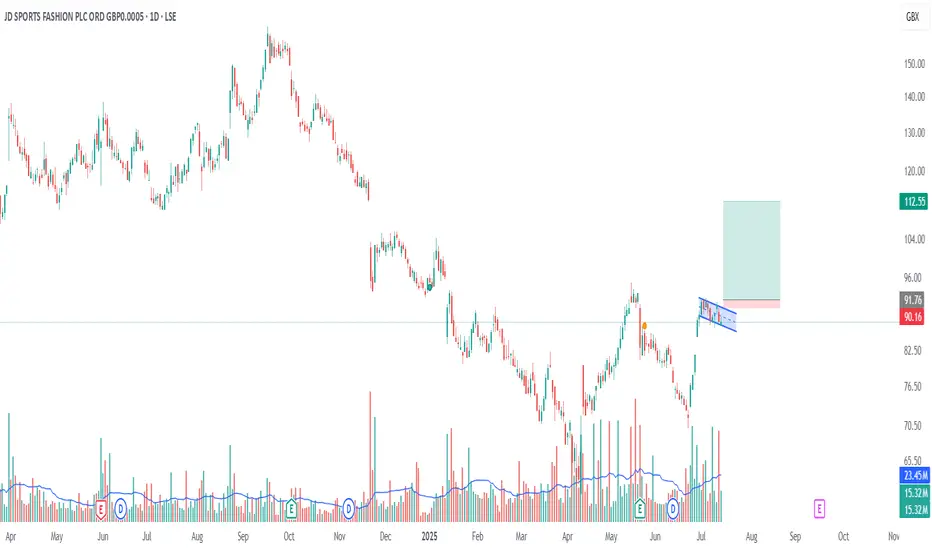
A bull flag pattern is forming on the 1-day chart, supported by a steady increase in volume—suggesting growing bullish momentum.
Flagpole base: ~72
Potential breakout level: ~92
First price target (PT1): ~100 (next key resistance level)
Measured move target (PT2): ~112 (based on flagpole height)
This setup indicates a strong potential for continuation if price breaks above the 92 level with volume confirmation.
Flagpole base: ~72
Potential breakout level: ~92
First price target (PT1): ~100 (next key resistance level)
Measured move target (PT2): ~112 (based on flagpole height)
This setup indicates a strong potential for continuation if price breaks above the 92 level with volume confirmation.
Haftungsausschluss
Die Informationen und Veröffentlichungen sind nicht als Finanz-, Anlage-, Handels- oder andere Arten von Ratschlägen oder Empfehlungen gedacht, die von TradingView bereitgestellt oder gebilligt werden, und stellen diese nicht dar. Lesen Sie mehr in den Nutzungsbedingungen.
Haftungsausschluss
Die Informationen und Veröffentlichungen sind nicht als Finanz-, Anlage-, Handels- oder andere Arten von Ratschlägen oder Empfehlungen gedacht, die von TradingView bereitgestellt oder gebilligt werden, und stellen diese nicht dar. Lesen Sie mehr in den Nutzungsbedingungen.