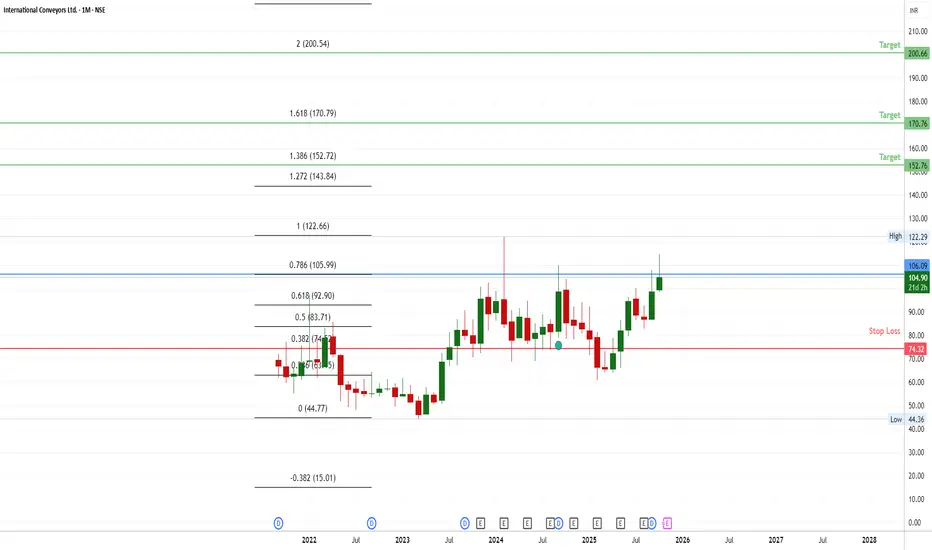
📌 Current Level: 105 (0.786 Fibonacci)
The market is hovering near this critical resistance level. A break above could signal bullish momentum.
📌 Upside Targets: 150 / 170 / 200
If the level of 105 is breached, these are the key retracement levels where price may find resistance next.
📌 Stop Loss: 74 (0.382 Fibonacci)
If the market reverses and falls below this level, it indicates a potential bearish move, making this a safe exit point.
Haftungsausschluss
Die Informationen und Veröffentlichungen sind nicht als Finanz-, Anlage-, Handels- oder andere Arten von Ratschlägen oder Empfehlungen gedacht, die von TradingView bereitgestellt oder gebilligt werden, und stellen diese nicht dar. Lesen Sie mehr in den Nutzungsbedingungen.
Haftungsausschluss
Die Informationen und Veröffentlichungen sind nicht als Finanz-, Anlage-, Handels- oder andere Arten von Ratschlägen oder Empfehlungen gedacht, die von TradingView bereitgestellt oder gebilligt werden, und stellen diese nicht dar. Lesen Sie mehr in den Nutzungsbedingungen.