Every candle on the chart is a footprint of the crowd.
Some are footprints of long-term investors, others of restless scalpers, and in between lie the majority — the current active population.
Most traders look at Bollinger Bands with ±1 SD or ±2 SD. But here’s the catch:
±1 SD (68% zone) is too wide, it includes noise that the current crowd may not actually be trading.
±2 SD (95% zone) often shows overreactions — moments that only a small, emotional part of the market touches.
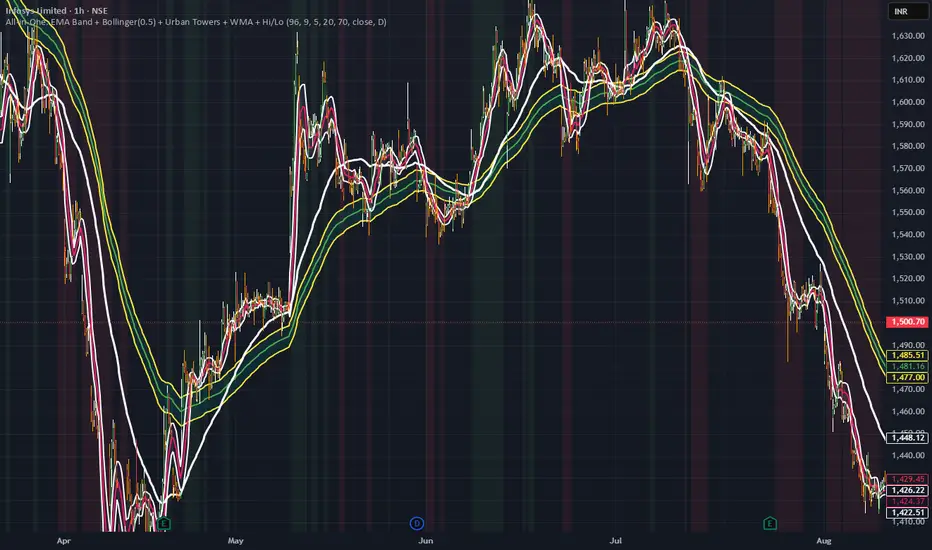
🔹 This is why 0.5 SD is powerful.
It captures the true heartbeat of the current population — the majority of trades happening right now.
Instead of focusing on the extremes, it filters the chatter and shows us where the real action is.
Importance of 96WMA:
Above it, the active crowd is leaning bullish, even if short-term noise distracts.
Below it, the weight shifts bearish.
Together, 0.5 SD + 96WMA forms a map — the pulse of the market (0.5 SD) laid against the backbone of trend (96WMA).
The market is not moved by everyone at once, but by the dominant population of the moment.
By tracking SD = 0.5, we see that population more clearly than any other band width.
Combine it with the quiet guide of 96WMA, and we stop guessing the crowd’s mood — we start seeing it.
Some are footprints of long-term investors, others of restless scalpers, and in between lie the majority — the current active population.
Most traders look at Bollinger Bands with ±1 SD or ±2 SD. But here’s the catch:
±1 SD (68% zone) is too wide, it includes noise that the current crowd may not actually be trading.
±2 SD (95% zone) often shows overreactions — moments that only a small, emotional part of the market touches.
🔹 This is why 0.5 SD is powerful.
It captures the true heartbeat of the current population — the majority of trades happening right now.
Instead of focusing on the extremes, it filters the chatter and shows us where the real action is.
Importance of 96WMA:
Above it, the active crowd is leaning bullish, even if short-term noise distracts.
Below it, the weight shifts bearish.
Together, 0.5 SD + 96WMA forms a map — the pulse of the market (0.5 SD) laid against the backbone of trend (96WMA).
The market is not moved by everyone at once, but by the dominant population of the moment.
By tracking SD = 0.5, we see that population more clearly than any other band width.
Combine it with the quiet guide of 96WMA, and we stop guessing the crowd’s mood — we start seeing it.
Haftungsausschluss
Die Informationen und Veröffentlichungen sind nicht als Finanz-, Anlage-, Handels- oder andere Arten von Ratschlägen oder Empfehlungen gedacht, die von TradingView bereitgestellt oder gebilligt werden, und stellen diese nicht dar. Lesen Sie mehr in den Nutzungsbedingungen.
Haftungsausschluss
Die Informationen und Veröffentlichungen sind nicht als Finanz-, Anlage-, Handels- oder andere Arten von Ratschlägen oder Empfehlungen gedacht, die von TradingView bereitgestellt oder gebilligt werden, und stellen diese nicht dar. Lesen Sie mehr in den Nutzungsbedingungen.