This is a chart that I sent to my members today.
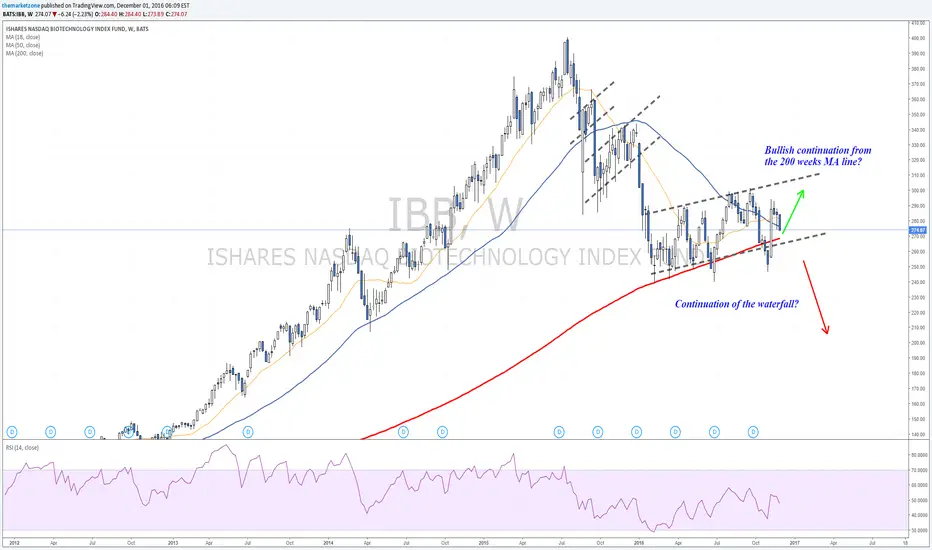
It presents two potential trades on IBB:
1. Bullish (short term) setup - 270$ is the key zone as it presents a weekly support zone.
2. Bearish continuation (based on longer term analysis) - Continuation of the the waterfall that started on May 2015.
Waiting to here your thoughts.
It presents two potential trades on IBB:
1. Bullish (short term) setup - 270$ is the key zone as it presents a weekly support zone.
2. Bearish continuation (based on longer term analysis) - Continuation of the the waterfall that started on May 2015.
Waiting to here your thoughts.
Anmerkung
Despite Trump's comments, IBB holds the bottom of the channel. 270$ is nearest support.
Haftungsausschluss
Die Informationen und Veröffentlichungen sind nicht als Finanz-, Anlage-, Handels- oder andere Arten von Ratschlägen oder Empfehlungen gedacht, die von TradingView bereitgestellt oder gebilligt werden, und stellen diese nicht dar. Lesen Sie mehr in den Nutzungsbedingungen.
Haftungsausschluss
Die Informationen und Veröffentlichungen sind nicht als Finanz-, Anlage-, Handels- oder andere Arten von Ratschlägen oder Empfehlungen gedacht, die von TradingView bereitgestellt oder gebilligt werden, und stellen diese nicht dar. Lesen Sie mehr in den Nutzungsbedingungen.