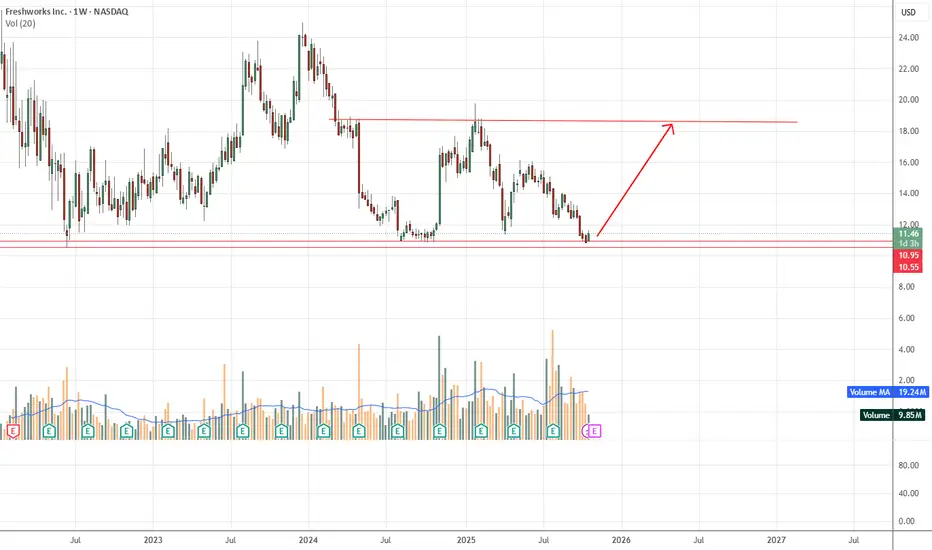
The stock is currently trading around $11.44, near its recent support zone at roughly $10.55–$10.95.
The chart shows a downtrend from previous highs, but price is testing a historically strong support level.
Resistance: Around $18 (where the upward arrow points), representing prior swing highs.
Bullish setup at current levels with clear risk/reward: low risk near support, high reward toward prior resistance.
Traders may look for confirmation (bullish candlestick, volume increase) before entering.
Trade ist aktiv
Haftungsausschluss
Die Informationen und Veröffentlichungen sind nicht als Finanz-, Anlage-, Handels- oder andere Arten von Ratschlägen oder Empfehlungen gedacht, die von TradingView bereitgestellt oder gebilligt werden, und stellen diese nicht dar. Lesen Sie mehr in den Nutzungsbedingungen.
Haftungsausschluss
Die Informationen und Veröffentlichungen sind nicht als Finanz-, Anlage-, Handels- oder andere Arten von Ratschlägen oder Empfehlungen gedacht, die von TradingView bereitgestellt oder gebilligt werden, und stellen diese nicht dar. Lesen Sie mehr in den Nutzungsbedingungen.