The chart is in a downtrend sitting on big support, and we have sketched the two obvious branching paths.
Where we are now
⸻
Bull case – double bottom
The green double bottom is basically
For this to be “real” we want:
If that happens, measured move targets land somewhere in the mid-4ks, which lines up with your big green arrow.
Subjective odds right now: lower, maybe ~40% until that neckline breaks. We're trying to fight the prevailing downtrend; the pattern is only a potential bottom.
⸻
Bear case – inverse cup / rounded top
The red “inverse cup and handle” is basically a big rounded top since August
Bearish resolution would be
Given the existing downtrend and overhead MA gravity, continuation has the edge for now—call it ~60% vs the bullish reversal, unless the neckline is reclaimed.
⸻
Net take
So the market is basically asking: “Do we defend the 3k fortress, or do the MAs slowly grind everyone down?” The chart slightly favors the bears until price proves otherwise.
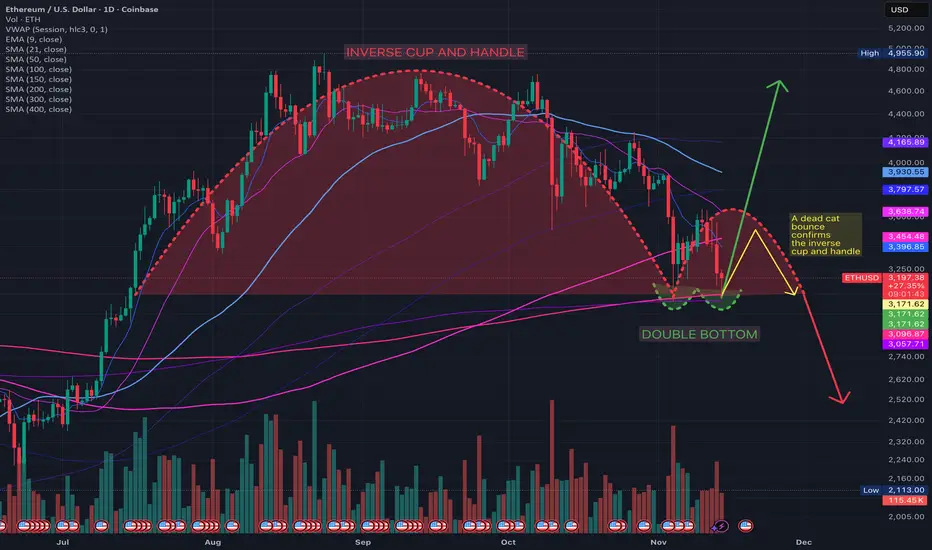
Where we are now
- Price ~3.2k, below the 9/21/50/100/150/200-day MAs but sitting on the 300–400-day cluster around 3.05–3.10k.
- That zone also matches the previous summer range = strong structural support.
- Trend is still clearly down until at least the 200-day (~3.45k) is reclaimed.
⸻
Bull case – double bottom
The green double bottom is basically
- Lows: ~3.05k–3.10k (twice).
- Neckline: the swing high between them, roughly ~3.5–3.6k.
For this to be “real” we want:
- decisive daily close above ~3.5–3.6k with volume.
- Ideally 200-day MA reclaimed and flattening.
If that happens, measured move targets land somewhere in the mid-4ks, which lines up with your big green arrow.
Subjective odds right now: lower, maybe ~40% until that neckline breaks. We're trying to fight the prevailing downtrend; the pattern is only a potential bottom.
⸻
Bear case – inverse cup / rounded top
The red “inverse cup and handle” is basically a big rounded top since August
- Series of lower highs, price rejected by falling MAs.
- Current bounce is so far just a retest of that declining structure / MA cluster from below.
Bearish resolution would be
- Failure somewhere under ~3.5k.
- Breakdown below 3.0–3.05k (loss of 300–400-day MAs and range support).
- That opens a move to the mid-2ks or worse, which is your red arrow scenario.
Given the existing downtrend and overhead MA gravity, continuation has the edge for now—call it ~60% vs the bullish reversal, unless the neckline is reclaimed.
⸻
Net take
- Above ~3.6k with volume → double bottom validated, trend potentially flips up.
- Below ~3.0k with conviction → rounded-top breakdown, expect acceleration down.
- In between 3.0–3.6k you’re in Schrödinger’s pattern: chop, fakeouts, and pain.
So the market is basically asking: “Do we defend the 3k fortress, or do the MAs slowly grind everyone down?” The chart slightly favors the bears until price proves otherwise.
Haftungsausschluss
Die Informationen und Veröffentlichungen sind nicht als Finanz-, Anlage-, Handels- oder andere Arten von Ratschlägen oder Empfehlungen gedacht, die von TradingView bereitgestellt oder gebilligt werden, und stellen diese nicht dar. Lesen Sie mehr in den Nutzungsbedingungen.
Haftungsausschluss
Die Informationen und Veröffentlichungen sind nicht als Finanz-, Anlage-, Handels- oder andere Arten von Ratschlägen oder Empfehlungen gedacht, die von TradingView bereitgestellt oder gebilligt werden, und stellen diese nicht dar. Lesen Sie mehr in den Nutzungsbedingungen.