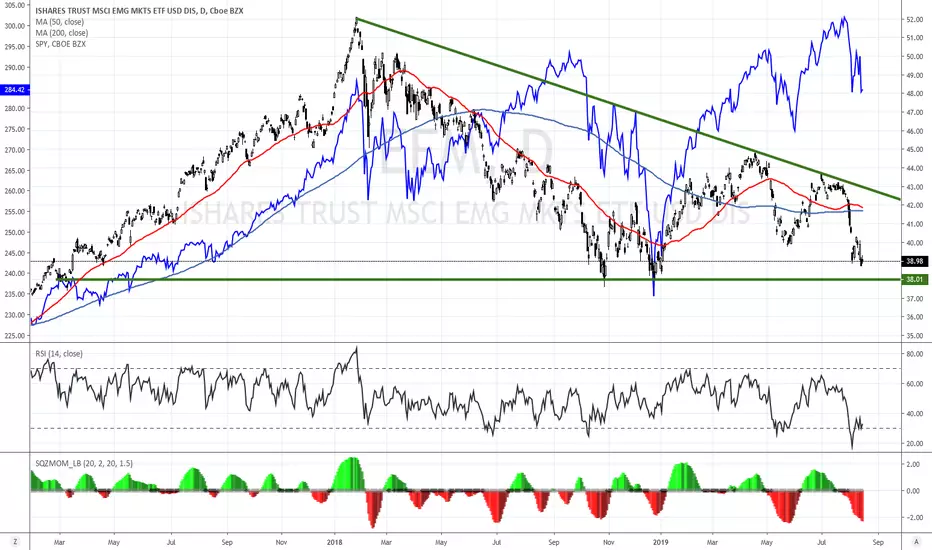
We can clearly see the Descending Triangle in the MSCI Emerging Markets ETF ETF (EEM) share price movement that developed over the past 2 years which could be very positive for EEM, should we see a break and close above the resistance level at $42.70. A break a close above these levels could see the price seeking resistance at around $43.50. My medium term target is $44.80. Main resentence levels over short-term are the 200-day ($41.69) & 50-day (41.87$) moving averages.
The share price currently finds itself in extreme oversold according to its 14-day RSI . It has also massively underperformed the S&P500 over the past 2 years.
For short-term traders, I would recommend a stop-loss at $38.
The share price currently finds itself in extreme oversold according to its 14-day RSI . It has also massively underperformed the S&P500 over the past 2 years.
For short-term traders, I would recommend a stop-loss at $38.
Haftungsausschluss
Die Informationen und Veröffentlichungen sind nicht als Finanz-, Anlage-, Handels- oder andere Arten von Ratschlägen oder Empfehlungen gedacht, die von TradingView bereitgestellt oder gebilligt werden, und stellen diese nicht dar. Lesen Sie mehr in den Nutzungsbedingungen.
Haftungsausschluss
Die Informationen und Veröffentlichungen sind nicht als Finanz-, Anlage-, Handels- oder andere Arten von Ratschlägen oder Empfehlungen gedacht, die von TradingView bereitgestellt oder gebilligt werden, und stellen diese nicht dar. Lesen Sie mehr in den Nutzungsbedingungen.