I’ve been tracking 
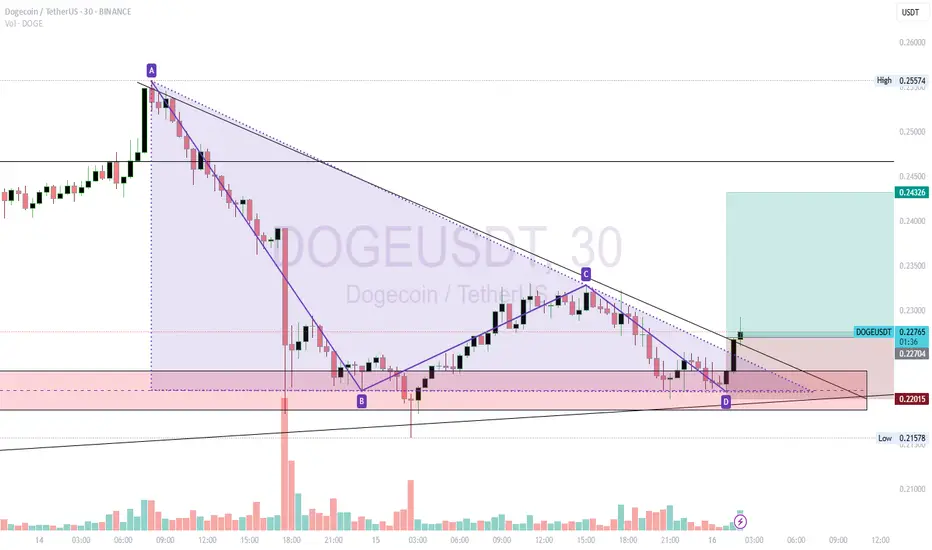
 DOGEUSDT on the 30m chart using an ABCD point layout to outline a descending triangle pattern.
A → C → D: Lower highs consistently respecting the downtrend line.
B & D zone (~0.2200): Flat base support forming the triangle floor.
Price has now broken above the descending trendline with a noticeable spike in volume, indicating that buyers stepped in aggressively to break the pattern.
Why This Matters:
Volume was relatively muted during the consolidation phase inside the triangle, which is normal for this type of setup. However, at the breakout candle, volume surged — confirming that the move was not just a false breakout but backed by real market participation.
Trade Plan:
Entry Zone: Above 0.2270 (confirmed breakout)
First Target: 0.2300
Second Target: 0.2430 (measured move from triangle height)
Stop Loss: Below 0.2200 (pattern invalidation)
Notes:
While descending triangles often break downward, this setup shows bullish divergence between price action and volume — suggesting that the market may be preparing for a sustained upside move.
Haftungsausschluss
Die Informationen und Veröffentlichungen sind nicht als Finanz-, Anlage-, Handels- oder andere Arten von Ratschlägen oder Empfehlungen gedacht, die von TradingView bereitgestellt oder gebilligt werden, und stellen diese nicht dar. Lesen Sie mehr in den Nutzungsbedingungen.
Haftungsausschluss
Die Informationen und Veröffentlichungen sind nicht als Finanz-, Anlage-, Handels- oder andere Arten von Ratschlägen oder Empfehlungen gedacht, die von TradingView bereitgestellt oder gebilligt werden, und stellen diese nicht dar. Lesen Sie mehr in den Nutzungsbedingungen.