Timeframe: Daily Chart | Analysis Type: Pure Price Action
🎯 Idea Summary
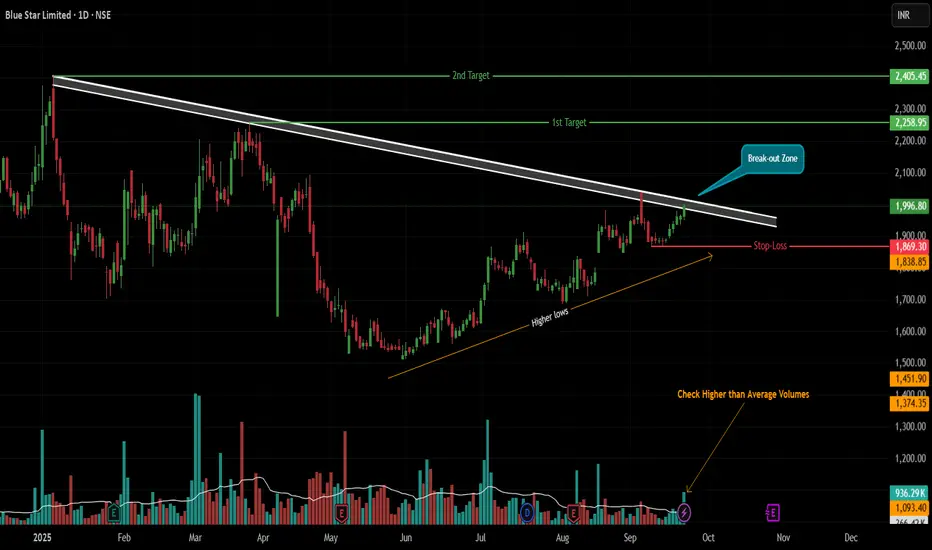
BLUESTAR is showcasing a textbook-perfect technical setup! A multi-month Descending Trendline resistance is converging with a bullish series of Higher Lows, forming a tight Volume Contraction Pattern (VCP). The stock is now squeezing at the apex, suggesting a powerful explosive move is on the horizon. A confirmed breakout could signal the start of a major bullish wave!
📊 Technical Rationale (Pure Price Action)
⚡ Major Descending Trendline (Resistance):
This key trendline originates from the swing high on 6th January 2025 📅.
It has been tested and respected as strong resistance on 25th March, 4th September, and 22nd September 2025. Each touch confirms the selling pressure. A breakout signifies a major trend reversal.
💪 Bullish Higher Lows & VCP (Strength):
Since 2nd June 2025, the stock has crafted a beautiful series of Higher Lows (HL) ↗️.
This shows buyers are aggressively defending higher levels, building a solid base for the next leg up. The contraction in price swings forms a Volume Contraction Pattern (VCP), indicating energy compression before a big expansion.
🧨 The Convergence (The Trigger):
Price is now knocking at the trendline resistance again. The coiling action is ultra-tight, suggesting a high-potential breakout is imminent!
⚖️ Trade Strategy
✅ Trigger for Entry: A BUY is triggered ONLY on a strong daily candle CLOSE ABOVE the descending trendline.
🔍 Confirmation Criteria (CRITICAL):
1) Volume: The breakout must be on VERY HIGH volume 📈. This is non-negotiable to confirm real buying interest and avoid fakeouts.
2) Candle Strength: The perfect signal is a thick, green Marubozu candle 🟢 (strong buying from open to close).
🛡️ Stop Loss (SL):
Aggressive: Low of the breakout candle.
Positional/Conservative: 1869 (The anchor of the HL structure).
🎯 Price Targets:
Target 1: 2258
Target 2: 2405
📌 Management: After T1, trail your stop loss to lock in profits on the way to T2.
⚠️ Key Considerations
⏳ Patience is a Virtue: Wait for the daily candle to CLOSE above the trendline. No premature entries!
🚫 False Breakout Risk: A weak close or low volume is a red flag. Stick to the rules.
✨ Pure Price Action: No lagging indicators. Just clean supply/demand analysis.
Disclaimer: This is an educational idea and not financial advice. Trading carries risk. Always do your own research and manage risk appropriately.
✨ Let me know if you spot the setup! Good luck and trade safe! ✨
🎯 Idea Summary
BLUESTAR is showcasing a textbook-perfect technical setup! A multi-month Descending Trendline resistance is converging with a bullish series of Higher Lows, forming a tight Volume Contraction Pattern (VCP). The stock is now squeezing at the apex, suggesting a powerful explosive move is on the horizon. A confirmed breakout could signal the start of a major bullish wave!
📊 Technical Rationale (Pure Price Action)
⚡ Major Descending Trendline (Resistance):
This key trendline originates from the swing high on 6th January 2025 📅.
It has been tested and respected as strong resistance on 25th March, 4th September, and 22nd September 2025. Each touch confirms the selling pressure. A breakout signifies a major trend reversal.
💪 Bullish Higher Lows & VCP (Strength):
Since 2nd June 2025, the stock has crafted a beautiful series of Higher Lows (HL) ↗️.
This shows buyers are aggressively defending higher levels, building a solid base for the next leg up. The contraction in price swings forms a Volume Contraction Pattern (VCP), indicating energy compression before a big expansion.
🧨 The Convergence (The Trigger):
Price is now knocking at the trendline resistance again. The coiling action is ultra-tight, suggesting a high-potential breakout is imminent!
⚖️ Trade Strategy
✅ Trigger for Entry: A BUY is triggered ONLY on a strong daily candle CLOSE ABOVE the descending trendline.
🔍 Confirmation Criteria (CRITICAL):
1) Volume: The breakout must be on VERY HIGH volume 📈. This is non-negotiable to confirm real buying interest and avoid fakeouts.
2) Candle Strength: The perfect signal is a thick, green Marubozu candle 🟢 (strong buying from open to close).
🛡️ Stop Loss (SL):
Aggressive: Low of the breakout candle.
Positional/Conservative: 1869 (The anchor of the HL structure).
🎯 Price Targets:
Target 1: 2258
Target 2: 2405
📌 Management: After T1, trail your stop loss to lock in profits on the way to T2.
⚠️ Key Considerations
⏳ Patience is a Virtue: Wait for the daily candle to CLOSE above the trendline. No premature entries!
🚫 False Breakout Risk: A weak close or low volume is a red flag. Stick to the rules.
✨ Pure Price Action: No lagging indicators. Just clean supply/demand analysis.
Disclaimer: This is an educational idea and not financial advice. Trading carries risk. Always do your own research and manage risk appropriately.
✨ Let me know if you spot the setup! Good luck and trade safe! ✨
Haftungsausschluss
Die Informationen und Veröffentlichungen sind nicht als Finanz-, Anlage-, Handels- oder andere Arten von Ratschlägen oder Empfehlungen gedacht, die von TradingView bereitgestellt oder gebilligt werden, und stellen diese nicht dar. Lesen Sie mehr in den Nutzungsbedingungen.
Haftungsausschluss
Die Informationen und Veröffentlichungen sind nicht als Finanz-, Anlage-, Handels- oder andere Arten von Ratschlägen oder Empfehlungen gedacht, die von TradingView bereitgestellt oder gebilligt werden, und stellen diese nicht dar. Lesen Sie mehr in den Nutzungsbedingungen.