Simetric Triangle in BlackRock
Timeframe: 1 hour
Indicators: 200 MA
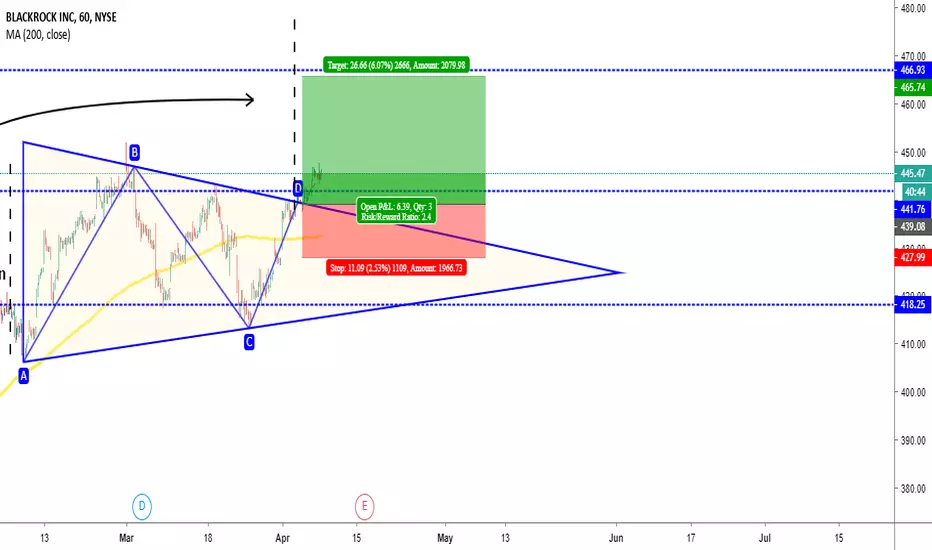
We can see a Simetric Triangle in the BlackRock (BLK), it has already broke the pattern so there is a possible buy position for the stock.
We can set a entry price at $439, with a Take Profit in $465 and a Stop Loss in $427 just below the 200 Moving Average
Timeframe: 1 hour
Indicators: 200 MA
We can see a Simetric Triangle in the BlackRock (BLK), it has already broke the pattern so there is a possible buy position for the stock.
We can set a entry price at $439, with a Take Profit in $465 and a Stop Loss in $427 just below the 200 Moving Average
Haftungsausschluss
Die Informationen und Veröffentlichungen sind nicht als Finanz-, Anlage-, Handels- oder andere Arten von Ratschlägen oder Empfehlungen gedacht, die von TradingView bereitgestellt oder gebilligt werden, und stellen diese nicht dar. Lesen Sie mehr in den Nutzungsbedingungen.
Haftungsausschluss
Die Informationen und Veröffentlichungen sind nicht als Finanz-, Anlage-, Handels- oder andere Arten von Ratschlägen oder Empfehlungen gedacht, die von TradingView bereitgestellt oder gebilligt werden, und stellen diese nicht dar. Lesen Sie mehr in den Nutzungsbedingungen.