Bank Nifty Trading Plan – 11-Nov-2024
Intro:
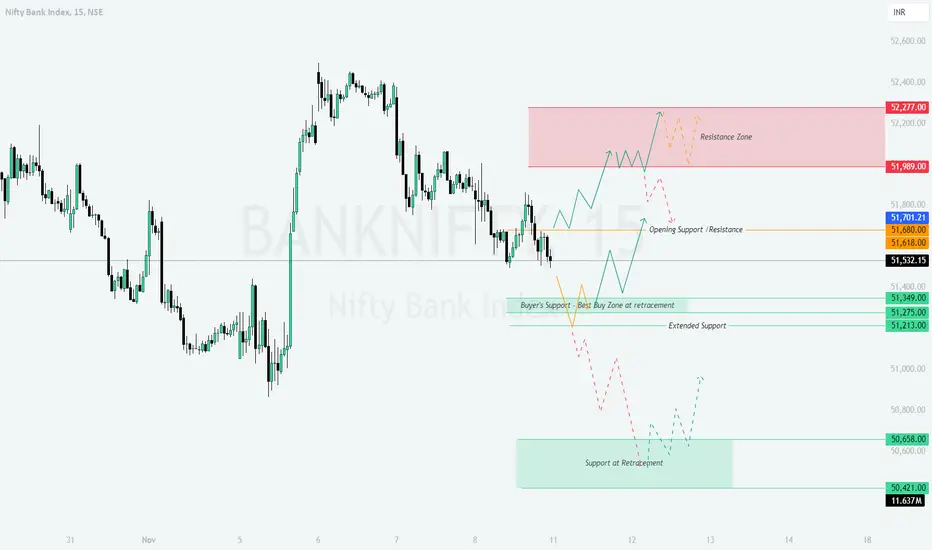
On the previous trading day, Bank Nifty exhibited distinct zones for resistance, support, and retracement areas, giving us a clear range to work with. The yellow trend lines represent periods of sideways movement, green indicates a bullish trend, and red represents a bearish trend. Key resistance is observed around 52,277, while support is at 51,275. Here’s a detailed plan based on possible opening scenarios.
---
Trading Plan for All Opening Scenarios:
- Gap Up Opening (200+ Points):
- If Bank Nifty opens with a gap up above the Resistance Zone at 51,989, monitor if it sustains above this level in the first 15-30 minutes.
- Bullish Scenario: A sustained move above 51,989 can lead to a bullish trend toward the higher Resistance Zone at 52,277. Look for buying opportunities on pullbacks toward 51,989 for a potential upside move.
- Bearish Scenario: If it fails to hold above 51,989 and reverses, expect a retracement toward the Opening Support/Resistance at 51,680. Consider short entries below 51,989 with a target toward 51,680 if bearish momentum persists.
- Flat Opening:
- If Bank Nifty opens flat around 51,532, wait for the price to stabilize for the first 15-30 minutes before taking any positions.
- Bullish Scenario: A move above 51,680 can trigger a bullish trend with targets toward 51,989. Look for buying entries around 51,680 with support from price action.
- Bearish Scenario: If Bank Nifty breaks below 51,349, expect bearish pressure with targets around the Extended Support at 51,213. Short entries could be considered below 51,349 if bearish signals confirm.
- Gap Down Opening (200+ Points):
- A gap down opening below 51,349 could lead to early volatility. Watch if it stabilizes around the Buyer’s Support zone at 51,275.
- Bullish Scenario: If Bank Nifty holds above 51,275 and shows a reversal, consider going long with targets toward the Opening Support at 51,532.
- Bearish Scenario: If selling pressure continues and Bank Nifty breaks below 51,275, expect a move toward the lower Support at Retracement near 50,658. Look for short opportunities below 51,275 with a strict stop loss above 51,275.
---
Risk Management Tips for Options Trading:
- Use hedged positions like vertical spreads to manage risk effectively.
- Maintain a stop-loss level based on daily close to avoid getting stopped out due to intraday volatility.
- Limit position sizes based on your risk tolerance; do not over-leverage.
- Avoid chasing targets; exit around target zones to lock in profits.
---
Summary and Conclusion:
The market structure offers key levels to watch for both support and resistance. Sustaining above 51,989 could signal a bullish move, while a breakdown below 51,275 could lead to further downside. Exercise patience, wait for confirmation around these levels, and manage risk prudently.
---
Disclaimer:
I am not a SEBI-registered analyst. This plan is for educational purposes only. Please perform your analysis or consult a financial advisor before making any trading decisions.
Haftungsausschluss
Die Informationen und Veröffentlichungen sind nicht als Finanz-, Anlage-, Handels- oder andere Arten von Ratschlägen oder Empfehlungen gedacht, die von TradingView bereitgestellt oder gebilligt werden, und stellen diese nicht dar. Lesen Sie mehr in den Nutzungsbedingungen.
Haftungsausschluss
Die Informationen und Veröffentlichungen sind nicht als Finanz-, Anlage-, Handels- oder andere Arten von Ratschlägen oder Empfehlungen gedacht, die von TradingView bereitgestellt oder gebilligt werden, und stellen diese nicht dar. Lesen Sie mehr in den Nutzungsbedingungen.