Watching for a $373 Breakout 🚀
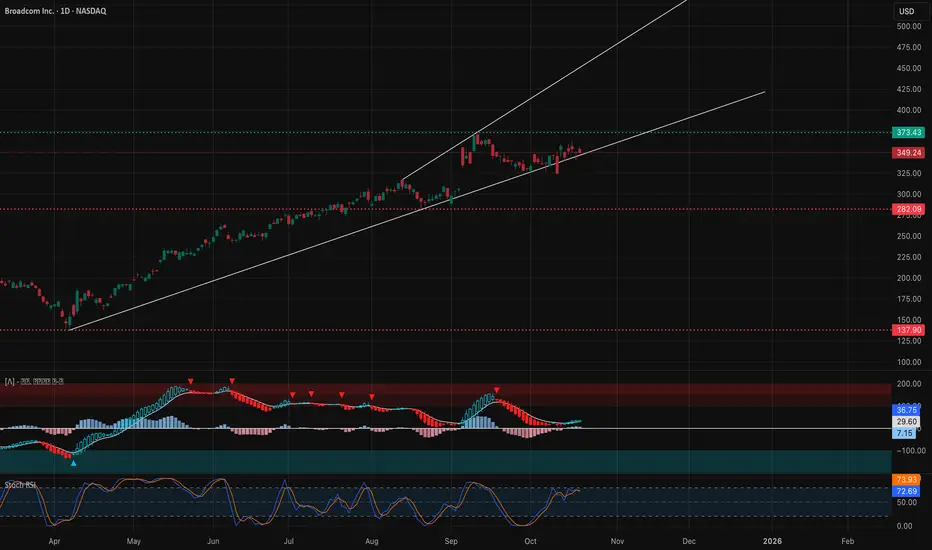
📆 Daily Chart — Macro Structure and Trend Bias
Market Structure: Broadcom (AVGO) continues to respect its long-term ascending channel, maintaining higher lows since April. Despite recent consolidation, price remains above the channel midline, signaling that the broader trend is still bullish. The recent CHoCH near $345 shows a minor structural shift within this uptrend — a potential retest before continuation.
Buyers have been defending the $340–$345 zone, which aligns with the ascending channel support and prior breakout structure from June. As long as this area holds, the structure suggests accumulation rather than reversal.
Supply & Demand / Order Blocks:
* Demand Zone: $340–$345 (key structure retest + OB confluence).
* Supply Zone: $372–$375 (major resistance from last BOS).
* Deeper Demand (macro): $282–$290 (channel base + 0.382 retracement).
Indicator Confluence:
* 9 EMA & 21 EMA: Flattening slightly but still stacked bullishly; compression phase before next move.
* MACD: Bullish histogram momentum reappearing after fading; crossover possible if bulls reclaim $355+.
* Stoch RSI: Hovering near 70 — bullish continuation potential with no overbought extremes.
* Volume: Accumulation rising near channel support, confirming institutional defense.
If price reclaims $355–$360 with momentum, daily structure resumes higher toward $373–$380 channel top.
⏱️ 1-Hour Chart — Short-Term Structure and Swing Zones

Market Structure: The 1-hour chart shows AVGO consolidating after rejecting $356, forming a descending wedge pattern — a bullish continuation setup within the broader channel. The CHoCH at $340 and subsequent BOS at $350 suggest an early reversal base forming.
Bulls need to sustain above $348–$350 to keep short-term momentum alive. A breakout through $356.50–$358.00 could trigger an impulsive move to $363–$372.
Supply & Demand / OB Levels:
* Demand Zone: $340.80–$345.00 (retest area for long setups).
* Supply Zone: $356–$363 (upper wedge + prior liquidity cluster).
Indicator Confluence:
* 9 EMA > 21 EMA after flattening — short-term bullish crossover in progress.
* MACD: Histogram turning positive; signal crossover likely on next push.
* Stoch RSI: Rising from oversold (20–40), confirming fresh bullish momentum.
* Volume: Uptick during intraday pushes; fade on pullbacks — healthy bullish structure.
Trade Scenarios:
* Bullish Setup: Entry $348–$350 → Target $363 / $372 → Stop below $340.
* Bearish Setup: If rejection from $356–$358 → Target $345 / $341 → Stop $360.
A clean breakout above $358 confirms a bullish reversal from wedge compression — potentially setting up for a $373 channel retest.
🕒 15-Minute Chart — Intraday Momentum and Scalping Bias

Market Structure: AVGO’s 15-min structure shows a tight accumulation range between $348–$356. Buyers defended the lower bound multiple times, confirming intraday liquidity building beneath support. A recent BOS and higher low near $348.5 mark a transition from distribution to re-accumulation.
Supply & Demand / OB Levels:
* Demand Zone: $347.80–$349.50 (intraday OB base).
* Supply Zone: $356.00–$358.00 (scalp resistance & liquidity trap zone).
Indicator Confluence:
* 9 EMA vs 21 EMA: Just starting to curl upward — potential re-entry signal for bulls.
* MACD: Momentum improving; early bullish divergence forming against prior lows.
* Stoch RSI: Rising from 20 to 80 — intraday reversal confirmation.
Scalp Plan:
* Bullish Bias: Long near $349–$350 → Target $355.50 / $358.00 → Stop $347.50.
* Bearish Bias: Short rejection from $358 → Target $349 → Stop $359.
Intraday trend neutral-bullish; price reclaiming $355 would trigger renewed buying momentum toward $360+.
📊 GEX (Gamma Exposure) & Options Sentiment Overview

AVGO’s options landscape supports range-bound stability with potential for a gamma breakout above $370. Dealer positioning remains balanced around $350, suggesting magnet behavior until a strong directional move develops.
Key GEX Levels:
* Highest Positive GEX / Call Wall: $372 (strong resistance + dealer hedging zone).
* Second Call Wall: $365–$368.
* Major Put Support: $340 and $320 (solid floor for mean reversion).
* IVR: 24.1 — low volatility, room for expansion.
* Call Flow: 19.5% — relatively light but could rise sharply on breakout.
Dealer hedging pressure remains neutral below $360, but if AVGO breaks above $365–$372, expect momentum acceleration as short gamma triggers. Below $340, dealers likely provide support via mean reversion hedging.
🎯 Closing Outlook
AVGO remains structurally bullish within its macro uptrend but temporarily compressed between $340–$356. The daily channel remains intact, and short-term indicators show early signs of accumulation.
My focus is on a break and hold above $356–$358, which could kickstart a gamma-driven leg toward $373–$375. If bulls fail to defend $340, expect a controlled pullback to $325–$330 before re-entry into the broader channel.
Disclaimer: This analysis is for educational purposes only and not financial advice. Always do your own research and manage your risk.
📆 Daily Chart — Macro Structure and Trend Bias
Market Structure: Broadcom (AVGO) continues to respect its long-term ascending channel, maintaining higher lows since April. Despite recent consolidation, price remains above the channel midline, signaling that the broader trend is still bullish. The recent CHoCH near $345 shows a minor structural shift within this uptrend — a potential retest before continuation.
Buyers have been defending the $340–$345 zone, which aligns with the ascending channel support and prior breakout structure from June. As long as this area holds, the structure suggests accumulation rather than reversal.
Supply & Demand / Order Blocks:
* Demand Zone: $340–$345 (key structure retest + OB confluence).
* Supply Zone: $372–$375 (major resistance from last BOS).
* Deeper Demand (macro): $282–$290 (channel base + 0.382 retracement).
Indicator Confluence:
* 9 EMA & 21 EMA: Flattening slightly but still stacked bullishly; compression phase before next move.
* MACD: Bullish histogram momentum reappearing after fading; crossover possible if bulls reclaim $355+.
* Stoch RSI: Hovering near 70 — bullish continuation potential with no overbought extremes.
* Volume: Accumulation rising near channel support, confirming institutional defense.
If price reclaims $355–$360 with momentum, daily structure resumes higher toward $373–$380 channel top.
⏱️ 1-Hour Chart — Short-Term Structure and Swing Zones
Market Structure: The 1-hour chart shows AVGO consolidating after rejecting $356, forming a descending wedge pattern — a bullish continuation setup within the broader channel. The CHoCH at $340 and subsequent BOS at $350 suggest an early reversal base forming.
Bulls need to sustain above $348–$350 to keep short-term momentum alive. A breakout through $356.50–$358.00 could trigger an impulsive move to $363–$372.
Supply & Demand / OB Levels:
* Demand Zone: $340.80–$345.00 (retest area for long setups).
* Supply Zone: $356–$363 (upper wedge + prior liquidity cluster).
Indicator Confluence:
* 9 EMA > 21 EMA after flattening — short-term bullish crossover in progress.
* MACD: Histogram turning positive; signal crossover likely on next push.
* Stoch RSI: Rising from oversold (20–40), confirming fresh bullish momentum.
* Volume: Uptick during intraday pushes; fade on pullbacks — healthy bullish structure.
Trade Scenarios:
* Bullish Setup: Entry $348–$350 → Target $363 / $372 → Stop below $340.
* Bearish Setup: If rejection from $356–$358 → Target $345 / $341 → Stop $360.
A clean breakout above $358 confirms a bullish reversal from wedge compression — potentially setting up for a $373 channel retest.
🕒 15-Minute Chart — Intraday Momentum and Scalping Bias
Market Structure: AVGO’s 15-min structure shows a tight accumulation range between $348–$356. Buyers defended the lower bound multiple times, confirming intraday liquidity building beneath support. A recent BOS and higher low near $348.5 mark a transition from distribution to re-accumulation.
Supply & Demand / OB Levels:
* Demand Zone: $347.80–$349.50 (intraday OB base).
* Supply Zone: $356.00–$358.00 (scalp resistance & liquidity trap zone).
Indicator Confluence:
* 9 EMA vs 21 EMA: Just starting to curl upward — potential re-entry signal for bulls.
* MACD: Momentum improving; early bullish divergence forming against prior lows.
* Stoch RSI: Rising from 20 to 80 — intraday reversal confirmation.
Scalp Plan:
* Bullish Bias: Long near $349–$350 → Target $355.50 / $358.00 → Stop $347.50.
* Bearish Bias: Short rejection from $358 → Target $349 → Stop $359.
Intraday trend neutral-bullish; price reclaiming $355 would trigger renewed buying momentum toward $360+.
📊 GEX (Gamma Exposure) & Options Sentiment Overview
AVGO’s options landscape supports range-bound stability with potential for a gamma breakout above $370. Dealer positioning remains balanced around $350, suggesting magnet behavior until a strong directional move develops.
Key GEX Levels:
* Highest Positive GEX / Call Wall: $372 (strong resistance + dealer hedging zone).
* Second Call Wall: $365–$368.
* Major Put Support: $340 and $320 (solid floor for mean reversion).
* IVR: 24.1 — low volatility, room for expansion.
* Call Flow: 19.5% — relatively light but could rise sharply on breakout.
Dealer hedging pressure remains neutral below $360, but if AVGO breaks above $365–$372, expect momentum acceleration as short gamma triggers. Below $340, dealers likely provide support via mean reversion hedging.
🎯 Closing Outlook
AVGO remains structurally bullish within its macro uptrend but temporarily compressed between $340–$356. The daily channel remains intact, and short-term indicators show early signs of accumulation.
My focus is on a break and hold above $356–$358, which could kickstart a gamma-driven leg toward $373–$375. If bulls fail to defend $340, expect a controlled pullback to $325–$330 before re-entry into the broader channel.
Disclaimer: This analysis is for educational purposes only and not financial advice. Always do your own research and manage your risk.
Haftungsausschluss
Die Informationen und Veröffentlichungen sind nicht als Finanz-, Anlage-, Handels- oder andere Arten von Ratschlägen oder Empfehlungen gedacht, die von TradingView bereitgestellt oder gebilligt werden, und stellen diese nicht dar. Lesen Sie mehr in den Nutzungsbedingungen.
Haftungsausschluss
Die Informationen und Veröffentlichungen sind nicht als Finanz-, Anlage-, Handels- oder andere Arten von Ratschlägen oder Empfehlungen gedacht, die von TradingView bereitgestellt oder gebilligt werden, und stellen diese nicht dar. Lesen Sie mehr in den Nutzungsbedingungen.