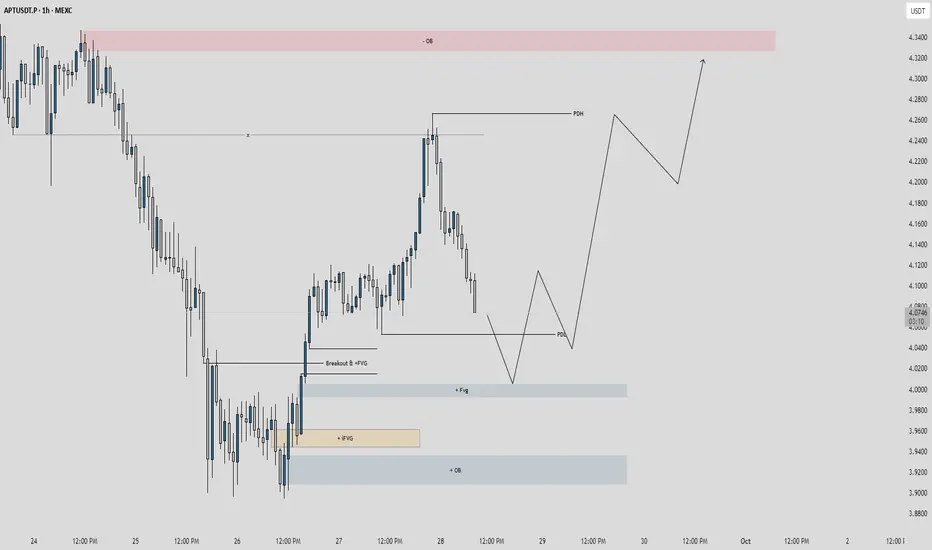
Price Action: Price broke above PDH at 4.2800 on Sep 28, showing bullish momentum, but pulled back to test support around 4.0813 (PDL).
Key Levels:
Resistance: 4.3800 (-OB, overbought zone).
Support: 4.0813 (PDL) and 4.0000 (+QB).
Zones:
Breakout +FVG: 4.0813-4.1000 (potential retest zone).
Inverted +IFVG: 3.9400-3.9600 (deeper support).
Quarter Back (+QB): 4.0000.
Trend: Bullish breakout above 4.2800, currently correcting. A hold above 4.0813 could resume the uptrend.
Long if price holds 4.0813 with confirmation target 4.2800, stop loss below 4.0600.
Trade geschlossen: Ziel wurde erreicht
Haftungsausschluss
Die Informationen und Veröffentlichungen sind nicht als Finanz-, Anlage-, Handels- oder andere Arten von Ratschlägen oder Empfehlungen gedacht, die von TradingView bereitgestellt oder gebilligt werden, und stellen diese nicht dar. Lesen Sie mehr in den Nutzungsbedingungen.
Haftungsausschluss
Die Informationen und Veröffentlichungen sind nicht als Finanz-, Anlage-, Handels- oder andere Arten von Ratschlägen oder Empfehlungen gedacht, die von TradingView bereitgestellt oder gebilligt werden, und stellen diese nicht dar. Lesen Sie mehr in den Nutzungsbedingungen.