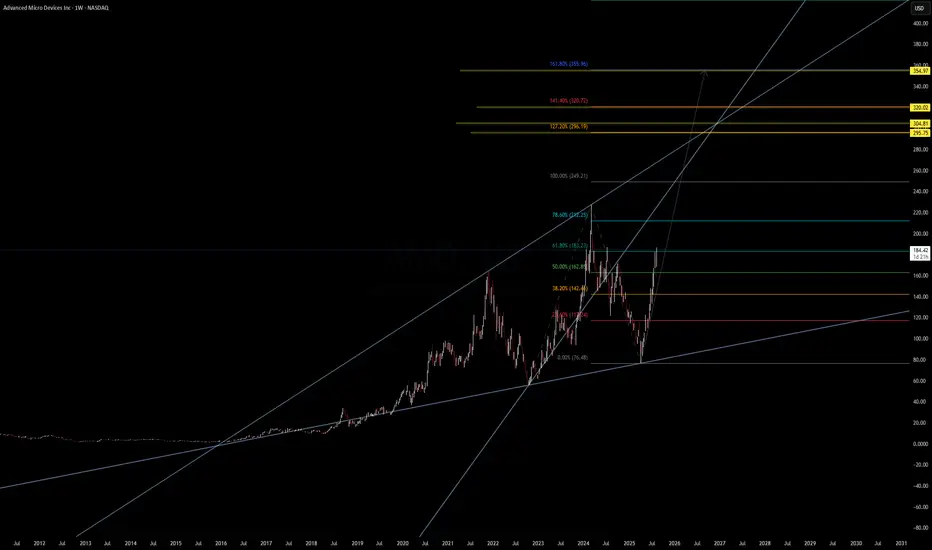
AMD | Weekly Macro Structure – Eyeing Major Fib Extensions 🚀
AMD has broken above the 61.8% retracement ($183.23) from its previous cycle and is pushing toward the 78.6% zone ($212.25). This breakout from the mid-channel region signals strong bullish momentum with clean room toward upper Fibonacci extensions.
Key Levels:
Fib Retracements:
61.8% – $183.23 ✅ (broken)
78.6% – $212.25 (next resistance)
Fib Extensions:
127.2% – $296.19
141.4% – $320.02
161.8% – $355.96
200% – $421.94
227.2% – $486.92
Trend Structure:
Long-term ascending channel intact since 2018.
Recent bounce from macro trendline near $76 set a higher low.
Breakout path projects a potential test of $300+ in the mid-term if momentum holds.
Macro & Catalysts:
AI/data center growth remains a key revenue driver, though export restrictions to China could slow short-term upside.
Positive sentiment from recent product launches and strong PC chip recovery.
Watch For:
Pullback retest of $183 support before continuation.
Weekly close above $212 for momentum confirmation toward $250–$320.
📊 Not financial advice. Chart for educational purposes.
WaverVanir ⚡ To grow and conquer
stocktwits.com/WaverVanir | wavervanir.com | buymeacoffee.com/wavervanir
Not Investment Advice
stocktwits.com/WaverVanir | wavervanir.com | buymeacoffee.com/wavervanir
Not Investment Advice
Haftungsausschluss
Die Informationen und Veröffentlichungen sind nicht als Finanz-, Anlage-, Handels- oder andere Arten von Ratschlägen oder Empfehlungen gedacht, die von TradingView bereitgestellt oder gebilligt werden, und stellen diese nicht dar. Lesen Sie mehr in den Nutzungsbedingungen.