Intraday Technical Outlook (15m Chart)
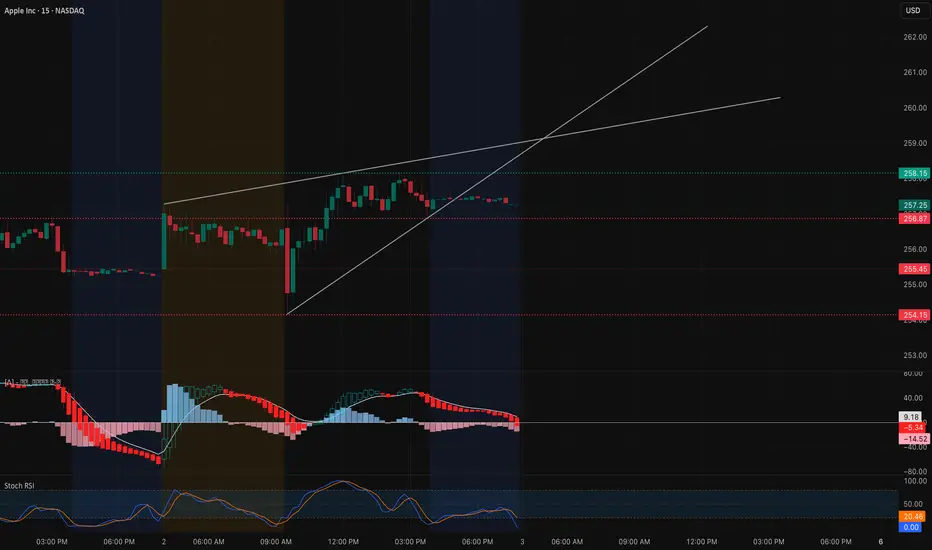
Apple (AAPL) is currently trading near $256.7, consolidating inside a rising wedge formation. The short-term trendline support is being tested, while momentum indicators show early weakness:
* MACD: Bearish crossover with histogram fading, suggesting potential downside pressure.
* Stoch RSI: Cooling off from overbought levels, hinting at reduced buying momentum.
* Key Levels: Immediate intraday support sits near $257–256.5, with stronger downside zones at $255.5 and $254.2 if wedge support breaks. Resistance remains at $259.2–260.0, aligned with the upper wedge line.
Intraday takeaway: Price action is in a tightening range — a breakdown below $256.5 could invite fast downside scalps, while a bounce back above $259.2 opens room for a squeeze toward $260+.
Options Sentiment & GEX Outlook (1H Chart)

The 1-hour GEX map is showing well-defined institutional positioning:
* Gamma Walls:
* $260–262.5: Heavy call wall cluster, aligning as a gamma resistance zone.
* $257.5: Highest positive GEX level, acting as a magnet and resistance pivot.
* $252.5–250: Key put walls, serving as gamma support.
* Implications:
* If AAPL holds above $257.5, momentum traders could target the $260–262.5 gamma wall for short-dated calls.
* Failure to sustain above $257.5 risks a fade toward the $255–252 zone, favoring put spreads.
* Volatility Context: IVR sits around 19.7 (below average), which means option premiums are relatively cheap. This favors directional plays, but be mindful of quick moves as AAPL sits near a gamma pivot.
My Thoughts & Recommendation
For Oct 3 trading, I see AAPL in a make-or-break setup:
* Intraday (scalping/trading): Watch for a wedge break. A clean move below $256.5 favors a test of $255–254. On the upside, reclaiming $259.2 can accelerate momentum toward $260–262.5.
* Options trading (swing/0DTE): Calls make sense only above $257.5, aiming for the $260–262.5 wall. Otherwise, puts are more favorable if price rejects from $257.5 and drifts back into the $255 zone.
Overall bias: Neutral-to-bearish intraday unless $259+ is reclaimed.
Disclaimer: This analysis is for educational purposes only and does not constitute financial advice. Always conduct your own research and manage risk before trading.
Apple (AAPL) is currently trading near $256.7, consolidating inside a rising wedge formation. The short-term trendline support is being tested, while momentum indicators show early weakness:
* MACD: Bearish crossover with histogram fading, suggesting potential downside pressure.
* Stoch RSI: Cooling off from overbought levels, hinting at reduced buying momentum.
* Key Levels: Immediate intraday support sits near $257–256.5, with stronger downside zones at $255.5 and $254.2 if wedge support breaks. Resistance remains at $259.2–260.0, aligned with the upper wedge line.
Intraday takeaway: Price action is in a tightening range — a breakdown below $256.5 could invite fast downside scalps, while a bounce back above $259.2 opens room for a squeeze toward $260+.
Options Sentiment & GEX Outlook (1H Chart)
The 1-hour GEX map is showing well-defined institutional positioning:
* Gamma Walls:
* $260–262.5: Heavy call wall cluster, aligning as a gamma resistance zone.
* $257.5: Highest positive GEX level, acting as a magnet and resistance pivot.
* $252.5–250: Key put walls, serving as gamma support.
* Implications:
* If AAPL holds above $257.5, momentum traders could target the $260–262.5 gamma wall for short-dated calls.
* Failure to sustain above $257.5 risks a fade toward the $255–252 zone, favoring put spreads.
* Volatility Context: IVR sits around 19.7 (below average), which means option premiums are relatively cheap. This favors directional plays, but be mindful of quick moves as AAPL sits near a gamma pivot.
My Thoughts & Recommendation
For Oct 3 trading, I see AAPL in a make-or-break setup:
* Intraday (scalping/trading): Watch for a wedge break. A clean move below $256.5 favors a test of $255–254. On the upside, reclaiming $259.2 can accelerate momentum toward $260–262.5.
* Options trading (swing/0DTE): Calls make sense only above $257.5, aiming for the $260–262.5 wall. Otherwise, puts are more favorable if price rejects from $257.5 and drifts back into the $255 zone.
Overall bias: Neutral-to-bearish intraday unless $259+ is reclaimed.
Disclaimer: This analysis is for educational purposes only and does not constitute financial advice. Always conduct your own research and manage risk before trading.
Haftungsausschluss
Die Informationen und Veröffentlichungen sind nicht als Finanz-, Anlage-, Handels- oder andere Arten von Ratschlägen oder Empfehlungen gedacht, die von TradingView bereitgestellt oder gebilligt werden, und stellen diese nicht dar. Lesen Sie mehr in den Nutzungsbedingungen.
Haftungsausschluss
Die Informationen und Veröffentlichungen sind nicht als Finanz-, Anlage-, Handels- oder andere Arten von Ratschlägen oder Empfehlungen gedacht, die von TradingView bereitgestellt oder gebilligt werden, und stellen diese nicht dar. Lesen Sie mehr in den Nutzungsbedingungen.