USOIL Trading-Ideen

Elliott wer?Hi Leute,
heute mal wieder ein Education Post!
Education ist sehr wichtig und ist das Grundgerüst um erfolgreich im Trading zu werden. Wissen allein führt nicht zum Erfolg, aber Wissen ist der erste Step zum erfolgreichen Trader :)
Heute soll es um Elliott Wellen gehen. Ich werde hier nicht super ins Detail gehen, auch nicht auf die Entstehung und Geschichte hinter den Elliott Wellen.
Kurz sei gesagt, dass Ralph Nelson Elliott versucht hat das Marktverhalten der Teilnehmer in Regeln zu packen. Ganz einfach ausgedrückt.
Die Kursverläufe sind nämlich nicht nur zufällig, sondern folgen wiederkehrenden Mustern. Durch klar strukturierte Regeln können wir Elliott Wellen, in der Theorie, ziemlich einfach traden. Sie zu finden ist für die meisten das größere Problem. Wichtig ist auch, dass bei der Theorie die Fibonacci Zahlen zum tragen kommen.
Der Markt besteht immer aus Impuls- und Korrekturbewegungen .
Die Elliot Wellen Theorie zählt dabei eine 5 wellige Bewegung (1-2-3-4-5), bei dem die 1/3/5 dem Trend folgen und 2/4 korrektive Bewegungen sind.
Impulsbewegungen sind 5-wellig und Korrekturbewegungen sind 3-wellig.
Hier die wichtigsten Regeln:
Welle 2 darf Welle 1 nicht zu 100% korrigieren
Welle 3 ist nie die kürzeste Welle
Welle 1 und Welle 4 dürfen sich nicht überschneiden
Es gibt verschiedene Korrekturformen die ich nur erwähnt haben will:
Es gibt Dreiecke (Expanding/Contracting), Zigzags, Flats und Kombinationen davon. Auch Sonderformen wie ein Double Zigzag oder ein Triple Zigzag sind möglich.
Ziele der Wellen:
Target Welle 2: 50-61,8er RT = 73% Warscheinlichkeit
Target Welle 3: 161,8-200% Extension = 75% Warscheinlichkeit
Welle 4: 38,2% RT = 60% Warscheinlichkeit
Welle 5: 61,8% & 61,8%-100% Extension jeweils 33% Warscheinlichkeit
(RT=Retracement/Korrektur)
Es ist also enorm wichtig, dass die Regeln, Korrekturen und Extensionen eingehalten werden, ansonsten ist der Count invalid.
Hier ein paar Beispiele in der Praxis:
Mein Kanal für Updates und Analysen:
🤷 just pm me
©System learned from Stefan Kassing
Hinweis: Diese Analyse stellt keine Anlageempfehlung dar!

WTI Öl - Kommt der Trendwechsel zur Kurshalbierung?Wieder wird der 61,8% Rücklaufbereich erreicht und wieder scheint es im Markt dort einen Widerstand zu geben. Kommt nun der nächste drastische Abverkauf mit Kurshalbierung + X$


usoil long buy stop at 61.91usoil hat das 618 retracemen mehrmals angetestet und die support-zone nicht durchbrochen ich warte eine long position
erfolgreiche wohne an jeden :)

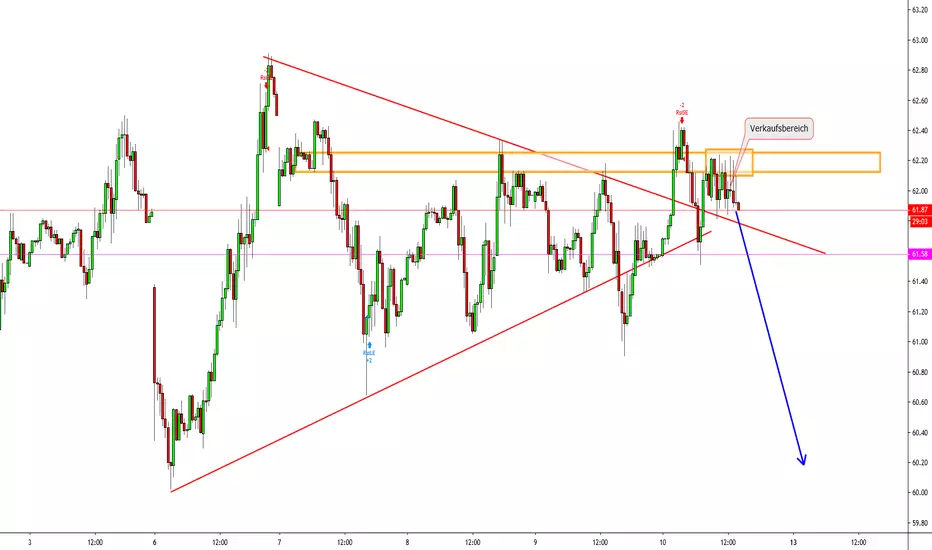
USOIL Sell wir warten bis der markt in unseren verkaufsbeich hinein läuft und dort werden wir ihn. trendfolge


USDWTI Pizza TradeLeider wurde meine letzte Analyse gesperrt, deshalb hier nochmal
SHORT in der Zone
und TP bei 81.825 erreicht!


Öl vor Trendwechsel?Grüße euch,
aufgrund der tieferen Tiefs und tieferen Hochs gehe ich hier zumindest von einer kleineren Korrektur aus. Wenn man sich den Daily anschaut ist da ja massig Potenzial nach unten. Eine 3er Wellenbewegung hat ihr Ziel im Korrekturlevel zwischen 0.50 und 0.618. Deshalb rechne ich hier verstärkt mit Reaktionen

Sequenzen regieren Öl! Hi Leute,
Vorab: Falls ihr alle Updates zu den Ideen erhalten wollt dann folgt am besten der Idee, bzw. mir, denn die Updates enthalten wichtige Informationen und Tradingideen .
Ich würde euch empfehlen erst einmal die übergeordnete Ansicht anzuschauen, bevor ihr euch auf die untergeordneten Sequenzen einlasst. Nicht von den vielen Sequenzen verwirren lassen! ;)
Der Markt hat uns allein bis jetzt schon unzählige Chancen gegeben... Die nächste könnte bald folgen!
Hier die übergeordnete Ansicht im Daily:
Wir haben eine Abwärtsbewegung die im Korrekturlevel reagiert hat. Die Bewegung dorthin kann mit einer Sequenz eingezeichnet werden (ABC). Die Sequenz bestimmt genaue Zielbereiche, die der Markt erreichen muss und auch hat. Ausgehend von dem übergeordneten Kl und der Sequenz war der Bereich knapp über dem Korrekturlevel sehr interessant.
Die Idee ist nun folgende: Der Markt soll mindestens die Kl der Sequenz erreichen, wenn nicht sogar die Kl der gesamten Aufwärtsbewegung (blau).
Untergeordnetes Bild im H1:
Wir haben die übergeordnete Sequenz und eine kleinere schwarze Sequenz die uns interessante Einstiege im Verkkaufsbereich ermöglichten. Hier hat der Markt sehr schön reagiert und ist gefallen. Die darauffolgende Korrektur startete eine größere bärische Sequenz (hellblaue Sequenz), die ihre Ziellevel passenderweise in der "Mindestkorrektur" der übergeordneten roten Sequenz hat. Die lilane Sequenz endete im Verkaufsbereich und hat es uns ermöglicht Entrys noch genauer zu definieren.
Der Bereich an dem sich Verkaufsbereich und Mindestziel der lilanen Sequenz geschnitten haben war dabei der interessanteste.
Ausgehend von dem Wissen hat der Kurs nach einer erneuten Abwärtsbewegung im Korrekturlevel reagiert und damit die blaue Sequenz gebildet, die in der hellblauen C Welle steckt. Die blaue Sequenz hat die Ziellevel erreicht, somit ergibt sich ein erneuter Verkaufsbereich im blauen Kästchen.
Hier das Mindestziel der hellblauen Sequenz:
Mein Kanal für Updates und Analysen:
🤷 just pm me
©System learned from Stefan Kassing
Hinweis: Diese Analyse stellt keine Anlageempfehlung dar!

USOILBei USOIL Bildet sich im D und 4h ne Bearische Divergenz. Im 4h ist sie Fertig, beim D müsste man noch den D close abwarten. Könnte eine tolle short Idee ergeben.

Es scheint den USOIL-Preis auf dem Weg zu den 75,00-ZonenWie wir vor zwei Tagen mitteilten, hat Präsident Donald Trump neue Sanktionen gegen den Iran angekündigt, die den USOIL-Preis nachgeben lassen und eine neue Nachfrage schaffen. Diese neue Nachfrage kann im 1-Stunden-Chart gesehen werden Level und ich kaufe dort, wenn der Preis die Nachfrage nachverfolgt, auf dem 1D-Chart können wir sehen, dass der USOIL-Preis bullisch ist und wahrscheinlich bis zum Erreichen des Angebots bullish bleiben wird. Dieses Angebot ist das Ziel für die Kaufposition und auch es ist ein großartiges Niveau für die Verkaufsposition für die langen Konditionen.

USOIL schöne Sell Möglichkeit!Hier sehen wir einen Ausbruch mit retest, welches gleichzeitig dem 61.8er entspricht.
Das ganze könnte den USDCAD nach oben schieben.
mehr muss ich dazu nicht sagen. Sehr eindeutig.
warten auf bearishe Confirmation.
Ziel wäre erstmal eine Support am 38.2er und das 61.8er.

usoil long warten auf breakout usoil lomng warten auf breakout das sich resistance zone sich zur einer support zone entwickelt

WTI - Schneller Short im M15Hallo zusammen,
im WTI bietet sich für uns eine Short Möglichkeiten.
Ausgehend vom übergeordneten Trendkanal (Aufwärtsbewegung) sollten wir den Stopp aber eng halten.
Für den Trade spricht aber das hohe CRV und das abflachende Volumen bei den Buys, während zuletzt das Sell Volumen deutlich anstieg.
Hinweis: Unsere Analysen stellen keine Anlageempfehlung dar! Der Handel an der Börse birgt erhebliche Risiken. Diese müssen stets beachtet werden!

US OilAm Freitag waren die Ölpreise bereits unter Druck geraten, nachdem Konjunkturdaten aus der deutschen und französischen Industrie stark enttäuscht hatten. Bestehende Konjunktursorgen wurden durch die Daten verstärkt. Sollte sich die globale Konjunktur tatsächlich stark eintrüben, spräche dies für eine schwächere Rohölnachfrage und damit fallende Erdölpreise.
Belastet wurde Rohöl darüber hinaus durch den starken US-Dollar. Dieser profitierte von der weltweiten Fluchtbewegung, die die Industriedaten aus Europa auslösten. Ein starker Dollar verteuert Erdöl für Investoren außerhalb des Dollarraums und lastet deshalb auf der Nachfrage. Außerdem wurden riskantere Anlagen, zu denen auch Rohstoffe wie Rohöl gehören, angesichts der hohen Unsicherheit eher gemieden.

Öl mit größerem KorrekturpotenzialHallo Leute,
hier ein wunderschönes Beispiel, um zu sehen, dass sequenzartige Bewegungen sehr viel stabiler und aussagekräftiger sind als unstrukturierte Bewegungen.
Wir beginnen, dass der Markt an der 57.67 unten links im Bild eine bullische Sequenz startete, die sowohl mit B als auch mit C die perfekten Ziellevel abgearbeitet hat. Solche perfekte Ziele, erhöhen die Wahrscheinlichkeit, dass der Markt nach einer nötigen Korrekturbewegung, die eigentliche Richtung wieder aufnimmt. So auch hier. Nach der sauberen bullischen Sequenz, kam die nötige Korrekturbewegung, die genau in den bullischen overshoot lief.
Hier reagierte der Markt wieder bullisch und generierte aus diesem Level oben ein neues High, welches gleichzeitig das 78,6er Extensionslevel der Welle 5 im übergeordnetem Chart ist. Bild folgt in den Updates.
Diese Bewegung aus dem bullischem overshoot unterscheidet sich aber sehr von der letzten Aufwärtsbewegung. Das erste türkise ABC veranschaulicht eine strukturierte Sequenz, die für Stabilität spricht. Die beschriebene Reaktion aus dem overshoot Bereich hingegen ist sehr strukturlos, was für Instabilität spricht. Diese Erkenntnis kombiniert mit dem Fakt, dass der Markt nahe dem 78,6er Extensionslevel der Welle 5 ist, ließ darauf blicken, dass es zu bärischen Reaktionen kommen kann.
Diese Reaktion kam im Sinne einer starken bärischen Sequenz, die nun erlaubt, damit zu rechnen, dass eine Korrekturbewegung zur gesamten Aufwärtsbewegung im höheren Timeframe kommen kann.
Hier ergibt sich auch ein neuer Verkaufsbereich, der auch eingezeichnet ist, da sowohl der EW Count als auch die bärische Sequenz erfolgreich abgeschlossen ist.
Hinweis: meine Analysen stellen keine Anlageempfehlung dar!

Auf lange Sicht steigende PreiseÖl befindet sich auf Monatsbasis in einer größeren Korrektur, um genauer zu sagen in einem klassischen und sauberen Flat-Dreieck.
Also vormerken ist angesagt, wer nicht im Dreieck handeln möchte.
Definition:
Eine Dreiecksformation bewegt sich in einer 3-3-3-3-3-Formation mit den Bezeichnungen A, B, C, D und E. Diese Formation deutet auf einen Ausgleich der Kräfte hin und die Kurse bewegen sich Seitwärts bei geringer werdenden Volumen. Die Welle E beachtet häufig nicht die Begrenzungslinie und muss daher nicht bis zu ihr laufen, kann sie aber auch überschreiten.

ÖL für den MotorCrude und Brent laufen vom Muster fast gleich ab.
ARTE Doku - 05.05.2015 - Täuschung - Die Methode Reagan
www.youtube.com
_________________________________________________________________________
für alle die sich gefragt haben warum Öl so niedrig ist.
DIe Saudis spielen da eine große Rolle.
USA Fraking
Der Preissturz macht es allerdings noch dramatischer: Russland ist vom Öl ähnlich abhängig wie Venezuela. Rund 68 Prozent seiner Gesamteinnahmen erzielt es aus dem Geschäft mit Öl und Gas. Weitere 10 Prozent mit Industriemetallen, deren Preise ebenfalls am Öl hängen. Ohne die Einnahmen aus Ölfördersteuern und Ausfuhrzöllen hätte das russische Finanzministerium nur halb so viel Geld. Der Staat erlöste zuletzt 174 Milliarden Dollar aus dem Export von Rohöl und weitere 109 Milliarden Dollar mit anderen Ölprodukten, demnächst nur noch die Hälfte davon.
Es rächt sich noch etwas anderes: Viele Ölfelder und Raffinerien gehören ausländischen Energiekonzernen, die das Öl auf dem Weltmarkt für Dollar verkaufen. Aber sie zahlen ihre Steuern in Russland in Rubel. Und dessen Wert sinkt rasant. Dem Staat versiegen also die Einnahmen. Inzwischen droht bereits jeder vierten der 83 russischen Regionen der Bankrott, beziffert die Wirtschaftsuniversität Moskau. Das Haushaltsdefizit des Staates lag zuletzt bei 3,7 Prozent – und es ist das einzige, was in der derzeitigen Wirtschaftslage noch wächst.
__________________________________________________________________
Wer Gegenwartsgeschichte verstehen will, muss eigentlich nur ins Archiv gehen. Geschichte wiederholt sich. Muster und Methoden, die sich bewährt haben, werden von den Machthabern schlichtweg wiederholt. So ist auch Krieg als Mittel der Politik bis heute ein Werkzeug, das von den Eliten angewandt wird, um den eigenen Vorteil auszubauen oder aber die Gegenseite endlich auf Normgröße zurückzustutzen.
Dieses Spiel der Macht wird von denen gespielt, die die Demokratie nur für einen vorübergehenden Irrtum der Geschichte halten. Finanzoligarchen, die sich im Westen auch gern als Philanthropen verkleiden.
Viel ist von dieser Demokratie nicht mehr übrig, denn dazu müssten die wesentlichen Tools tatsächlich in den Händen der Völker liegen. Das ist nicht der Fall.
Mega-Banken, Globalplayer-Konzerne und die großen Massenmedien gehören letztenendes Privatpersonen und werden von diesen wie Waffen eingesetzt. Natürlich geht es in diesem System nicht ohne Feindbild.
Der Feind der Eliten ist die Wahrheit. Nur durch permanente Manipulation der Massen ist ihr System überhaupt stabil. In einem dichten Netzwerk, bestehend aus Runden-Tischen, Stiftungen, Think-Tanks oder „Bildungseinrichtungen“, bilden sie immerzu die nächste Generation gehirngewaschener Überzeugungstäter heran.
Am Ende des Tages wird dann aber Krieg geführt, und kommt auch dieses Land, Deutschland, als Außenposten der USA nicht ohne Mord und Totschlag im Auftrag der Freiheit aus.
Aktuell wurde Russland wieder zum „Reich des Bösen“ erklärt. Dieser Begriff stammt vom ehemaligen US-Präsidenten Ronald Reagan und damit aus den 1980ern. Reagen war ein Kalter Krieger wie aus dem Lehrbuch und hatte sich mit jeder Faser seines politischen Handelns der Täuschung verschrieben. Reagan hasste die UdSSR. Er wollte sie um jeden Preis zerstören.
Dieses Ziel gelang ihm und seinen Beratern. Teilweise. Russland unter Putin ist wieder da. Ist die Ukraine-Krise Zufall? Oder soll unter Obama nur zu Ende gebracht werden, was Reagan nicht mehr gelang?
Die aktuelle Reportage „Täuschung - die Methode Reagan“ des Filmemachers Dirk Pohlmann wurde am 5. Mai auf Arte gezeigt. Dirk Pohlmann ist es in seiner Reportage erstmals gelungen, die US-Machtstrategen von damals vor die Kamera zu bekommen. Er hat es darüber hinaus auch geschafft, mit den Opfern des Imperialismus zu sprechen. Da wären z.B. die Schweden.
Schweden, als damals neutraler Staat, wurde unter Reagan Teil des Schlachtfeldes. Reagan war der schwedische Ministerpräsident Olof Palme ein Dorn im Auge. Olof Palme war wie Willy Brandt oder Egon Bahr ein Mann, der einen dritten Weg gehen wollte. Kooperation statt Konfrontation. Palme wurde später ermordet.
Das Résumé der Geschichte von damals, und wie wir die Erkenntnisse heute einzuordnen haben, wenn wir erkennen müssen, dass die Eliten auch 2015 nichts aus einem Fast-Atomkrieg gelernt haben. Wir haben unter Ronald Reagan nicht überlebt, da er und seine Berater in den Machtzentren erkannt hatten, dass die Mechanik der Provokation sich bereits verselbständigt hatte, sondern weil wir schlichtweg Glück gehabt hatten.
Der Film „Täuschung - die Methode Reagan“ erhielt am 27.4. auf dem russischen Filmfestival bereits den Preis „Bester ausländischer Film“ und ist in den kommenden Tagen online bei Arte weiterhin anzusehen.
www.kenfm.de
