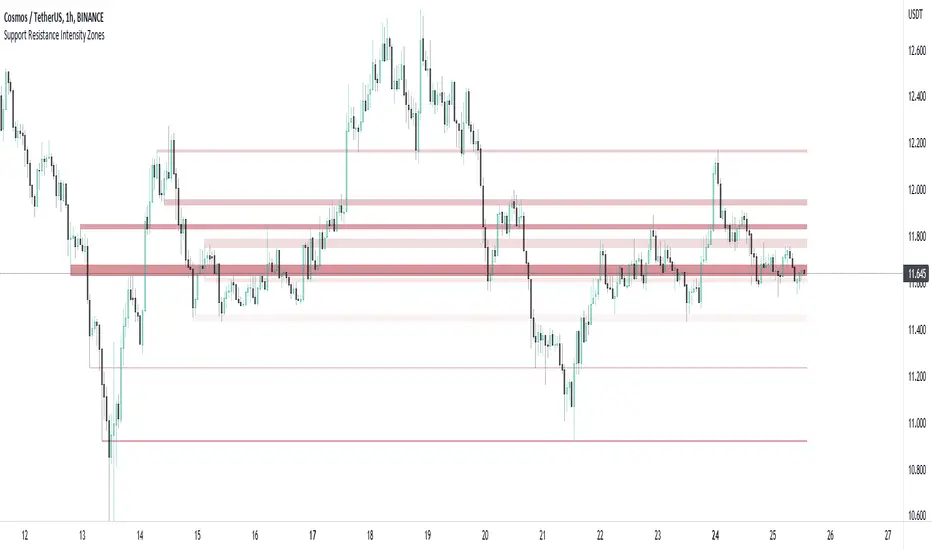
Support and Resistance Intensity ZonesSupport and resistance are often drawn using lines. This is too simple and doesn't give a clear idea of the market sentiment at these particular levels. What is strong support and resistance? What is weak support and resistance. How can either be defined by a single price point?
Using a simple, clean and configurable solution, this indicator not only shows these support and resistance levels as zones, it also gives them a colour gradient based on their intensity.
It does this by letting you choose the pivot highs and lows within a chosen range back. Then you choose one of two options to display how these multiple pivots at the same levels look. You can either group these pivots together into 'zones', where grouped pivots are all separated by a chosen price percentage, choosing how many zones to display, the most grouped pivots being the most intense colour.
Alternatively you display the pivots by 'gradient', where the closer the pivots are together in price the more intense the colour. As pivots diverge apart, the colour weakens.
Both of these options have to be seen to realise how much more there is to support and resistance than a single line.
Zones
Gap ZonesSharing a simple gap zone identifier, simply detects gap up/down areas and plots them for visual reference. Calculation uses new candle open compared to previous candle close and draws the zone, a mid point is plotted also as far too often it's significance is proven effective.
Works on any timeframe and market though I recommend utilizing timeframes such as weekly or daily for viewing at lower timeframes such as 5, 15 or 30 minutes.
Often price is observed reaching towards zone high/mid/low before rejection/bouncing. These gap zones can give quantitative basis for trade management.
Future features may include alerts based on price crossing up/down gap low, mid and highs. Feel free to message with any other suggestions.

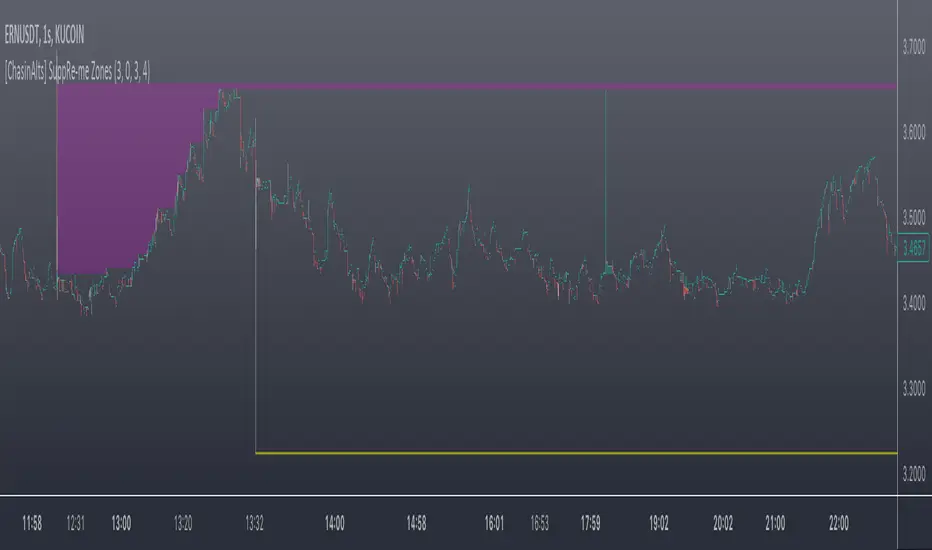
[ChasinAlts] SuppRe-me ZonesHello fellow tradeurs, I couldn't find one similar on TV so wanted to make it.. Took me a little while to figure some things out as I am in new coding territory with this script. I had a hard time finding ways to make only a partial zone/box disappear if price only crossed part of it. Nonetheless, I figured it out so I hope you enjoy the outcome. Now, allow me to take a second to first explain the utility that is this script...or at least expose my reasoning when I decided to go ahead with this little project and take the precious time necessary to learn parts of pine that I did not previously know how to deal with. Ultimately, I built this for the 1s-15s TF(except for the "Consecutive Bars/Large Bars" Boxes...Those were meant to use on both these second TFs and Higher TFs.... ). The reasoning behind all of this was to give me a more definitive answer to all of my questions regarding the speed at which it would take price to revisit areas that it very abruptly went to/left on a VERY short TF (like the 1sec charts)...or even if it EVER would). To determine this I wanted to draw lines starting at the end of large wicks, draw boxes spanning the entire span of large wicks, and lastly to draw boxes spanning the entire span of very large bodies. For this last one, not only did I want to draw a box on a single candle that possessed a large body but also if there were consecutive red candles in a row, their bodies could be summed up and if this summation exceeds the minimum body % threshold then it too counts just like a single large candled body would if it was larger than the threshold. All in all I really enjoyed this script and most importantly the data that it produces. What I found after coding the script was that (again on the 1 sec- 15 sec charts) was that price very quickly (relatively speaking I suppose) came back over these box/zoned areas and that the lines drawn from the tip of the large wicks would at some point in the near future act as very good support and resistance for price to either bounce off of or breakout from.
Now, with each of these objects you can choose to delete them when price crosses the object or have them continuously drawn on the chart...your call...but it gets awful messy sometimes if you let them continue printing.
Peace and love people...peace and love,
-ChasinAlts
SuperTrend Support & Resistance(My goal creating this indicator) : Provide a way to categorize and label key structures on multiple time frames so I can create a plan based on those observable facts.
The Underlying Concept / What is Momentum?
The Momentum shown is derived from a Mathematical Formula, SUPERTREND. When price closes above Supertrend Its bullish Momentum when its below Supertrend its Bearish Momentum. On the first bar bearish momentum is detected a resistance Level is made at the highest point of the previous bullish condition. On the first bar bullish momentum is detected a support Level is made at the lowest point of the previous bearish condition. As I become a better analyst I will find better techniques and this source code may become open-source, but as of now it remains protected. This indicator scans for bullish & bearish Momentum on the Timeframes selected by the user and when there is a shift in momentum on any of those time frames (price closes below or above SUPERTREND ) it notifies the trader with a Supply or Demand level with a unique color and Size to signify the severity of said level.
What is Severity?
Severity is How we differentiate the importance of different Highs and Lows. If Momentum is detected on a higher timeframe the Supply or Demand Level is updated. The Color and Size representing that higher timeframe will be shown. Demand and Supply Levels made by higher Timeframes are more SEVERE then a demand level made by a lower Timeframe.
Technical Inputs
- If you want to optimize the rate of signals to better fit your trading plan you would change the Factor input and ATR Length input. Increase factor and ATR Length to decrease the frequency of signals and decrease the Factor and ATR Length to increase the frequency of signals.
- to ensure the correct calculation of Support and Resistance levels change BAR_INDEX. BAR_INDEX creates a buffer at the start of the chart. For example: If you set BAR_INDEX to 300. The script will wait for 300 bars to elapse on the current chart before running. This allows the script more time to gather data. Which is needed in order for our dynamic lookback length to never return an error(Dynamic lookback length cant be negative or zero). The lower the timeframe the greater the amount of bars need. For Example if I open up a 30 sec chart I would enter 5000 as my BAR_INDEX since that will provide enough data to ensure the correct calculation of Support and Resistance levels.
Time Frame Inputs
- The indicator has 3 Time Frame Displays where you can choose how SEVERE You want the Supply and Demand Levels. For Example: 1min, 3min, 5min, 15 min Levels, 60 min levels Weekly Levels, etc.....The higher the Timeframe Selected the more SEVERE the Level.
- Use the Amount of time Frames input to increase or limit the amount of time frames that will be displayed onto the chart.
Display Inputs
- The toggle (Trend or Basic) option Lets the trend determine the colors of the Support and Resistance Levels or Basic where the color is strictly based on if its a high or a low ( Trend = HH,HL,LL,LH)
- Toggle options (Close) and (High & Low) creates Support and Resistance Levels using the Lowest close and Highest close or using the Lowest low and Highest high.
Toggle on both or toggle off both in order to use both these values when determining the trend of your chart. For Example this would mean (Price has to close higher then the highest high. Not only make a higher high or a
higher close) and the inverse (Price has to close lower then the lowest low. Not only make a lower low or a lower close)
How Trend Is being Determined ?
(Previous Supply Level > Current Supply Level ) if this statement is true then its s LH so the trend is bearish if this statement is false then its a HH so the trend is bullish
(Previous Demand Level > Current Demand Level ) if this statement is true then its a LL so the trend is bearish if this statement is false then its a HL so the trend is bullish
(Close > Current Supply Level ) if this statement is true technically price made a HH so the trend is bullish
(Close < Current Demand Level ) if this statement is true technically price made a LL so the trend is bearish
- Fully customize how you display and label Market Structure in specific timeframes. Line Length, Line Width, Line Style, Label Distance, Label Size, Label Background Size, and Background Color can all be customized.
- Lastly Is the Trend Chart. To Easily verify the current trend of any timeframes displayed by this indicator toggle on Chart On/Off . You also get the option to change the Chart Position and the size of the Trend Chart
*****The Current charts timeframe has to lower then a month to ensure correct calculation of Supply and Demand Levels*****
How it can be used ?
(Examples of Different ways you can use this indicator) : Easily categorize the severity of each and every Supply or Demand Level in the market (The higher the time frame the stronger the level)
: Quickly Determine the trend of any Timeframe
: Get a consistent view of a market and how different time frames are behaving but just use one chart.
: Take the discretion from hand drawing support and resistance lines out of your trading
: Find and categorize strong levels for potential breakouts
: Trend Analysis, Use multiple time frames to create a narrative based on observable facts from these time frames
: Different Targets to take money off the table
: Use labels to differentiate between different trend line setups
: Find Great places to move your stop loss too.

TriexDev - Liquidation Rekt LevelsTriexDev - Liquidation Rekt Levels TradingView Indicator
A basic indicator which lets you see where positions will be liquidated. Each line is based on default leverage levels typically used for trading. (3x,5x,10x,25x,50x)
Have a subtle 'label prompt' on the 3x - because I had noticed some people didn't understand what labels were in other indicators.
In the settings:
- There is an offset to adjust the levels horizontally, this is to help make it easier to track if the chart has hit liquidation positions.
- You can change colours/opacity of the lines.
- You can hide the 'Labels', and/or 'label prompt'
- In the 'Style' tab you can hide individual levels.
Inspired/initially based off 'Mex Rekt Level'
I often have this added to my charts, and toggle visibility when I want to check the liq levels.
GitHub Repo for tidier/more detailed documentation as it is updated.

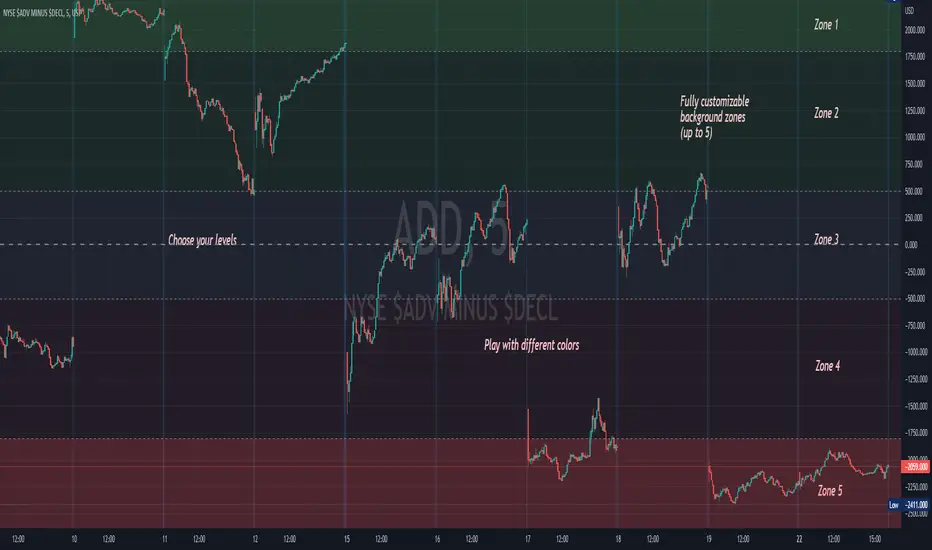
Background ZonesThis script provides up to 5 zones to apply background colors. This is especially useful for applying to indices such as USI:TICK , USI:ADD , and USI:VOLD , where certain levels provides significant meaning to market sentiment and directions. This script will give you the visual cue to help with your trading.
All levels and colors are fully customizable.
Enjoy~!!
Example:
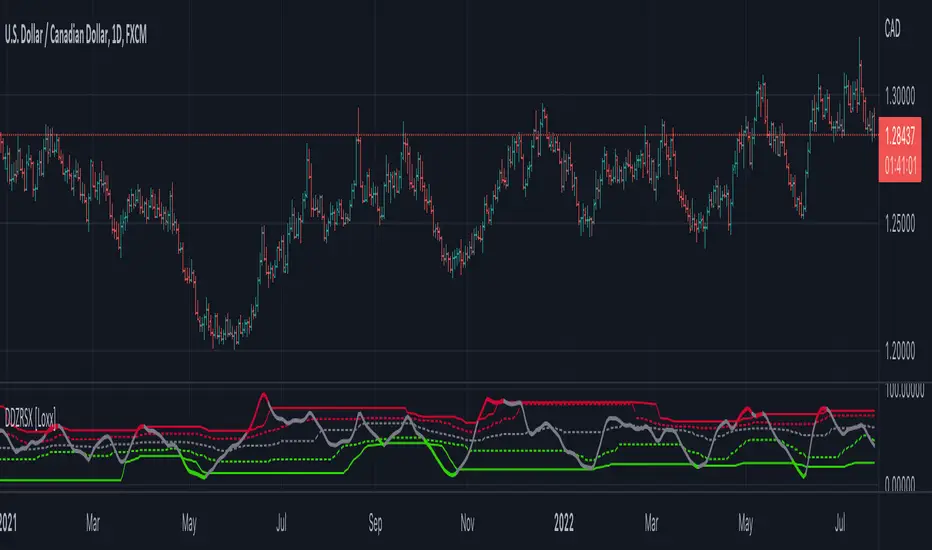
Double Dynamic Zone RSX [Loxx]Double Dynamic Zone RSX is a Juirk RSX RSI indicator using Leo Zamansky and David Stendahl's Dynamic Zones to determine breakouts, breakdowns, and reversals.
What is RSX?
RSI is a very popular technical indicator, because it takes into consideration market speed, direction and trend uniformity. However, the its widely criticized drawback is its noisy (jittery) appearance. The Jurik RSX retains all the useful features of RSI , but with one important exception: the noise is gone with no added lag.
What are Dynamic Zones?
As explained in "Stocks & Commodities V15:7 (306-310): Dynamic Zones by Leo Zamansky, Ph.D., and David Stendahl"
Most indicators use a fixed zone for buy and sell signals. Here’ s a concept based on zones that are responsive to past levels of the indicator.
One approach to active investing employs the use of oscillators to exploit tradable market trends. This investing style follows a very simple form of logic: Enter the market only when an oscillator has moved far above or below traditional trading lev- els. However, these oscillator- driven systems lack the ability to evolve with the market because they use fixed buy and sell zones. Traders typically use one set of buy and sell zones for a bull market and substantially different zones for a bear market. And therein lies the problem.
Once traders begin introducing their market opinions into trading equations, by changing the zones, they negate the system’s mechanical nature. The objective is to have a system automatically define its own buy and sell zones and thereby profitably trade in any market — bull or bear. Dynamic zones offer a solution to the problem of fixed buy and sell zones for any oscillator-driven system.
An indicator’s extreme levels can be quantified using statistical methods. These extreme levels are calculated for a certain period and serve as the buy and sell zones for a trading system. The repetition of this statistical process for every value of the indicator creates values that become the dynamic zones. The zones are calculated in such a way that the probability of the indicator value rising above, or falling below, the dynamic zones is equal to a given probability input set by the trader.
To better understand dynamic zones, let's first describe them mathematically and then explain their use. The dynamic zones definition:
Find V such that:
For dynamic zone buy: P{X <= V}=P1
For dynamic zone sell: P{X >= V}=P2
where P1 and P2 are the probabilities set by the trader, X is the value of the indicator for the selected period and V represents the value of the dynamic zone.
The probability input P1 and P2 can be adjusted by the trader to encompass as much or as little data as the trader would like. The smaller the probability, the fewer data values above and below the dynamic zones. This translates into a wider range between the buy and sell zones. If a 10% probability is used for P1 and P2, only those data values that make up the top 10% and bottom 10% for an indicator are used in the construction of the zones. Of the values, 80% will fall between the two extreme levels. Because dynamic zone levels are penetrated so infrequently, when this happens, traders know that the market has truly moved into overbought or oversold territory.
Calculating the Dynamic Zones
The algorithm for the dynamic zones is a series of steps. First, decide the value of the lookback period t. Next, decide the value of the probability Pbuy for buy zone and value of the probability Psell for the sell zone.
For i=1, to the last lookback period, build the distribution f(x) of the price during the lookback period i. Then find the value Vi1 such that the probability of the price less than or equal to Vi1 during the lookback period i is equal to Pbuy. Find the value Vi2 such that the probability of the price greater or equal to Vi2 during the lookback period i is equal to Psell. The sequence of Vi1 for all periods gives the buy zone. The sequence of Vi2 for all periods gives the sell zone.
In the algorithm description, we have: Build the distribution f(x) of the price during the lookback period i. The distribution here is empirical namely, how many times a given value of x appeared during the lookback period. The problem is to find such x that the probability of a price being greater or equal to x will be equal to a probability selected by the user. Probability is the area under the distribution curve. The task is to find such value of x that the area under the distribution curve to the right of x will be equal to the probability selected by the user. That x is the dynamic zone.
Linear Regression ChannelsThese channels are generated from the current values of the linear regression channel indicator, the standard deviation is calculated based off of the RSI . This indicator gives an idea of when the linear regression model predicts a change in direction.
You are able to change the length of the linear regression model, as well as the size of the zone. A negative zone size will make the zone stretch away from the center, and a positive zone size will make it stretch towards the centerline.

Market Maker Volatility Diameter V2 by Hawkeye Charting***German Description below***
Hey guys,
we are proud to publish the Market Maker Volatility Diameter V2!
Our goal with this indicator is to provide an All-in-one indicator, combining some special tools of open source scripts as well as some of our own developments and the algorithm of our MMVD V1.
We will create a video series very soon, where we will explain each aspect of the tool, your options and of course our trading strategies with this indicator.
You have the following technical tools and information combined in this indicator, which can each be shown and hidden:
- Psychological Ranges (Weekly Opening High/ Low for Crypto and Forex)
- Market Maker Sessions (Sydney, Asia, London, NY)
- Trade Cloud (algorithm developed by Hawkeye Charting)
- Fibonacci Cloud (inspired by watching paid offerings, coded by Hawkeye Charting)
- Display Moving Averages (select the visualization of up to 6 moving averages. You can change for each of these 6 MA's the type and the length.)
- Display Major Trend Cloud (developed by Hawkeye Charting)
- PVSRA Candle Colors
- Vector Candle Zones
- Pivots
- Pivot Fibonacci Levels (developed by Hawkeye Charting)
- OHLC-Levels
- Average Daily, Weekly, Monthly Ranges
- Volume Profile for Intraday Trading for up to 8 days.
We hope especially for people, who can not afford the Pro offering from TradingView, to give access to a good indicator, which includes many tools and alerts.
Our goal is to lower the barriers for new entrants and of course to protect people, to pay for indicators, which are completely insane priced.
Only, that you get an idea: the whole indicator has only cost me about 100 h of work (for a single person!), and I'm no Pine script expert, so don't get fooled when someone offers you insane amounts for an indicator...
There is no holy grail. Each indicator works only with calculations on previous data.
We appreciate seeing that you guys like this work, so please leave a like and a follow and share this indicator.
*****German Description*****
Hey Leute,
wir sind stolz, unsere 2. Version des Market Maker Volatility Diameter zu veröffentlichen!
Unser Ziel ist es, mit diesem Indikator eine All-In-One Lösung anzubieten, welche einige nicht ganz geläufige Tools sowie unsere eigenen Entwicklungen und natürlich den Algorithmus des MMVD V1 vereinen.
Wir werden in naher Zukunft eine Video Serie veröffentlichen, in welcher wir Stück für Stück jeden Aspekt des Werkzeugs, die Einstellungsmöglichkeiten sowie unsere Trading Strategien mit diesem Indikator erklären werden.
Ihr habt die folgenden technischen Werkzeuge und Informationen in diesem Indikator vereint, welche jede einzeln an- oder abgewählt und eingestellt werden können:
- Psychological Ranges (Weekly Opening High/ Low für Krypto and Forex)
- Market Maker Sessions (Sydney, Asia, London, NY)
- Trade Cloud (Algorithmus von Hawkeye Charting entwickelt)
- Fibonacci Cloud (inspiriert von der Beobachtung eines Paid-Indikators, Code geschrieben von Hawkeye Charting)
- Moving Averages (Ihr könnt die Darstellung von bis zu 6 Gleitenden Durchschnitten auswählen und für jeden dieser Durchschnitte den Typ und die Länge ändern.)
- Display Major Trend Cloud (entwickelt von Hawkeye Charting)
- PVSRA Candle Colors
- Vector Candle Zones
- Pivots
- Pivot Fibonacci Levels (entwickelt von Hawkeye Charting)
- OHLC-Levels
- Average Daily, Weekly, Monthly Ranges
- Volume Profile für Intraday Trading, Darstellungsmöglichkeit für 3-8 Tage
Wir hoffen, dass wir speziell für Leute, die sich nicht das PRO-Abo aufwärts von TradingView leisten können, Zugang zu einem guten Indikator, welche viele Werkzeuge und Alarme vereint gewährleisten zu können.
Unser Ziel ist es, die Eintrittsbarrieren für neue Marktteilnehmer senken und natürlich Leute vor wahnsinnigen Paid-Angeboten beschützen zu können.
Nur, damit ihr eine Vorstellung bekommt: den gesamten Indikator hat mich lediglich 100h Arbeit gekostet (für eine einzelne Person!), und ich bin kein Pine Script Experte. Also lasst euch bitte nicht verar******, wenn euch Paid-Angebote erreichen, mit dem Versprechen, den "zu 95% erfolgreich" Indikator erwerben zu können.
Es gibt keinen heiligen Gral, jeder Indikator arbeitet nur mit Berechnung von Vergangenheitswerten.
Wir würden uns riesig freuen, wenn euch diese Arbeit gefällt und ihr uns Likes und Follows hinterlasst und ihr diesen Indikator teilt.

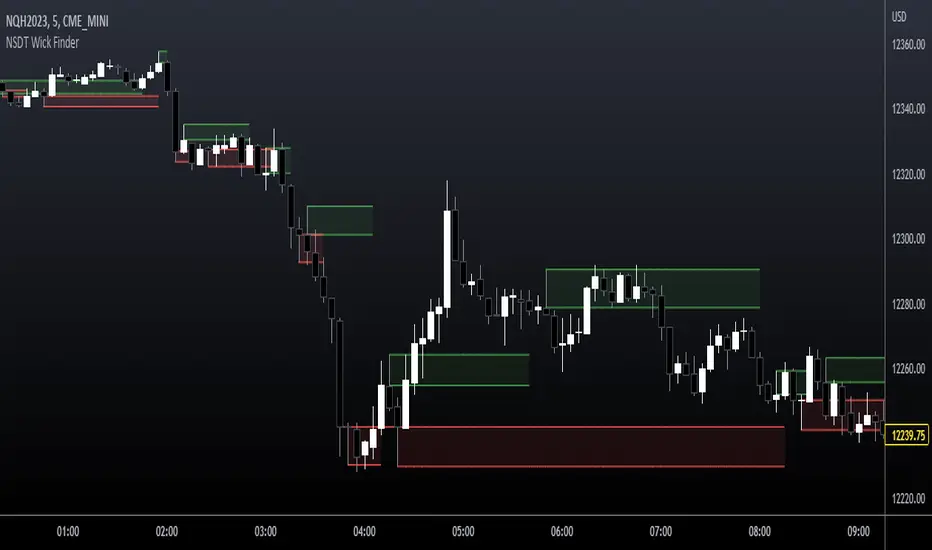
NSDT Wick FinderThis script finds wicks that are longer than the candle body and marks them as potential trading zones to be revisited. Lines, shading, and lookback can all be modified.
Full credit for original code goes to @Squam_Gobaloochee. We updated to Pinescript V5 and cleaned up code. We reached out to original for permission to repost publicly and open source.
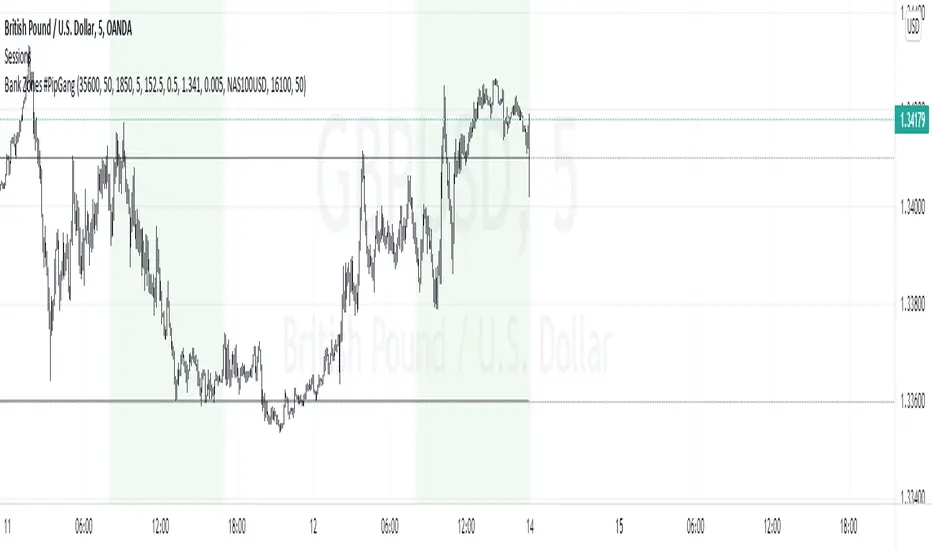
Bank Zones #PipGangHello Traders,
If you trade Forex and Indices this indicator will help you identify Buying and Selling levels that Banks are interested in. These levels are displayed on all time frames. Colors of the lines can be customized.
I also added code to show two EMA's, just uncomment the code to show them. :-)
How to use this indicator.
Show Bank Zones - this will enable/disable horizonal lines on the chart.
Price - enter bank zone price.
Increment By - plots three horizonal lines in pips above and below bank zone price.
Note: Decimal placement is KEY, this may vary by symbol.
Sample Settings:
US30USD
Price 35600.0
IncrementBy 50 (equals 50 pips)
XAUUSD
Price 1850.000
IncrementBy 5 (equals 50 pips)
GBPJPY
Price 152.500
IncrementBy .5 (equals 50 pips)
GBPUSD
Price 1.34100
IncrementBy .005 (equals 50 pips)
Divina - Support and ResistanceGiven the positive feedback received on the first Dynamic Support/Resistance script, I've decided to rewrite it on Pine Script v5 and publish it with open source code.
The main Divina area (box) is derived from change in price and volume, while the other support and resistance levels are based on the golden ratio (Divina proportione) or Fibonacci numbers.
The box will start to paint if the previous closed bar satisfy a condition and it will be never be repainted in the future. Anyway the box and the levels will be extended until a new signal is detected.
The Divina Support and Resistance will help you to find good price zones on wich the market might take trading decision. It is not a strategy by per se, it should be used with other good trading techniques.

Liquidity Levels [LuxAlgo]The Peak Activity Levels indicator displays support and resistance levels from prices accompanied by significant volume. The indicator includes a histogram returning the frequency of closing prices falling between two parallel levels, each bin shows the number of bullish candles within the levels.
1. Settings
Length: Lookback for the detection of volume peaks.
Number Of Levels: Determines the number of levels to display.
Levels Color Mode: Determines how the levels should be colored. "Relative" will color the levels based on their location relative to the current price. "Random" will apply a random color to each level. "Fixed" will use a single color for each level.
Levels Style: Style of the displayed levels. Styles include solid, dashed, and dotted.
1.1 Histogram
Show Histogram: Determines whether to display the histogram or not.
Histogram Window: Lookback period of the histogram calculation.
Bins Colors: Control the color of the histogram bins.
2. Usage
The indicator can be used to display ready-to-use support and resistance. These are constructed from peaks in volume. When a peak occurs, we take the price where this peak occurred and use it as the value for our level.
If one of the levels was previously tested, we can hypothesize that the level might be used as support/resistance in the future. Additional analysis using volume can be done in order to confirm a potential bounce.
The histogram can return various information to the user. It can show if the price stayed within two levels for a long time and if the price within two levels was mostly made of bullish or bearish candles.
In the chart above, we can see that over the most recent 200 bars (determined by Histogram Window) 68 closing prices fall between levels A and B, with 27 bars being bullish.
Additionally, the width of a bin and its length can sometimes give information about the volatility of a specific price variation. If a bin is very wide but short (a low number of closing prices fallen within the levels) then we can conclude a most of the movement was done on a short amount of time.

Alchemist Capital Lazy ZonesAlchemist Capital Lazy Zones is a script written to complement the trading style taught by @clover_trading - Chris teaches a zone to zone strategy and this script aids in the technical analysis relating to this.
This indicator has been tested and coded with Forex pairs in mind, as such its functionality and usefulness on other assets cannot be guaranteed.
The best way to use this script is to load it fresh on your chart/given pair, make the adjustment to the initial user/price level for that given pair. The indicator will then draw your lazy zones from this initial price point, showing the levels that have been ticked within the input tab. Use the key levels and zones printed as a template to manually markup your chart. It is important that before switching to another pair you hide the indicator from view, load the new chart and adjust the initial user/price level for this chart before unhiding the indicator and redrawing the key levels and zones. The reason for this is that not doing so can sometimes cause zoom issues as the new chart loads with Auto-zoom enabled as standard and will carry over the user/price level from the previous chart.

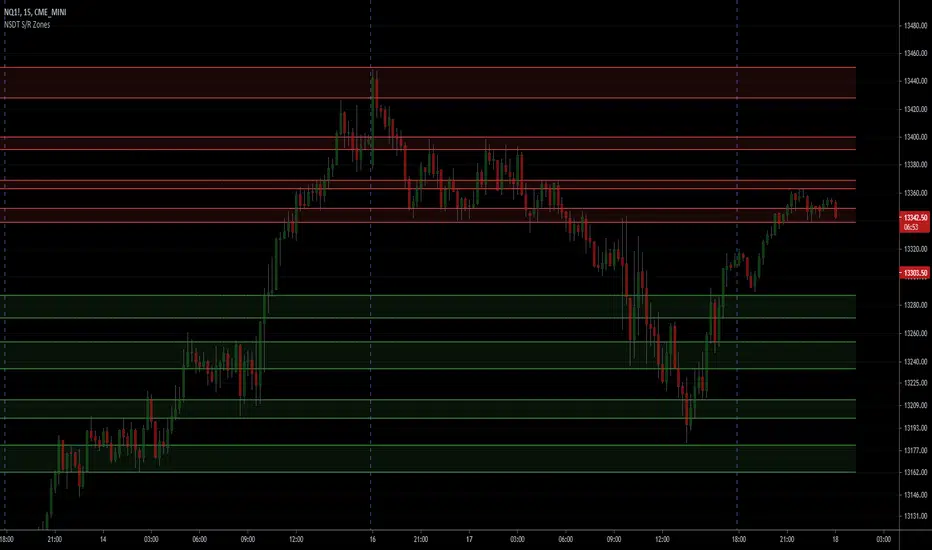
NSDT Support/Resistance ZonesA simple script that allows you to plot 8 different zones of support and resistance. Enter the high and low of a support/resistance zone, and the script will fill the range for easier viewing. Open source and all settings can be customized.
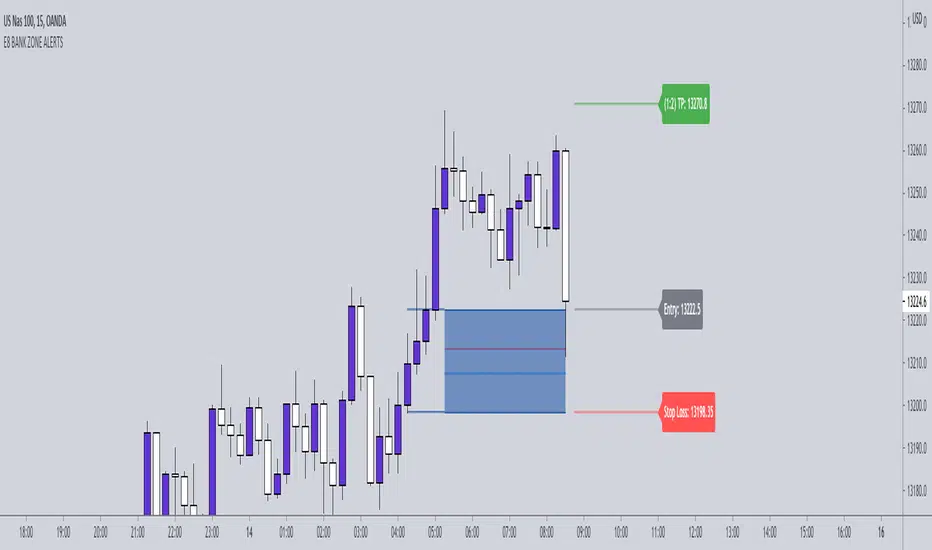
E8-BANK ZONES 4.0 THE E8- BANK ZONES will highlight the most accurate zones the market has to offer.
SETTINGS:
Remove uncheck CHARS - this feature simply places a star on high momentum candles to help identify strong momentum bullish and bearish candles.
INPUT:
You have the ability to choose which zones to display. Our recommendation is to activate continuation zones when price is trending and reversal zones when price is at key level/ strong support and resistance areas.
CONTINUATION ZONES
REVERSAL ZONES
FLIP ZONES
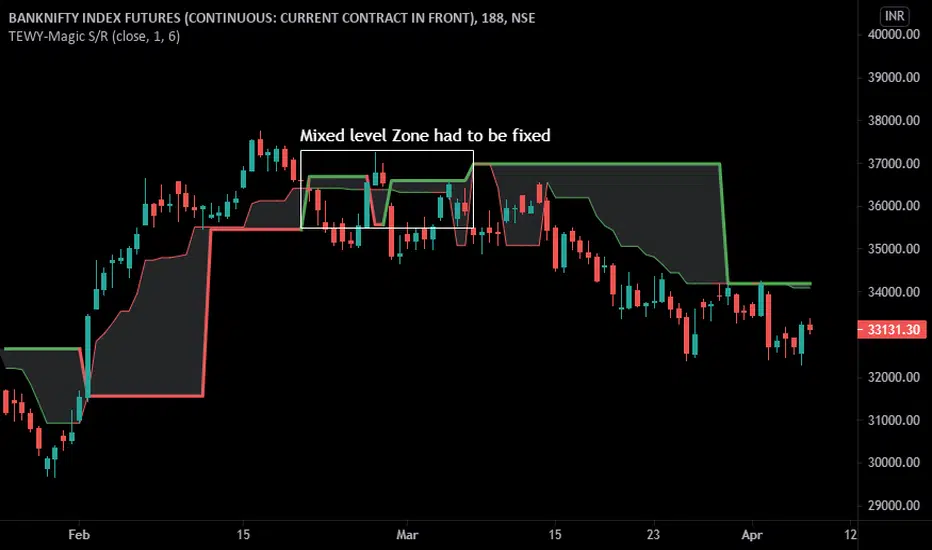
TEWY - Magic Support/Resistance1. This Indicator is used to identify the short-term and longer-term Support/Resistance levels.
2. Please try to keep base inputs as provided though it gives you the opportunity to change ticket price source and length as per your convenience.
3. With default settings:
a. The thick Red line is identified as Longer timeframe support
b. The thin Red line is identified as short timeframe support
c. The thick Green Line is identified as Longer timeframe resistance
d. The thick Green line is identified as short timeframe resistance
e. As per this indicator Gray area is where one can avoided taking a position or exit the existing positions if the candle's low or high Brocken which is closing in gray area as per the trade direction
Calculation Logic Used:
1. I calculated an average of 1-20 ROC average and checked price is above the it
2. I calculated 2 ATR based on 20 period to get the nearest support
3. If price is above both of above then plotted longer-term support based on ATR and shorter-term support based on ROC average.
One can use this indicator on any timeframe, though I created to see charts at a monthly and quarterly level to see for the investment opportunity.
Always respect RISKS and follow stoploss.
Let's understand how to take a position using this indicator
Thin Line = Shorter Time frame
Thick Line = Longer Time frame
Long position:-
1. Wait for the Candle to close above the Thin and Thick lines
2. Please make sure the close is firm above both of these lines.
3. Then enter long with stoploss below the Thick line.
4. Keep trailing stoploss with the thin line, so when the candle closes below thin line keep stoploss below low of that candle.
Short Position:-
1. Wait for the Candle to close below the Thin and Thick lines
2. Please make sure the close is firm below both of these lines.
3. Then enter short with stoploss above the Thick line.
4. Keep trailing stoploss with the thin line, so when the candle closes above the thin line, then keep stoploss above high of that candle.
I have given a sample illustrational image below, which should help you understand this indicator
Best of luck
NSDT Pivot ZonesThis is a new take on Traditional Pivot Points. By modifying the calculations, we were able to create "pivot zones" with a decent degree of accuracy.

SwissKnife DAX ZZBScript dedicated for Dax and listing all zones manually chosen and defined based on Dax observation. Script also allows to define offset that automatically recalculates zones, as original levels are valid for Futures Dax Contract. Levels of 14k and 13k are covered. Enjoy!

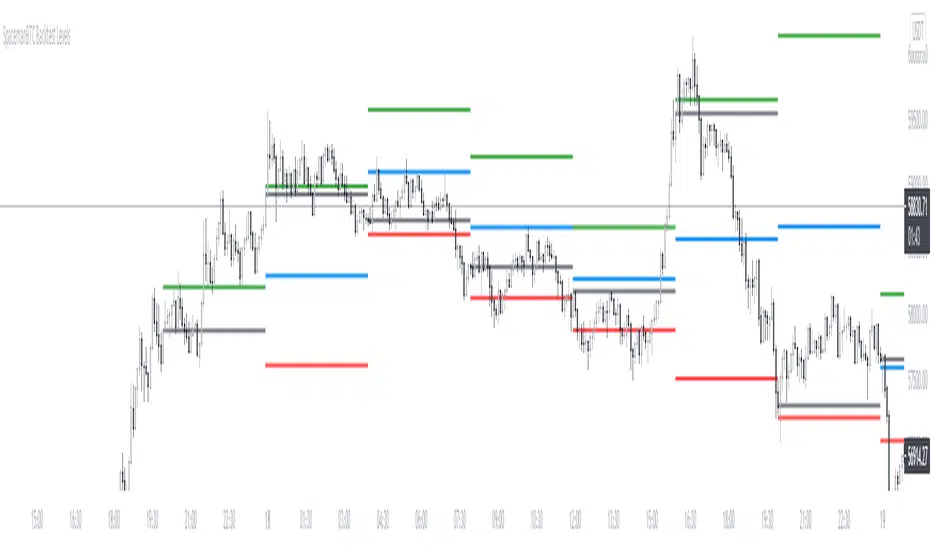
Key Levels CustomTF + Backtest: SpacemanBTCKey Levels Backtest, same logic as the key levels script, provide levels based:
High, Low, Mid and Close.
This was requested, took a long time to post as I fell sick and was given a lot of Dev Work.
Hope this helps those who use it, very useful to see liquidity grabs in my opinion.
Input time in minutes!
Result of a user request.
Impact Zones - Skylyne InvestingWhat is the Impact Zone system:
The creation of Impact Zones started with our love for trading the Bond Market. Impact Zones were originally specifically tailored for the Bond market and now have been mastered to capture most of the Asset Classes out in the market today (Please look at Impact Zone Settings section for asset classes covered by this script). The Impact Zone system is a zone break (or market level break) following system with specific take profit points already established for you on the open of the market day (depending on your asset timing will vary).
*This script was designed for Intraday Trading, Long term or Swing Trading is not recommended with this system
The script will create buy and sell signals on the break of the Impact Zones when specific criteria is met along with the break of the zone. You do not have to use only our signals provided, you can also create your own trading rules based on our script.
Items to highlight:
Skylyne Upper Zone: Green Zone
Skylyne Middle: Yellow Line
Skylyne Lower Zone: Red Zone
Skylyne Take Profit Lines: Purple Lines
Skylyne Average: Orange Line (dynamic support/resistance)
Skylyne Overnight Session: Dark Blue (No Trade Zones)
Skylyne Signals: Buy / Sell
You can think of the Upper Zone as a bull zone and Lower zone as a bear zone, when price enters these zones we want to start watching price action to determine direction the market will take on the break or specified zone, whether it be a break and reversal or a break and run. This can be confirmed with either our signals (buy & sell) or the use of the dynamic support and resistance line (Skylyne Average).
Our script is written to capture market zones and place then on your screen with ease, we also have programmed in specific take profits and stop loss levels we have found the market respects on the intraday trading based on the Impact Zone captured.
The Impact Zones and Take Profit Levels change at Market open everyday. The levels provided will stay on your chart until the next Market open where the Impact Zones and Levels will change to accommodate that trading Day.
We recommend only using that trading days levels, however; using past levels can help trades depending on the case
The three Trades we want to highlight are:
1. Break of Impact Zones
a. This trade is taken when a break of the impact zone happens either in the positive or negative direction and traded to the next zone or take profit line (stop losses can be set with zones or the dynamic skylyne average crossovers)
2. Break of Skylyne Average
a. This trade is taken when price action confirms a bullish or bearish bias on the break of the average line (we would close this trade on the reverse break of the Skylyne Average using the zones as targets)
3. Break of the Skylyne Mid:
a. This trade is taken when a break of the Skylyne Mid level occurs and we use the upper and lower bounds of the Impact Zones as take profit and stop losses
Impact Zone Settings:
*Trading Category and Overnight Category must match the Asset Class being viewed on chart for accurate signals
1. Trading Category
a. Bonds
b. Corn/Wheat
c. Stocks
d. Index Futures
e. Euro/Dollar
f. Gold/Silver
2. Overnight Category
a. Bonds
b. Corn/Wheat
c. Stocks
d. Index Futures
e. Euro/Dollar
f. Gold/Silver
3. Chart Aggregation Limit (Default Value is 25 minutes)
Impact Zone Overnight Trading:
Impact Zone Overnight sessions are highlighted in a dark blue color and we use these highlighted time sessions as a NO TRADE session. Our system was built to be traded during normal market trading hours and overnight sessions tend to be less predictive in terms of direction and or zone reliance. If you choose to trade overnight sessions with Impact Zones, make sure you make a very in depth trading plan and stick to the rules set for yourself.
Impact Zone Signals:
1. Signals for buy or sell of the asset class happen on breaks of the Impact Zones, and when specific criteria are met that we determined necessary to evaluate the overall trend of the market
2. Not every break of the Impact Zones will trigger a signal
3. No signal will be generated during overnight sessions, we recommend studying overnight sessions before beginning to create your own overnight trading session plans based on Impact Zones
4. When a signal is generated you will use the next take profit line (purple line) in the direction of your trade you are in. Other trading signals were discussed above
5. If while you are in a trade and the skylyne average (orange line) is broke in the opposite direction of your trade you will take this as a dynamic stop, and in some cases a dynamic take profit
Impact Zone Charting Timeframes:
1. Recommendation of using the 1 minute chart aggregation bars to maximize profits and limit losses
2. The script has a default charting aggregation limit of 25 minutes, adjustments to the input (in the settings) to increase the aggregation limit need to be made in order to use higher than 25 minute timeframes
Charting Example:
First note is to notice how our publish example uses the 1-minute timeframe aggregation, this is because our script was written to maximize profit on the 1 minute time frame. The script can be used on any time frame, however; make sure that you increase the aggregation limit input when using timeframes above 25 minutes.
From the chart included in the script post, you can notice that buy and sell signals happen only when specified criteria is met, and not every time there is a crossover of the Impact Zones there is a signal. You do not only have to trade the buy and sell signals that our system provides, however; our team believes that these signals are one of the best ways to trade the Impact Zone script. If you deviate from only using signals provided and choose to use the Impact Zones differently, we recommend using the next level, or zone, in the direction of your trade as your take profit (As described in trade we want to highlight section)

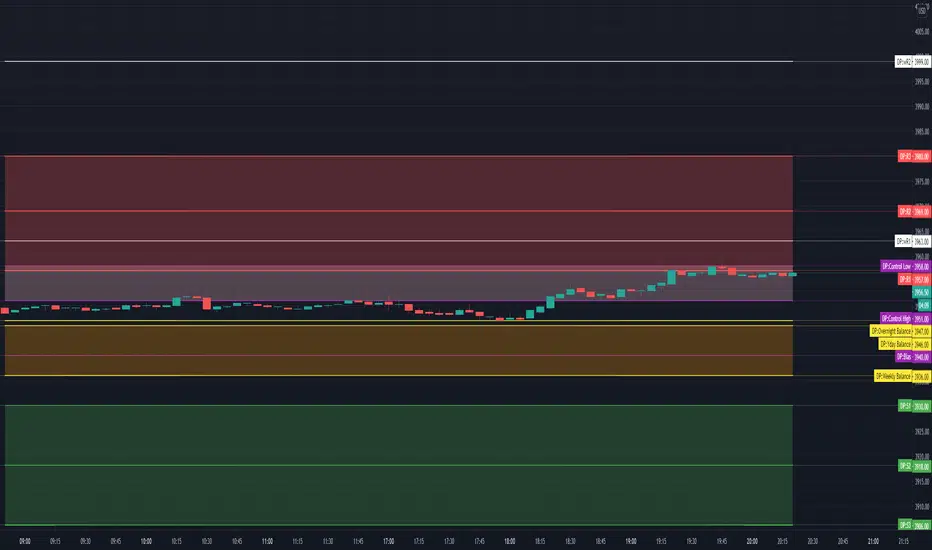
TV Day Plan Template 1This is a template for daytraders, swing traders, supply and demand traders, and even swing traders. As traders we are always scanning charts for levels and zones. This template makes it easy and convenient to find, change, and chart levels. As a daytrader, I will use this daily. I always have daily and weekly targets in mind. This will ensure I don't lose track of the bigger picture while trading the smaller moves. Levels in this chart are not auto calculated. They are manually input. This script is a quick and convenient way to chart multiple levels without having to go through each drawing, change the settings, and then redraw the level. Currently this will only save levels for one ticker. A workaround is to use multiple instances and then hide the ones not in use. Another way is to use the second part to this script, Day Plan Levels Template 2. If only using one instance, you can save the levels as default. This will save them. However, if saving levels as default while using multiple instances of this indicator, the other levels will erase. The way that I use this that I have daily levels for #ES in one instance and then daily levels for #NQ in another instance.
This script is very customizable
Options include
On/Off Toggles
Light/Heavy Versions - Light versions does not plot. Heavy version will plot and show levels in info bar and price axis
Balance Levels
Control Levels
3 Support and 3 Resistance levels for daily and weekly
2 Support and 2 Resistance Clouds
Balance and Control Clouds
"0" value disables and hides levels
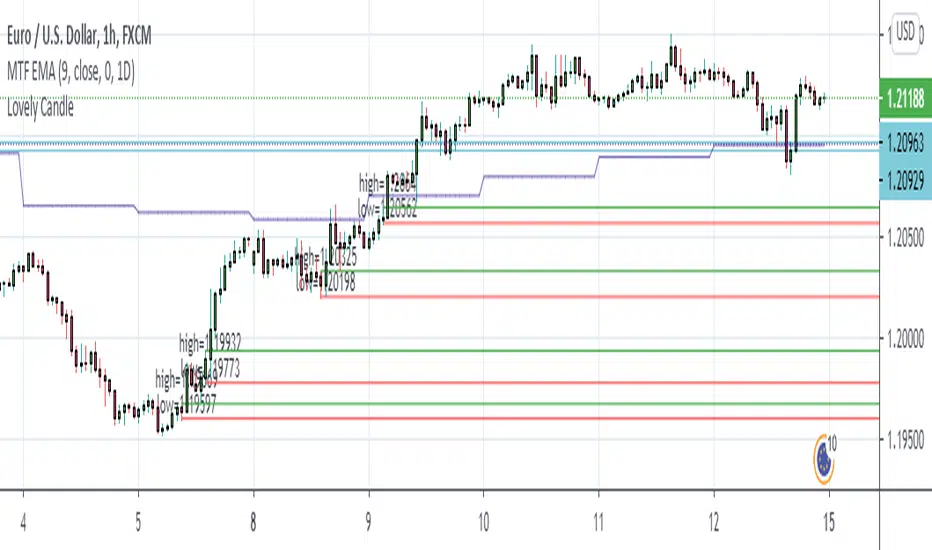
Lovely CandleThis is my Simple Project to make me confidence to take an entry
I always use it in H1 Chart
Add other Indicator like Multi Timeframe EMA Length 9 on 1 Day Period
Just set the sell limit or buy limit to the Lovely candle Zone that touch the EMA 9. Set RR to 1:3 minimum. don't forget to set BEP.