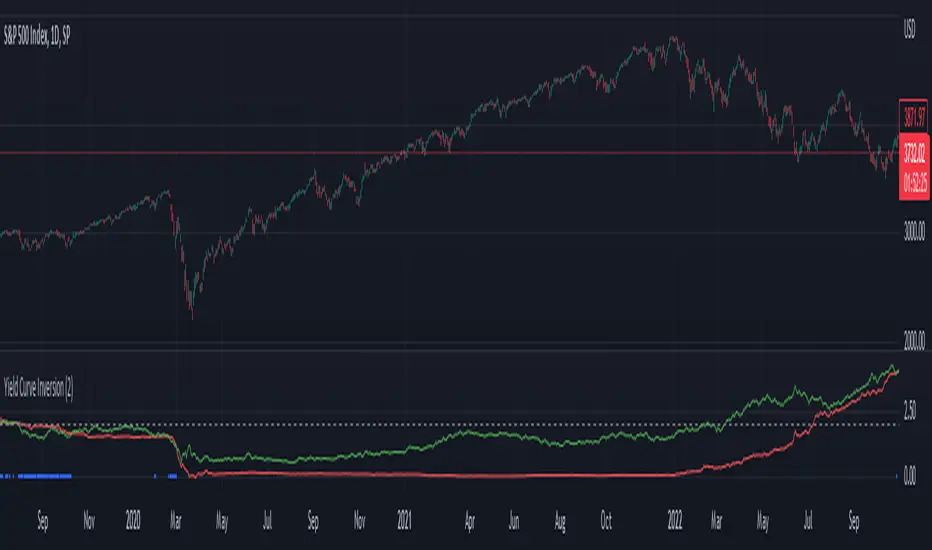
Yield Curve Inversion Indicator Will track the TVC:US10Y and TVC:US03MY spread, often followed for the "yield curve inversion" trade/indicator.
When an inversion occurs, which lasts a minimum of the defined days (default 10) the indicator will paint forward a warning period (default is 365 days).
The yield curve being inverted is not the signal, the REVERSION back to a positive curve is the associated signal, namely the following 12 months after a reversion. This is often used as an early warning of trouble in markets.
Hope this helpful for those who follow macro/internal warning signals.
Yieldcurve

Macro Return ForecastWhen the macro environment was similar, what annualized return did the market usually deliver next?
Before using the indicator, make sure your chart is set to any US-market symbol (SPX, QQQ, DIA, etc.).
This requirement is simple: the indicator pulls macro series from US data (yields, TIPS, credit spreads, breadth of US indices).
Because these series are independent from the chart’s price series, the chart symbol itself does not affect the internal calculations.
Any US symbol works, and the output of the model will be identical as long as you are on a US asset with daily, weekly or monthly timeframe.
The plotted price does not matter: the macro engine is fully exogenous to the chart symbol.
1. What the indicator does relative to selected assets
In the settings you choose which market you want to analyze:
- S&P500
- Nasdaq or NQ100
- Dow Jones
- Russell 2000
- US-wide (VTI)
- S&P500 sectors (XLF, XLY, XLP, etc.)
For each one, the indicator loads:
- Its internal breadth series (percentage of constituents above MA200)
- Its price history to compute forward log-returns at multiple horizons
- Its regime position relative to its own MA200 (for bull/bear filtering)
This means the tool is not tied to the chart symbol you display.
If your chart is SPX but the indicator setting is “S&P500 Technology”, the expected return projection is computed for the Technology sector using its own data, not the chart’s data.
You can therefore:
- Visualize macro-driven expected returns for any major US index or sector.
- Compare how different parts of the market historically reacted to similar macro states.
- Switch assets instantly to see which segment historically behaved better in comparable macro conditions.
The indicator becomes an analyzer of macro sensitivity, not a chart-dependent indicator.
2. Method overview
The model answers a statistical question:
“When macro conditions looked like they do today, what forward annualized return did this asset usually deliver?”
To do this it combines four macro pillars:
- Market breadth of the selected asset
- Yield curve slope (US 10Y minus 2Y)
- US credit spread (high yield minus gov)
- US real rate (TIPS 10Y)
It normalizes each metric into a 0–100 score, groups similar historical states into bins, and examines what the asset did next across six horizons (from ~9 months to ~5 years).
This produces a historical map connecting macro states to realized forward returns.
It is not a forecast model.
It is a conditional-distribution estimator: it tells you what has historically happened from similar setups.
3. Why this produces useful insights on assets
For any chosen asset (SPX, Nasdaq, sectors…), the indicator computes:
- Its forward return distribution in similar macro states.
- How often these states occurred (n).
- Whether the macro environment that preceded positive returns in the past resembles today’s.
- Whether the asset tends to be more sensitive or more resilient than the broad index under given macro configurations.
- Whether a given sector historically benefited from specific yield-curve, credit or real-rate environments.
This lets you answer questions such as:
- Does this sector usually outperform in an inverted yield curve environment?
- Does the Nasdaq historically recover strongly after breadth collapses?
- How did the S&P500 behave historically when real rates were this high?
- Is today’s credit-spread environment typically associated with positive or negative forward returns for this index?
These insights are not predictions but statistical context backed by past market behavior.
4. Why the technique is robust (and why it matters)
The engine uses strict, non-optimistic data processing:
- Winsorization of returns to neutralize extreme outliers without deleting information.
- Shrinkage estimators to avoid overfitting when bins contain few occurrences.
- Adaptive or static bounds for scaling macro indicators, ensuring comparability across cycles.
- Inverse-variance weighting of horizons with penalties for horizon redundancy.
- HAC-style adjustments to reduce autocorrelation bias in return estimation.
Each method aims to prevent artificial inflation of expected-return values and to keep the estimator stable even in unusual macro states.
This produces a result that is not “optimistic”, not curve-fit, not dependent on chart tricks, and not sensitive to isolated historical anomalies.
5. What you get as a user
A single clean line:
Expected Annual Return (%)
This line reflects how the chosen asset historically performed after macro environments similar to today’s.
The color gradient and confidence indicator (n) show the density of comparable episodes in history.
This makes the output extremely simple to read:
- High, stable expectation: historically supportive macro environment.
- Low or negative expectation: historically weaker environments.
- Low confidence: the macro state is rare and historical comparisons are limited.
The tool therefore adds context, not signals.
It helps you understand the environment the asset is currently in, based on how markets behaved in similar conditions across US market history.

Recession Warning Model [BackQuant]Recession Warning Model
Overview
The Recession Warning Model (RWM) is a Pine Script® indicator designed to estimate the probability of an economic recession by integrating multiple macroeconomic, market sentiment, and labor market indicators. It combines over a dozen data series into a transparent, adaptive, and actionable tool for traders, portfolio managers, and researchers. The model provides customizable complexity levels, display modes, and data processing options to accommodate various analytical requirements while ensuring robustness through dynamic weighting and regime-aware adjustments.
Purpose
The RWM fulfills the need for a concise yet comprehensive tool to monitor recession risk. Unlike approaches relying on a single metric, such as yield-curve inversion, or extensive economic reports, it consolidates multiple data sources into a single probability output. The model identifies active indicators, their confidence levels, and the current economic regime, enabling users to anticipate downturns and adjust strategies accordingly.
Core Features
- Indicator Families : Incorporates 13 indicators across five categories: Yield, Labor, Sentiment, Production, and Financial Stress.
- Dynamic Weighting : Adjusts indicator weights based on recent predictive accuracy, constrained within user-defined boundaries.
- Leading and Coincident Split : Separates early-warning (leading) and confirmatory (coincident) signals, with adjustable weighting (default 60/40 mix).
- Economic Regime Sensitivity : Modulates output sensitivity based on market conditions (Expansion, Late-Cycle, Stress, Crisis), using a composite of VIX, yield-curve, financial conditions, and credit spreads.
- Display Options : Supports four modes—Probability (0-100%), Binary (four risk bins), Lead/Coincident, and Ensemble (blended probability).
- Confidence Intervals : Reflects model stability, widening during high volatility or conflicting signals.
- Alerts : Configurable thresholds (Watch, Caution, Warning, Alert) with persistence filters to minimize false signals.
- Data Export : Enables CSV output for probabilities, signals, and regimes, facilitating external analysis in Python or R.
Model Complexity Levels
Users can select from four tiers to balance simplicity and depth:
1. Essential : Focuses on three core indicators—yield-curve spread, jobless claims, and unemployment change—for minimalistic monitoring.
2. Standard : Expands to nine indicators, adding consumer confidence, PMI, VIX, S&P 500 trend, money supply vs. GDP, and the Sahm Rule.
3. Professional : Includes all 13 indicators, incorporating financial conditions, credit spreads, JOLTS vacancies, and wage growth.
4. Research : Unlocks all indicators plus experimental settings for advanced users.
Key Indicators
Below is a summary of the 13 indicators, their data sources, and economic significance:
- Yield-Curve Spread : Difference between 10-year and 3-month Treasury yields. Negative spreads signal banking sector stress.
- Jobless Claims : Four-week moving average of unemployment claims. Sustained increases indicate rising layoffs.
- Unemployment Change : Three-month change in unemployment rate. Sharp rises often precede recessions.
- Sahm Rule : Triggers when unemployment rises 0.5% above its 12-month low, a reliable recession indicator.
- Consumer Confidence : University of Michigan survey. Declines reflect household pessimism, impacting spending.
- PMI : Purchasing Managers’ Index. Values below 50 indicate manufacturing contraction.
- VIX : CBOE Volatility Index. Elevated levels suggest market anticipation of economic distress.
- S&P 500 Growth : Weekly moving average trend. Declines reduce wealth effects, curbing consumption.
- M2 + GDP Trend : Monitors money supply and real GDP. Simultaneous declines signal credit contraction.
- NFCI : Chicago Fed’s National Financial Conditions Index. Positive values indicate tighter conditions.
- Credit Spreads : Proxy for corporate bond spreads using 10-year vs. 2-year Treasury yields. Widening spreads reflect stress.
- JOLTS Vacancies : Job openings data. Significant drops precede hiring slowdowns.
- Wage Growth : Year-over-year change in average hourly earnings. Late-cycle spikes often signal economic overheating.
Data Processing
- Rate of Change (ROC) : Optionally applied to capture momentum in data series (default: 21-bar period).
- Z-Score Normalization : Standardizes indicators to a common scale (default: 252-bar lookback).
- Smoothing : Applies a short moving average to final signals (default: 5-bar period) to reduce noise.
- Binary Signals : Generated for each indicator (e.g., yield-curve inverted or PMI below 50) based on thresholds or Z-score deviations.
Probability Calculation
1. Each indicator’s binary signal is weighted according to user settings or dynamic performance.
2. Weights are normalized to sum to 100% across active indicators.
3. Leading and coincident signals are aggregated separately (if split mode is enabled) and combined using the specified mix.
4. The probability is adjusted by a regime multiplier, amplifying risk during Stress or Crisis regimes.
5. Optional smoothing ensures stable outputs.
Display and Visualization
- Probability Mode : Plots a continuous 0-100% recession probability with color gradients and confidence bands.
- Binary Mode : Categorizes risk into four levels (Minimal, Watch, Caution, Alert) for simplified dashboards.
- Lead/Coincident Mode : Displays leading and coincident probabilities separately to track signal divergence.
- Ensemble Mode : Averages traditional and split probabilities for a balanced view.
- Regime Background : Color-coded overlays (green for Expansion, orange for Late-Cycle, amber for Stress, red for Crisis).
- Analytics Table : Optional dashboard showing probability, confidence, regime, and top indicator statuses.
Practical Applications
- Asset Allocation : Adjust equity or bond exposures based on sustained probability increases.
- Risk Management : Hedge portfolios with VIX futures or options during regime shifts to Stress or Crisis.
- Sector Rotation : Shift toward defensive sectors when coincident signals rise above 50%.
- Trading Filters : Disable short-term strategies during high-risk regimes.
- Event Timing : Scale positions ahead of high-impact data releases when probability and VIX are elevated.
Configuration Guidelines
- Enable ROC and Z-score for consistent indicator comparison unless raw data is preferred.
- Use dynamic weighting with at least one economic cycle of data for optimal performance.
- Monitor stress composite scores above 80 alongside probabilities above 70 for critical risk signals.
- Adjust adaptation speed (default: 0.1) to 0.2 during Crisis regimes for faster indicator prioritization.
- Combine RWM with complementary tools (e.g., liquidity metrics) for intraday or short-term trading.
Limitations
- Macro indicators lag intraday market moves, making RWM better suited for strategic rather than tactical trading.
- Historical data availability may constrain dynamic weighting on shorter timeframes.
- Model accuracy depends on the quality and timeliness of economic data feeds.
Final Note
The Recession Warning Model provides a disciplined framework for monitoring economic downturn risks. By integrating diverse indicators with transparent weighting and regime-aware adjustments, it empowers users to make informed decisions in portfolio management, risk hedging, or macroeconomic research. Regular review of model outputs alongside market-specific tools ensures its effective application across varying market conditions.

BBS – Bond Breadth Signal"When bonds scream, breadth collapses, and fear spikes — BBS listens."
🧠 BBS – Bond Breadth Signal
A reversal timing tool built on macro conviction, not price noise.
The Bond Breadth Signal (BBS) was developed to identify major market inflection points by combining four key market stress indicators:
1) 10-Year Yield ROC – Measures sharp moves in the bond market
2) Z-Score of the 10Y – Captures statistical extremes
3) NSHF (Net Highs–Lows) – Signals internal market strength or weakness
4) TLT ROC + VIX – Confirmations of flight to safety and volatility-driven fear
When all conditions align, BBS marks either a For-Sure Buy or For-Sure Sell — these are rare, high-confidence signals designed to cut through noise and focus on true market dislocations.
🔧 Features:
-Background color and signal arrows on confirmation days
-Signals remain visually active for 3 days for added clarity
-Fully adjustable thresholds and alert toggles
-Plot panel for yield, TLT, NSHF, VIX, and Z-score visuals
This tool isn’t designed to fire every day. It’s meant to wait for those moments when the market truly bends — not just wiggles.
Best used on major indices (SPY, QQQ, IWM) to assess macro turning points.

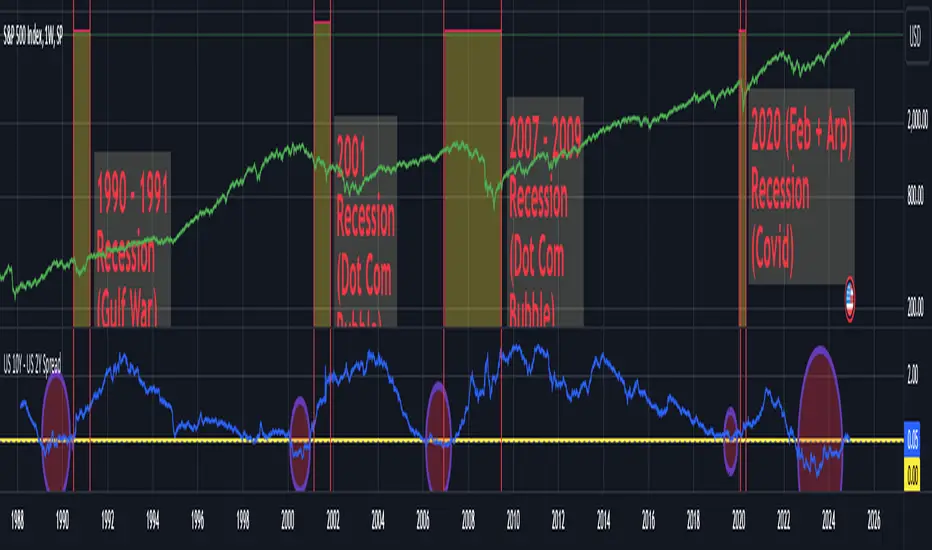
US 10Y - US 2Y Spread This script displays the Yield Spread between the 10 Year US Treasury Bond (US10Y) and the 2 Year US Treasury Bond (US02Y) as a blue line beneath the chart. It is best to be used on weekly charts a the yield spread is a leading indicator used for detecting possible recessions within the US economy.
A negative yield spread means the 2 year treasury bonds are paying a higher yield than 10 year treasury bonds indicating a possible slowdown of the US economy. In the past negative yield spreads where often followed by recessions and major corrections of the S&P500... you can see examples for this on the above chart for the Gulf War recession, the DotCom Bubble recession, the great recession due to the US housing market collapse and the short COVID recession.
Currently we are in an extended phase of negative yield spreads and if history repeats itself we could be in for a major correction on the financial markets within the next years.
Yield Curve InversionThe Yield Curve Inversion indicator is a tool designed to help traders and analysts visualize and interpret the dynamics between the US 10-year and 2-year Treasury yields. This indicator is particularly useful for identifying yield curve inversions, often seen as a precursor to economic recessions.
Features and Interpretations
Display Modes: Choose between "Spread Mode" to visualize the yield spread indicating normal (green) or inverted (red) curves, or "Both Yields Mode" to view both yields.
Yield Spread: A plotted difference between 10-year and 2-year yields, with a zero line marking inversion. A negative spread suggests potential economic downturns.
Color Coding: Green for a normal yield curve (10Y > 2Y) and red for an inverted curve (2Y > 10Y).
Legend: Provides quick reference to yield curve states for easier interpretation.
This indicator is for educational and informational purposes only. It should not be considered financial advice or a recommendation to buy or sell any financial instruments. Users should conduct their own research and consult with a financial advisor before making investment decisions. The creator of this indicator is not responsible for any financial losses incurred through its use.

Yield Curve SpaghettiDisplays the difference in yield between multiple bond pairs for a given country.
Currently supports US, DE, and GB bonds

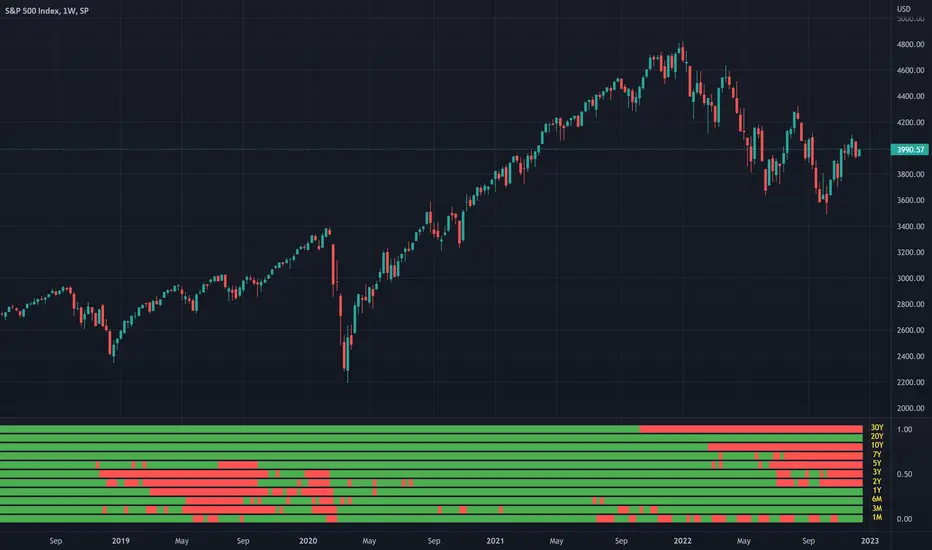
Treasury Yields Heatmap [By MUQWISHI]▋ INTRODUCTION :
The “Treasury Yields Heatmap” generates a dynamic heat map table, showing treasury yield bond values corresponding with dates. In the last column, it presents the status of the yield curve, discerning whether it’s in a normal, flat, or inverted configuration, which determined by using Pearson's linear regression coefficient. This tool is built to offer traders essential insights for effectively tracking bond values and monitoring yield curve status, featuring the flexibility to input a starting period, timeframe, and select from a range of major countries' bond data.
_______________________
▋ OVERVIEW:
______________________
▋ YIELD CURVE:
It is determined through Pearson's linear regression coefficient and considered…
R ≥ 0.7 → Normal
0.7 > R ≥ 0.35 → Slight Normal
0.35 > R > -0.35 → Flat
-0.35 ≥ R > -0.7 → Slight Inverted
-0.7 ≥ R → Inverted
_______________________
▋ INDICATOR SETTINGS:
#Section One: Table Setting
#Section Two: Technical Setting
(1) Country: Select country’s treasury yields data
(2) Timeframe: Time interval.
(3) Fetch By:
(3A) Date: Retrieve data by beginning of date.
(3B) Period: Retrieve data by specifying the number of time series back.
Enjoy. Please let me know if you have any questions.
Thank you.

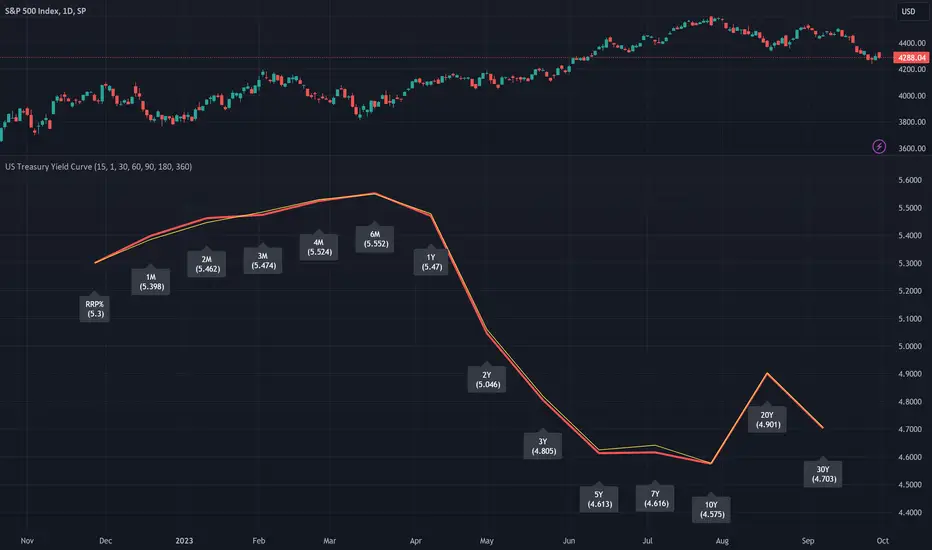
[dharmatech] U.S. Treasury Yield CurveThis indicator displays the U.S. Treasury Securities Yield Curve.
This is a fork of the US Treasury Yield Curve indicator by @longflat. Thank you for sharing your work!
There are already so many yield curve indicators on TradingView.
What makes this one different?
Update to version 5 of Pine Script
Add RRP%
Add 4 month
Add 20 year
Show previous day's yield curve
Options for prior yield curves
The thick red line shows the latest yield curve.
The yellow line shows the yield curve 1 bar ago.
So, if your timeframe is set to 1 day, the yellow line will show yesterday's yield curve.
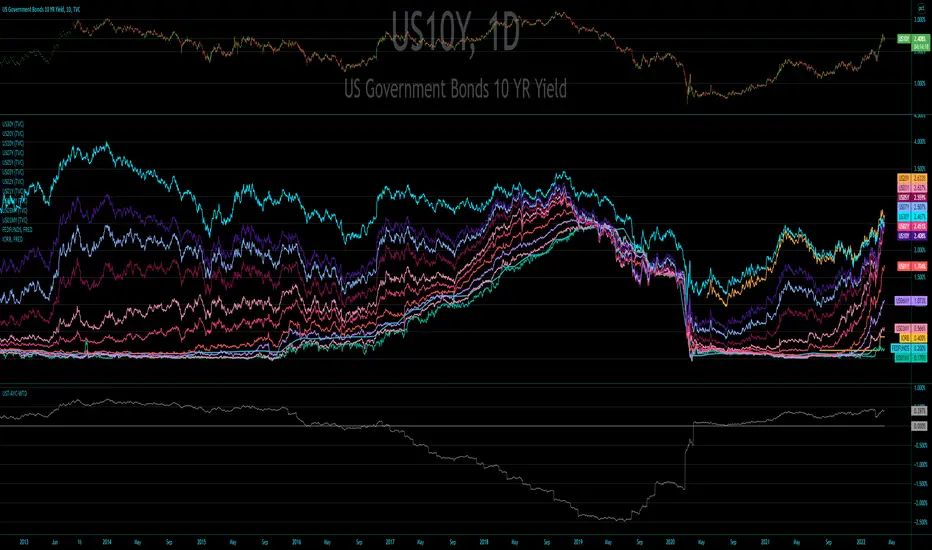
[dharmatech] Area Under Yield Curve : USThis indicator displays the area under the U.S. Treasury Securities yield curve.
If you compare this to SP:SPX , you'll see that there are large periods where they are inversely related. Other times, they track together. When the move together, watch out for the expected and eventual divergence.
By default, this indicator will show up in a separate pane. If you move it to an existing pane (e.g. along side SP:SPX ) you'll need to move it to a different price scale.
The area under the yield curve is a quick way to see if the overall yield curve moved up or down. Generally speaking, increasing yields isn't good for markets, unless there is some other stimulus going on simultaneously.
The following treasury securities are used in this calculation:
FRED:DGS1MO (1 month)
FRED:DGS3MO (3 month)
FRED:DGS6MO (6 month)
FRED:DGS1 (1 year)
FRED:DGS2 (2 year)
FRED:DGS3 (3 year)
FRED:DGS5 (5 year)
FRED:DGS7 (7 year)
FRED:DGS10 (10 year)
FRED:DGS20 (20 year)
FRED:DGS30 (30 year)

US Recession IndicatorThe US Recession Indicator is designed to identify recessions as they happen, using two reputable indicators that have accurately foreseen all past recessions since 1969. Unlike the National Bureau of Economic Research (NBER) which determines recession dates after the fact, this indicator seeks to spot recessions in real-time. When both of these distinct metrics meet certain criteria, the chart's background becomes shaded, signifying a strong likelihood that the economy is in a recession. Furthermore, a built-in alert system keeps users updated without constant monitoring.
The first metric is the Smoothed Recession Probabilities developed by Marcelle Chauvet. It is based on a dynamic-factor markov-switching model that assesses four monthly coincident variables: non-farm payroll employment, the index of industrial production, real personal income excluding transfer payments and real manufacturing and trade sales. It offers a mathematical analysis of how recessions deviate from expansions. In essence, this index mirrors the probability of the prevailing true economic situation being a recession, grounded on the current GDP data.
The second metric is the Sahm Rule Recession Indicator developed by Claudia Sahm. It operates on the principle that changes in the unemployment rate can be used to identify the onset of a recession. According to this rule, if the three-month moving average of the unemployment rate rises by 0.5 percentage points or more above its lowest point from the preceding year, it flags a potential recession.
For this combined indicator, the thresholds are intentionally set lower than when each metric is used individually. Both metrics must simultaneously suggest a potential recession in order to send a signal. This stems from the realisation that neither metric is infallible and has, on occasion, sent false signals in the past. By requiring both to align, the likelihood of a false positive is reduced. However, it's crucial to understand that past performance does not guarantee future results, leaving the door open for potential false alerts which may not be confirmed by the NBER.

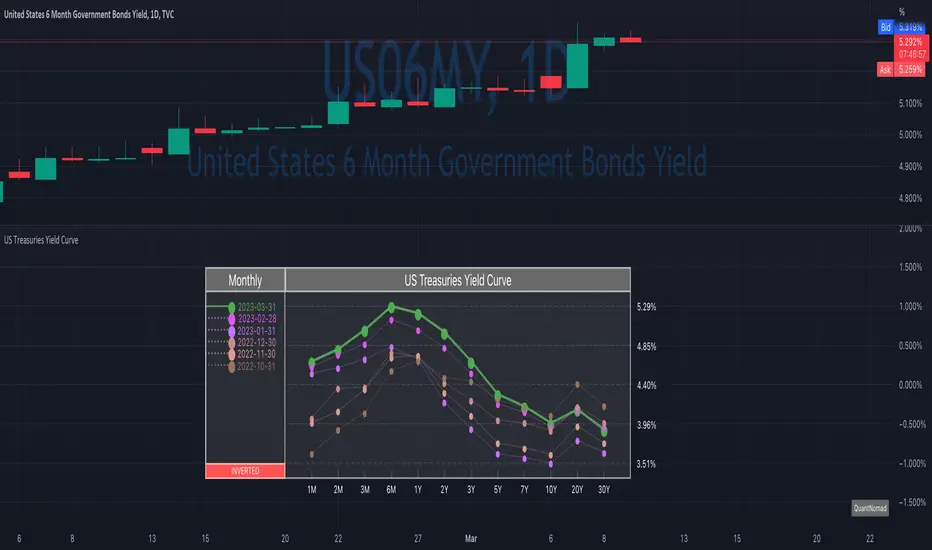
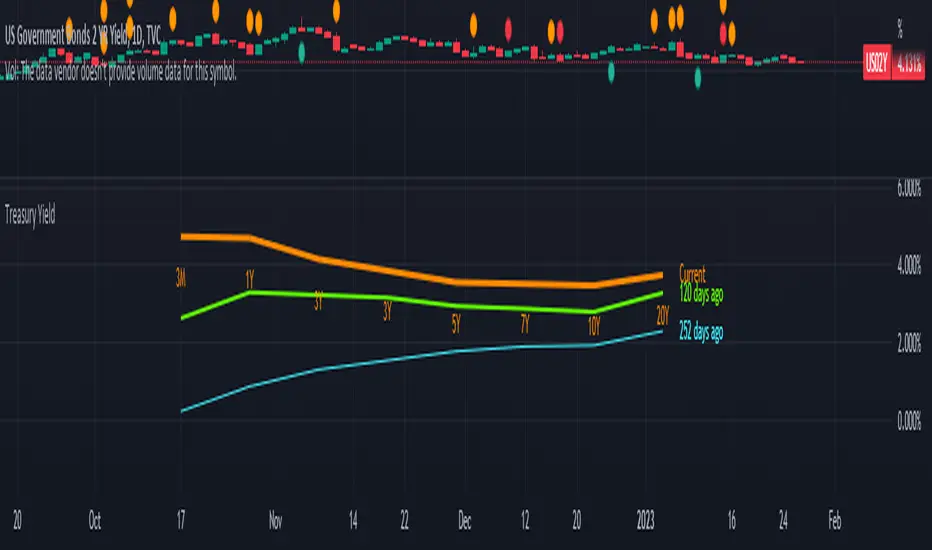
US Treasuries Yield CurveNews about the yield curve became pretty crucial for all the trades in the last year.
So in the team, we decided to implement a nice widget that will allow you to track the current yield curve in your chart directly.
It's possible to compare the current yield curve with past yield curves. You can choose to display the number of curves weeks, months, and years ago. So you can see the dynamics of the yield curve change.
When the Y2 > Y10 curve is considered invested, so you'll see an "Inverted" notification on the chart.
Thanks to @MUQWISHI for helping code it.
Disclaimer
Please remember that past performance may not indicate future results.
Due to various factors, including changing market conditions, the strategy may no longer perform as well as in historical backtesting.
This post and the script don’t provide any financial advice.
Recession Warning Traffic LightThis is an indicator that uses 6 different metrics to determine the combined probability of a recession and compares the high probability warning periods against actual historical periods of recession.
GREEN tells us that the referenced recession indicators are not exhibiting any warning. Observe the long stretches of “all-green” in between recessionary periods in the chart above.
RED will show a full-on warning level for that particular recession indicator, signaling that monitoring of this sector is clearly showing a problem – which has in the past, reliably exhibited itself as a forewarning of recessions.
Adding green and red together can help determine a combined probability of recession.
IMPORTANT: Your chart should be on 1d and set to SPX , DJI ,or NDQ indices
Precious metals: This indicator calculates the relative prices of Gold & rhodium. Gold is a flight-to-quality asset. Rhodium is the rarest of precious industrial metals and prices spike when the economy is heating up. In front of a recession, the upper relative movement of rhodium precedes gold.
Stock markets: This indicator compares closing prices to growth rate curves of the SPX. This indication is the noisiest but tells us very well when the recession has ended. Stock market indices, which respond to “smart money” moving out of markets when the other indicators begin to warn of recession, or when markets become overheated and rise to historically unsustainable levels.
Yield curve: This indicator compares the 3m & 10y treasuries and detects yield curve inversions. Interest rates are controlled by the Federal Reserve and by the purchasers in the Federal Treasury auction markets, which together create the treasury yield curve. This inversion is the most reliable recession indicator. These happen during a flight to quality.
Federal Reserve: This indicator measures GDP and detects contraction which is technically a recession. This is usually one of the last indicators to enter a Warning state, and it could be 6 months delayed simply confirming what may have already been projected.
Money Supply. This indicator measures the M2 money supply, which typically grows about 1% per calendar quarter. When this shrinks, it's tapping the brakes on the economy. This can also lead to yield curve inversion. This is also a measure of inflation and its effects on the aggregate money supply (liquid capital) available for short-term economic activity, or which can be directed into the purchase of long-term, less liquid assets.
Leading Economic factors: There is a whole basket of leading economic indicators that, as collections, reflect overall growth or contraction of economic activity. These indicators include measures of level and growth in productivity, employment, housing, consumer confidence, industrial purchasing confidence, and much more. These indicators may or may not be detached from the broader economy, and often provide up to 6 months of foresight. For more information please visit www.conference-board.org
Actual Recession: Central Bank indicators are published by the Federal Reserve and reflect their own analysis of national and regional economic health, as well as their calculations of the likelihood of a recession. The Federal Reserve has a recession ticker which is used to plot periods of actual recessions on this indicator for comparison.

USTS Yield Curve InversionsVisualization of the inverted portions of the USTS yield curve.
Red means that portion of the curve is inverted.
If 1M is red, it means it's less than RRP%.
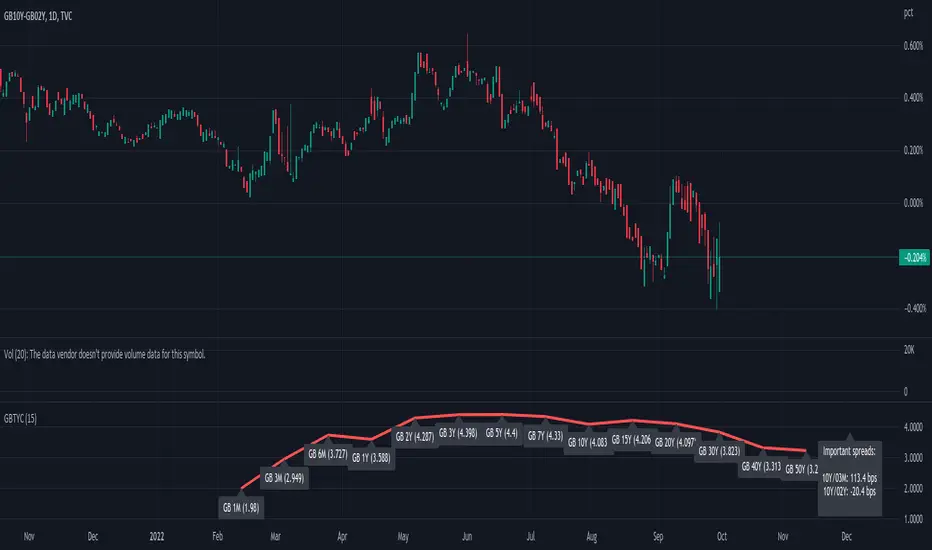
GB Gilt Yield CurveWith thanks to @longfiat whose US Treasury Yield Curve served as the basis for this indicator
This is created very quickly to provide a sense of the GB Gilt Yield curve in light of government induced market dysfunction as a result of an ill-conceived mini-budget.
Note that I omitted GB04Y, GB06Y, GB08Y, GB09Y and GB12Y to avoid overcrowding the chart with excess information and thereby render the indicator more readily usable.
US/CA Bond Yield CurveEasy Viewing of 4 different duration bond yields for US and Canada. Bond prices and bond yields are excellent indicators of the economy as a whole, and of inflation in particular. A bond's yield is the discount rate that can be used to make the present value of all of the bond's cash flows equal to its price. Good as part of a macro set.

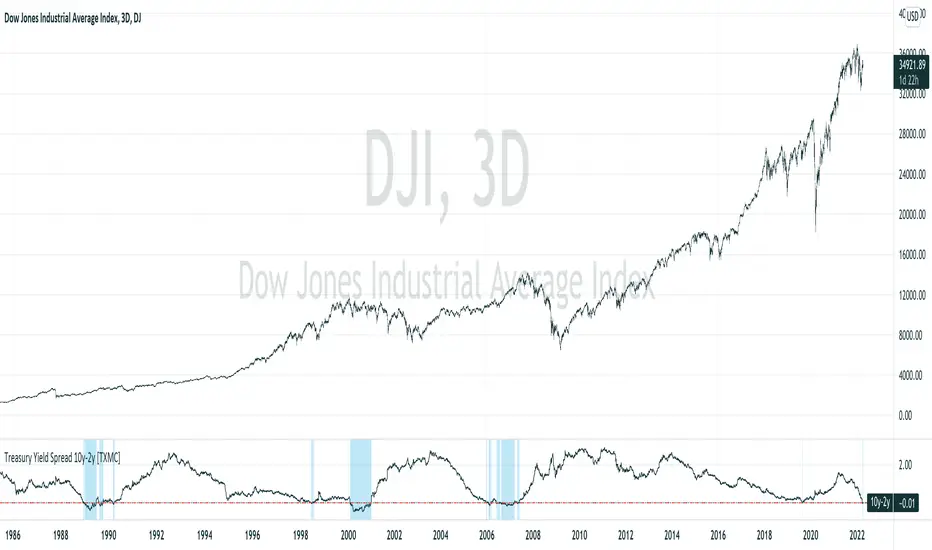
Treasury Yield Spread 10y-2y [TXMC]A simple indicator to show inversions of the US Treasury yield curve, specifically between the 2yr and 10yr yields.
A colored band prints when the 2yr treasury yield surpasses the 10yr, indicating an inversion of the yield curve.
This indicator is for educational purposes only.
US Treasury Constant Maturity SpreadsPlots and tabulates constant maturity treasury yield spreads
// colours per curve type for the plots and table headers
C_30Y_20Y=color.orange
C_10Y_5Y=color.purple
C_10Y_2Y=color.blue
C_7Y_5Y=color.gray
C_5Y_2Y=color.red
C_3Y_2Y=color.yellow
C_10Y_1Y=color.olive

US Treasury All Yield Curve IORB WeightedI've updated my US Treasury All Yield Curve indicator to use the new FRED:IORB (interest on reserve balances), instead of the FRED:FEDFUNDS which is only updated monthly.
The new IORB doesn't provide very long lookback for data, so I'm publishing this as a new version and not an update, making it possible for users to choose which version best suits their needs.

Bond Yeild CurveBond Yeild Curve
A bond yeild curve is a line that plot the interest rate of bonds of each maturity dates.
The slope of the curve give the future of economy cycle.
if the slope could be normal (positive), flat or even inverted.
This indicator aquired data of bond yeild provided by TradingView.
How to use it.
Select the country of the bond / another country to compare.
Select the maturity of bond (this indicator set 2Y, 5Y, 10Y and 20Y as default).
You can toggle to 3 different data set; Yeild, Spread (10Y-2Y) and Yeild Curve.
In case that you select the "Yeild Curve", you can customize the desired past period to compare.
How we can get the benefit.
- If the current spread is greater than 1.0, it suppose that the economy of that country probably is ok.
- if the current spread is between 0 - 1.0, it suppose to be flatted and probably turn to invert and the economy cound be in a recession soon.
- if the current spread is below 0, it suppose to be inverted and economy is in recession.
when knowing the state of economy, it would help us to manage our investment.
When you select "Yeild"
When you select "Spread"
When you select "Yeild Curve"
I'm new for this.
if any idea, correction and suggestion, i do appreciate it.
US Treasury All Yield CurveRather than using one pair of treasuries, this indicator weighs them all in an overlapping fashion, to produce a composite yield curve that indicates the level of stress in the bond market.
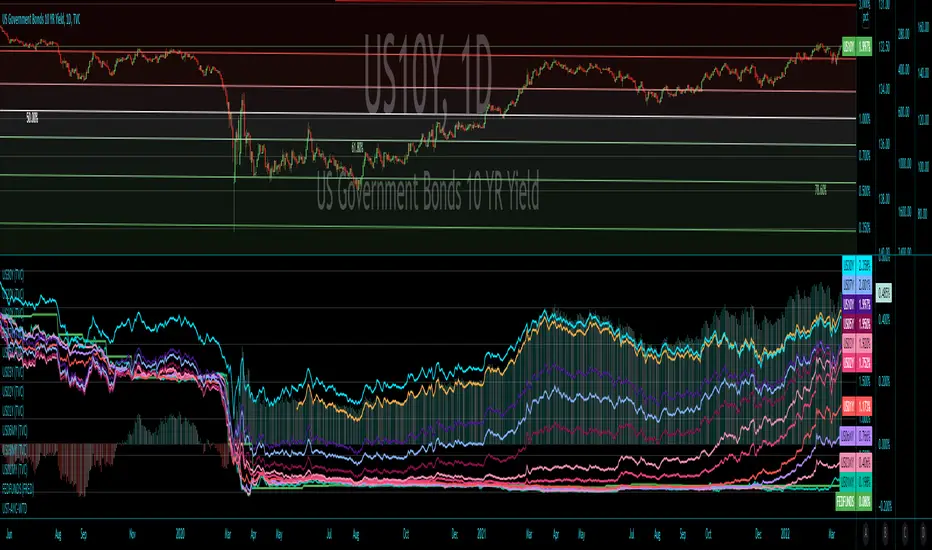
Yield Curve Inversion IndicatorIntroduction
The last time (as of this publishing) that this indicator detected an inverted interest rate yield curve was on February 20th, 2020 at 12:30pm EST, the afternoon before the S&P500 began one of its largest crashes in US history. The vast majority of major economic recessions since the 1950's have been preceded by an interest rate yield curve inversion. I created this indicator originally as an input to study the impacts of more conservative risk management on quantitative trading strategies following a yield curve inversion event. It is being shared with the community as a quick indicator to check to see the comparative status of short term and long term interest rates, and as an indicator where you can easily check to see if we are experiencing an inverted yield curve in real-time.
Background of the significance of an inverted yield curve:
"What an inverted yield curve really means is that most investors believe that short-term interest rates are going to fall sharply at some point in the future. As a practical matter, recessions usually cause interest rates to fall. Historically, inversions of the yield curve have preceded recessions in the U.S. Due to this historical correlation, the yield curve is often seen as a way to predict the turning points of the business cycle. When the yield curve inverts, short-term interest rates become higher than long-term rates. This type of yield curve is the rarest of the three main curve types and is considered to be a predictor of economic recession. Because of the rarity of yield curve inversions, they typically draw attention from all parts of the financial world." (www.investopedia.com)
Settings and Usage
This indicator pulls in pricing data from tickers that represent short term and long term interest rates, and compares them. The red line represents short term interest rates, and the green line represents long term interest rates. When the red line is above the green line, it indicates that we are experiencing a yield curve inversion. Small blue crosses also appear on the bottom of the indicator during an inversion to further highlight the event visually. This indicator pulls in the same information on the same two interest rate tickers regardless of what chart it is applied to.
Other Thoughts
This script uses the f_secureSecurity function as a best practice. For those that are versed in PineScript, code from this indicator could be adapted to be applied to an interest rate chart that allows custom alerts to be created the moment that there is an inverted interest rate yield curve.
US Treasury All Yield Curve FEDFUNDS WeightedRather than picking a benchmark pair of treasuries to express a yield curve, this indicator weighs all (excluding the new 20 Year) durations, each against the next, and weights that against the FEDFUNDS rate.