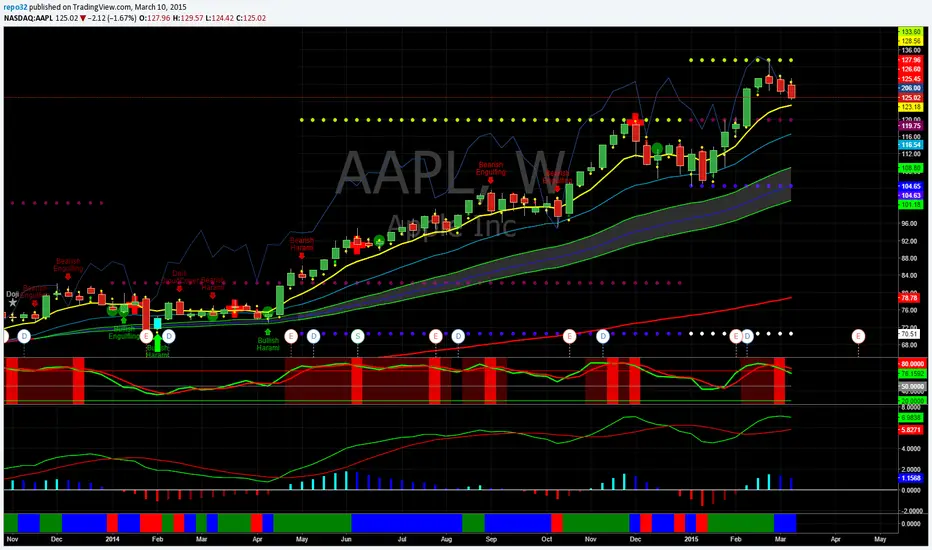
High Low Yearly Support ResistanceDecided to repost to get clean chart up. This gives you lines showing the current years highs and lows along with the previous years high and lows.
Requested by "N"
Yearly

High Low YearlySorry for the mess above. Not sure how to remove it. It was not what I was looking to post. I added the the clean chart below.
This was requested by "N". It displays the current yearly highs and lows along with the previous years highs and lows. Just a nice way to see the support resistance in all time frames.