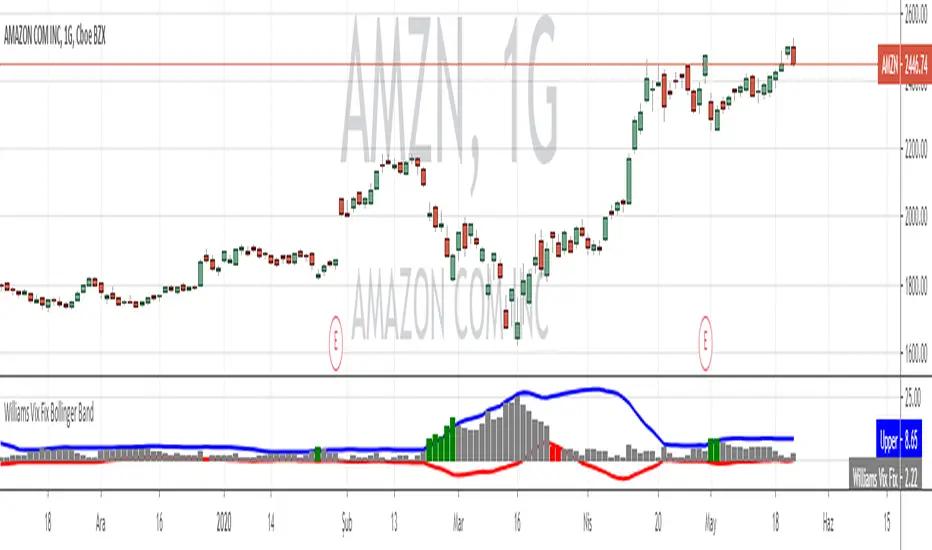
Williams Vix Fix paired with Supertrend HeatmapThis script shows my mod of the powerful Williams' Vix Fix indicator paired with a modified Supertrend Heatmap, originally created by Daveatt.
Williams %R (%R)

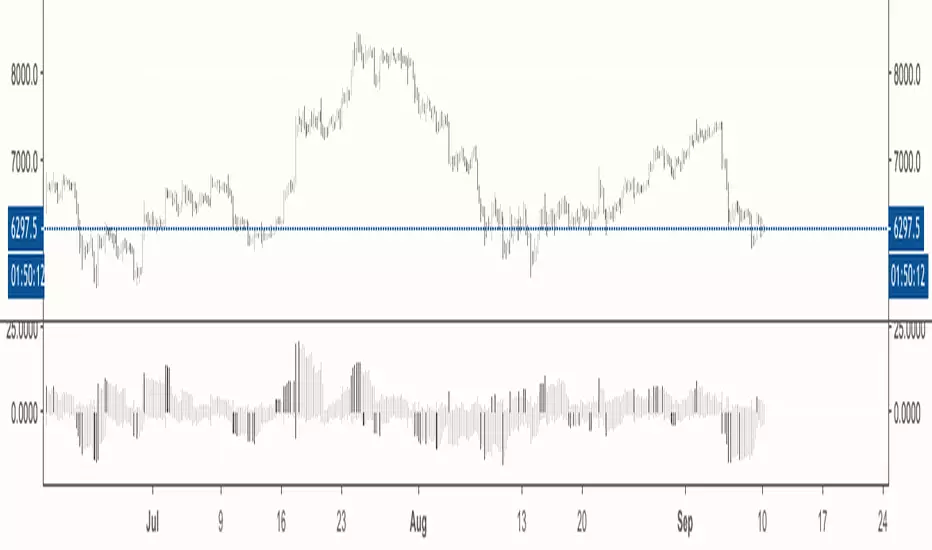
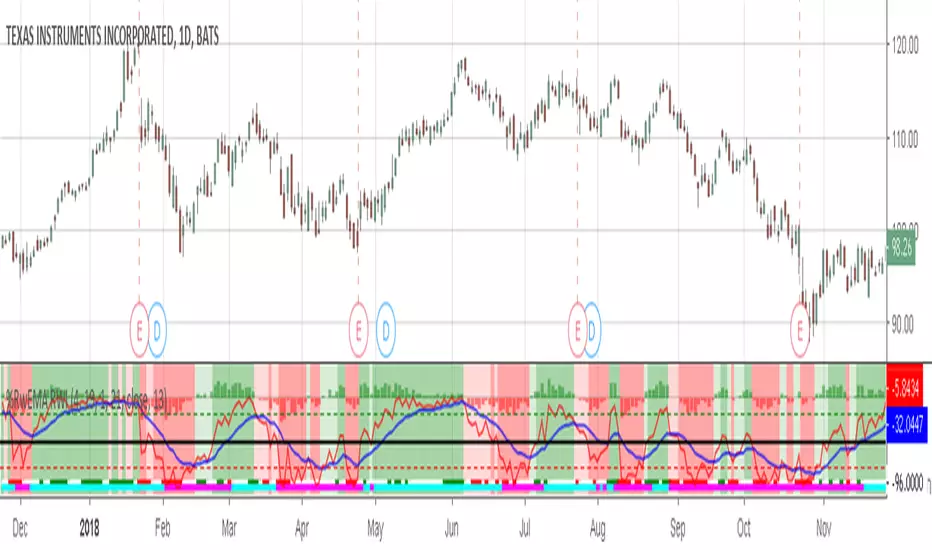
Haos Visual @PuppyTherapyToday I am bringing to you my interpretation of the Haos Visual Oscillator with a trend which is derived from two Williams R% indicators smoothed by T3. I have been inspired by this idea in the following post.
www.prorealcode.com
Is a pretty unique indicator indeed that due to its smoothing provide nice entries. Your Entry signal is when the histogram, which is the longer term willy is green that signalizes strong bullish momentum. If you then receive a momentum change which is the dot on the short willy or you breach the -30 to -40 area it is a strong buy signal.
Also, this is my first V4 Script thanks to Tradingview to adding to the platform :)

Williams %R IndicatorDeveloped by Larry Williams, Williams %R is a momentum indicator much like the Stochastic Oscillator and is especially popular
for measuring overbought and oversold levels. The scale ranges from 0 to -100 with readings from 0 to -20 considered overbought,
and readings from -80 to -100 considered oversold. Typically, Williams %R is calculated using 14 periods and can be used on intraday,
daily, weekly or monthly data.
This implementation is enhanced with CCI in the form of background colors as a confirming signal and an indication of a prevailing trend.

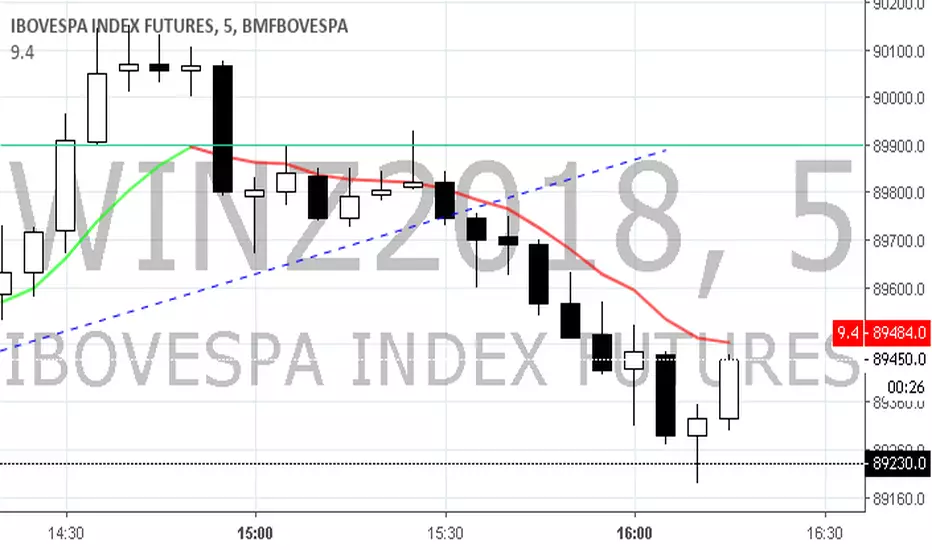
Setup 9.4 - Larry Williams---IN-US---
Hi traders, this simple setup was created by the professional Trader Larry Willians.
This trade system is based on 9 EMA .
Setup EMA 9.3
1) Find a stock with 9 EMA uptrend and turns down, but the low of the candle which made turn go down can't be lose, 9 EMA can go down ONLY ONE candle.
2) Wait for 9 EMA go up in the next candle and mark the high.
3) If the price doesnt across the high, mark the next high.
4) Buy when the price cross the mark.
5) Stop-loss in the low of the marked candle.
--PT-BR---
Olá traders, setup universal, criado pelo famoso Trader Larry Williams , e divulgado pelo Trader Palex. Setup baseado na MME de 9 períodos.
Setup MME 9.4
1) Achar ativo com a MME9 esteja subindo; A MME9 vem subindo e vira para baixo, mas o candle que fez essa virada ocorrer não tem a mínima perdida e a MME9 volta a virar para cima no candle seguinte. Só pode ficar virada pra baixo 1 candle e logo no candle seguinte a média vira pra cima.
2) Marcamos a máxima do candle que fez a MME9 virar para cima e no seu rompimento temos a entrada na
ponta compradora.
3) Se a máxima não for rompida, marcar a próxima máxima;
4) Compra no rompimento dessa máxima (qualquer negócio acima dessa máxima);
5)Stop-loss na mínima do candle que fez a MME9 virar para baixo.
Bons trades a todos.
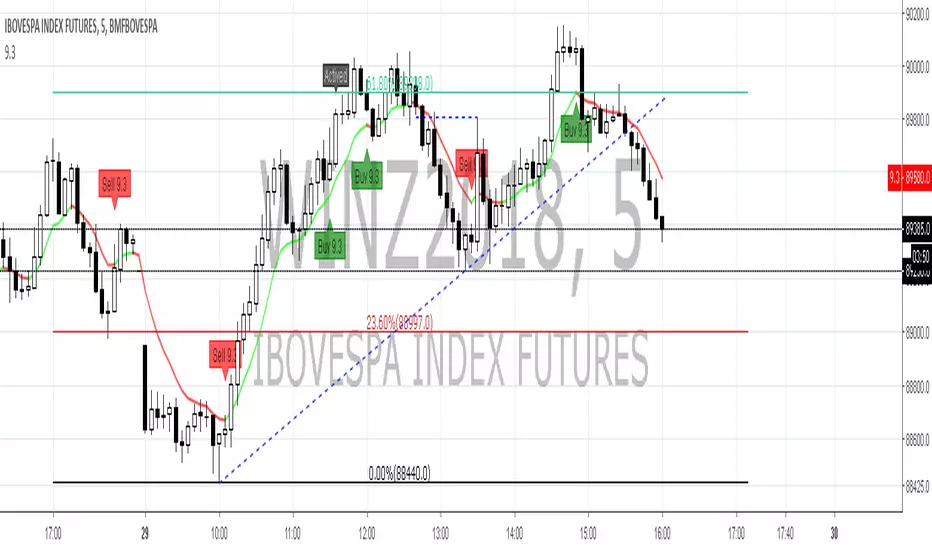
Setup 9.3 - Larry Williams--IN-US---
Hi traders, this simple setup was created by the professional Trader Larry Willians.
This trade system is based on 9 EMA .
Setup 9.3
1) Find a stock with the 9 period EMA uptrend.
2) Look for a close which is followed by two lower closes,
3) Mark the high of the last candle.
4) Buy when the price cross the mark.
5) Stop-loss in the low of the marked candle.
---PT-BR---
Olá traders, setup universal, criado pelo famoso Trader Larry Williams , e divulgado pelo Trader Palex. Setup baseado na MME de 9 períodos.
Setup MME 9.3
1) Achar ativo com a MME9 esteja subindo;
2) Procurar 1 fechamento que seja seguido por dois fechamentos seguidos descendentes (abaixo do "candle referência") e marcar máxima do último candle;
3) Se a máxima não for rompida, marcar a próxima máxima;
4) Compra no rompimento dessa máxima (qualquer negócio acima dessa máxima);
5) Stop na mínima do candle anterior ao que gerou a entrada;
Setup 9.2 - Larry Williams---IN-US---
Hi traders, this simple setup was created by the professional Trader Larry Willians.
This trade system is based on 9 EMA.
Setup EMA 9.2
1) Find a stock with 9 EMA uptrend.
2) Wait for a close below the last candle low and mark the high of it candle.
3) If the price doesnt across the high, mark the next high.
4) Buy when the price cross the mark.
5) Stop-loss in the low of the marked candle.
---PT-BR---
Olá traders, setup universal, criado pelo famoso Trader Larry Williams, e divulgado pelo Trader Palex. Setup baseado na MME de 9 períodos.
Setup MME 9.2
1) Achar ativo com a MME9 subindo;
2) Aguardar fechamento abaixo da mínima do candle anterior e marcar a máxima desse candle;
3) Se a máxima não for rompida, marcar a próxima máxima;
4) Compra no rompimento dessa máxima (qualquer negócio acima dessa máxima);
5) Stop na mínima do candle anterior ao que gerou a entrada;
Bons trades.

Willams %R with 13 EMA and middle pointWillams %R with 13 EMA and middle point. It also uses the textbook formula instead of the Tradingview one.
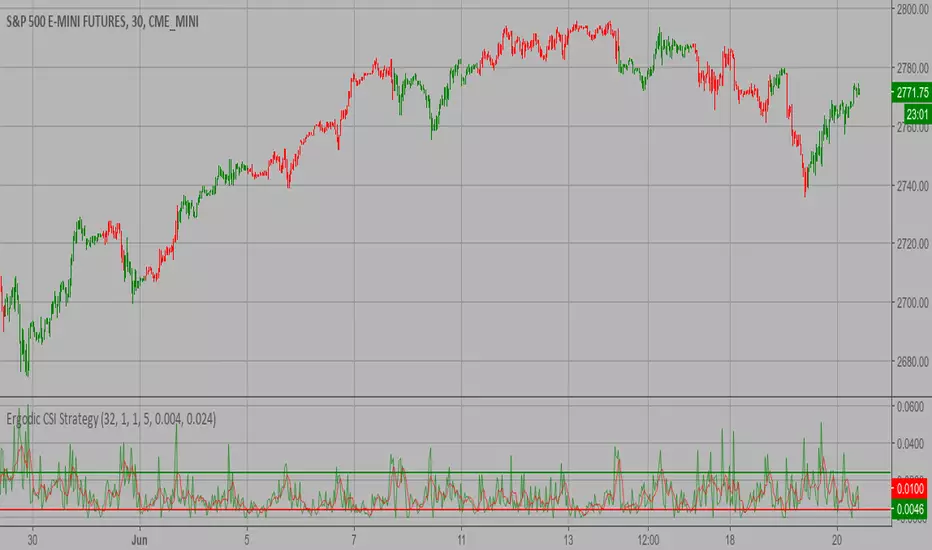
Ergodic CSI Strategy This is one of the techniques described by William Blau in his book
"Momentum, Direction and Divergence" (1995). If you like to learn more,
we advise you to read this book. His book focuses on three key aspects
of trading: momentum, direction and divergence. Blau, who was an electrical
engineer before becoming a trader, thoroughly examines the relationship between
price and momentum in step-by-step examples. From this grounding, he then looks
at the deficiencies in other oscillators and introduces some innovative techniques,
including a fresh twist on Stochastics. On directional issues, he analyzes the
intricacies of ADX and offers a unique approach to help define trending and
non-trending periods.
This indicator plots Ergotic CSI and smoothed Ergotic CSI to filter out noise.
WARNING:
- This script to change bars colors.
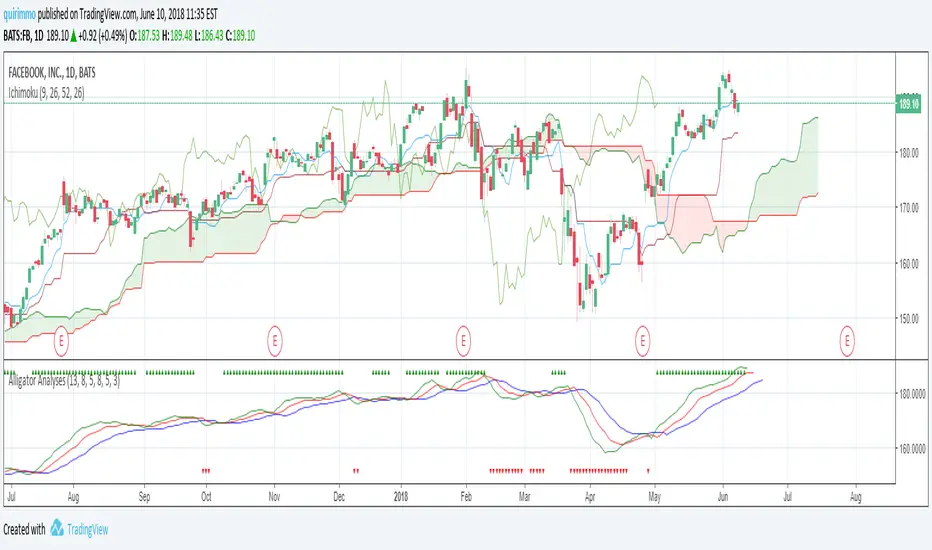
Alligator AnalysesA simple script in order to plot the Alligator Indicator with triangles plotted on the graph in order to see directly if the alligator is sleeping or eating.
You will see green up triangles when the alligator is bullish eating, while red down triangles when the alligator is bearish eating.
You will not see anything on the chart when the alligator is sleeping.

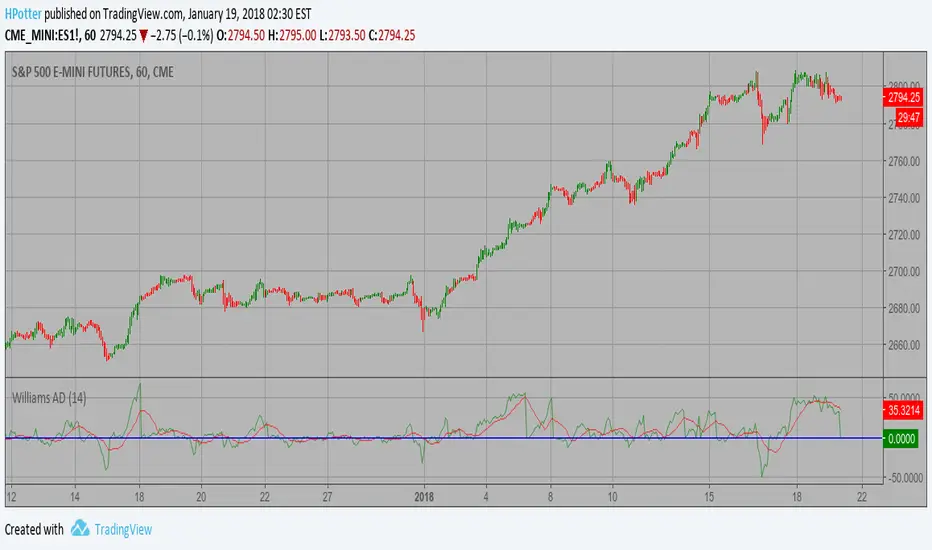
Smoothened Williams A/D Strategy Accumulation is a term used to describe a market controlled by buyers;
whereas distribution is defined by a market controlled by sellers.
Williams recommends trading this indicator based on divergences:
Distribution of the security is indicated when the security is making
a new high and the A/D indicator is failing to make a new high. Sell.
Accumulation of the security is indicated when the security is making
a new low and the A/D indicator is failing to make a new low. Buy.
WARNING:
- This script to change bars colors.
Williams Accumulation/Distribution (Williams AD) Strategy Accumulation is a term used to describe a market controlled by buyers;
whereas distribution is defined by a market controlled by sellers.
Williams recommends trading this indicator based on divergences:
Distribution of the security is indicated when the security is making
a new high and the A/D indicator is failing to make a new high. Sell.
Accumulation of the security is indicated when the security is making
a new low and the A/D indicator is failing to make a new low. Buy.
WARNING:
- This script to change bars colors.

Klinger Volume Oscillator (KVO) Strategy The Klinger Oscillator (KO) was developed by Stephen J. Klinger. Learning
from prior research on volume by such well-known technicians as Joseph Granville,
Larry Williams, and Marc Chaikin, Mr. Klinger set out to develop a volume-based
indicator to help in both short- and long-term analysis.
The KO was developed with two seemingly opposite goals in mind: to be sensitive
enough to signal short-term tops and bottoms, yet accurate enough to reflect the
long-term flow of money into and out of a security.
The KO is based on the following tenets:
Price range (i.e. High - Low) is a measure of movement and volume is the force behind
the movement. The sum of High + Low + Close defines a trend. Accumulation occurs when
today's sum is greater than the previous day's. Conversely, distribution occurs when
today's sum is less than the previous day's. When the sums are equal, the existing trend
is maintained.
Volume produces continuous intra-day changes in price reflecting buying and selling pressure.
The KO quantifies the difference between the number of shares being accumulated and distributed
each day as "volume force". A strong, rising volume force should accompany an uptrend and then
gradually contract over time during the latter stages of the uptrend and the early stages of
the following downtrend. This should be followed by a rising volume force reflecting some
accumulation before a bottom develops.
WARNING:
This script to change bars colors.

Colored Williams %RThis script is the same as Williams %R except that on green days we plot green and red on red days. If a bar opens and closes the same, we plot black.

Willams %RwEMAspy
Was looking for something else when surfed into an old question
wanting %R 21 period with EMA 13 period of the %R signal
and being a rookie at this, made this code to post for them.
Tried to comment the script in such a way that other rookies
like me could make better sense of what is being done. Hope
this helps someone. I find it useful as one of my indicators for
trading.
Pinescript for tradingview.com user Tom1trader
All time frames.
Interpretation:
%R (Red) crosses above it's average (Blue) - bull
%R crosses below it's average - bear. Background
color changes green-up red-down with above crossings.
Most but not all of serious price movement takes place
from the time the %R (red) goes into oversold (or bought) and
exits again.
%R centerline crosses can also be useful.
I use various indicators and want all of the confirmation
that I can get for expectations BUT I never know what the
next bar will do and define my risks accordingly.
Williams Accumulation/Distribution (Williams AD) Accumulation is a term used to describe a market controlled by buyers;
whereas distribution is defined by a market controlled by sellers.
Williams recommends trading this indicator based on divergences:
Distribution of the security is indicated when the security is making
a new high and the A/D indicator is failing to make a new high. Sell.
Accumulation of the security is indicated when the security is making
a new low and the A/D indicator is failing to make a new low. Buy.

SMI Ergodic Oscillator The SMI Ergodic Indicator is the same as the True Strength Index (TSI) developed by
William Blau, except the SMI includes a signal line. The SMI uses double moving averages
of price minus previous price over 2 time frames. The signal line, which is an EMA of the
SMI, is plotted to help trigger trading signals. Adjustable guides are also given to fine
tune these signals. The user may change the input (close), method (EMA), period lengths
and guide values.
You can use in the xPrice any series: Open, High, Low, Close, HL2, HLC3, OHLC4 and ect...

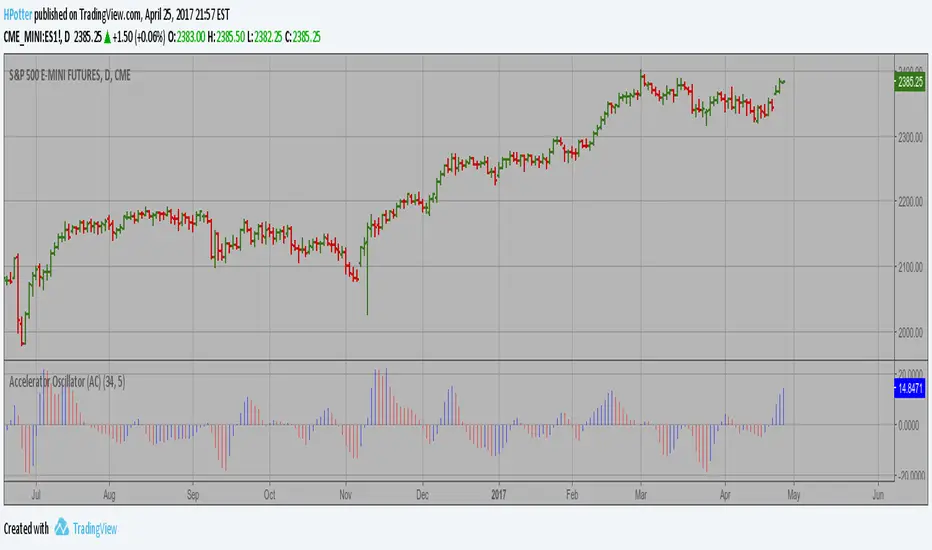
Accelerator Oscillator (AC) The Accelerator Oscillator has been developed by Bill Williams
as the development of the Awesome Oscillator. It represents the
difference between the Awesome Oscillator and the 5-period moving
average, and as such it shows the speed of change of the Awesome
Oscillator, which can be useful to find trend reversals before the
Awesome Oscillator does.
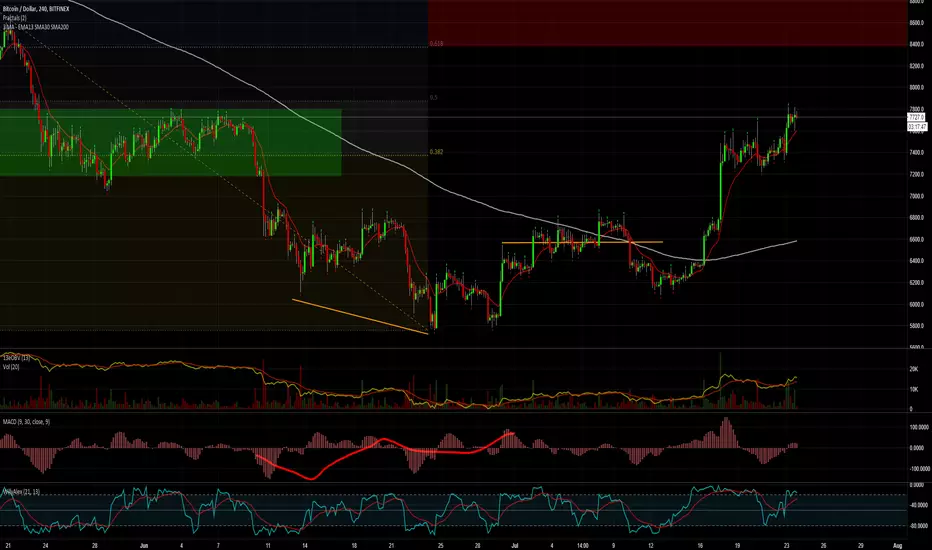
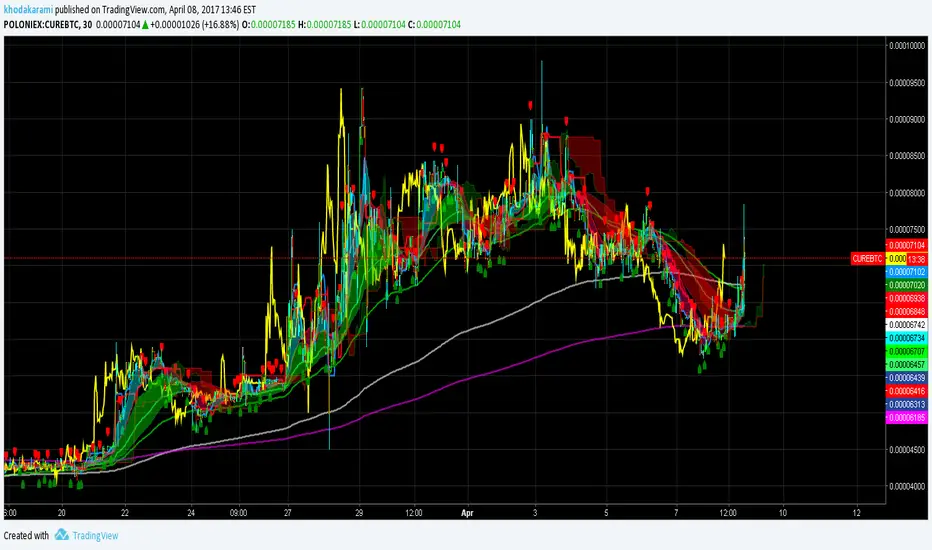
Guerrilla AdvancedThis indicator was designed with people without Pro License in mind (Including many of my close friends).
Basically, you will get a combo of few different tools in one box, with ability to turn them on and off with a single check mark, also, you have total control over the input numbers that was used in calculations if you so want to, for example, sometimes when i see a massive bullish up trend, i reduce the short rally from 12 to 8 even 6 to get faster signal for selling the trend.
So, what will you get in this pack?
1- Ichimoko. Yes, you heard it right, although we have it in the default tools but hey, it will use one indicator slot and if you don't have a pro license, you will use that slot
2- Rally. This is an old yet very powerful system for getting buy or sell signals, basically, you get two lines and for making the life easier i draw a cloud between them. when the trend passes above the cloud and it was bellow it in past, right after the very first candle that gets above the cloud you can put the buy order, and vice versa, the moment a candle body enters the cloud, if you want an aggressive signal, you can sell, if not, you may want to wait to see if the candles drop bellow the cloud or not then decide.
3- Resistance Support Cloud. Most of us always heard about resistance and support "lines" but many of us don't know that, in each trend, the trend line itself is a resistance or support line, and when you are going in a bullish or bearish tunnel, the floor and roof of tunnels are again resistance and supports, using this part of the tool, just like rally, you get a cloud that shows you the resistance / support "zone"
4- William Fractals. To be honest, I got this part of the code from another source available around. Why? looking at those fractal indicators, you can easily eyeball the trend line or existence of a tunnel.
5- Different EMA lines. If you are one of those people that use EMA lines for their trading, have fun with them, there are few different standard ones and even a custom one that you can put your desired number for it.
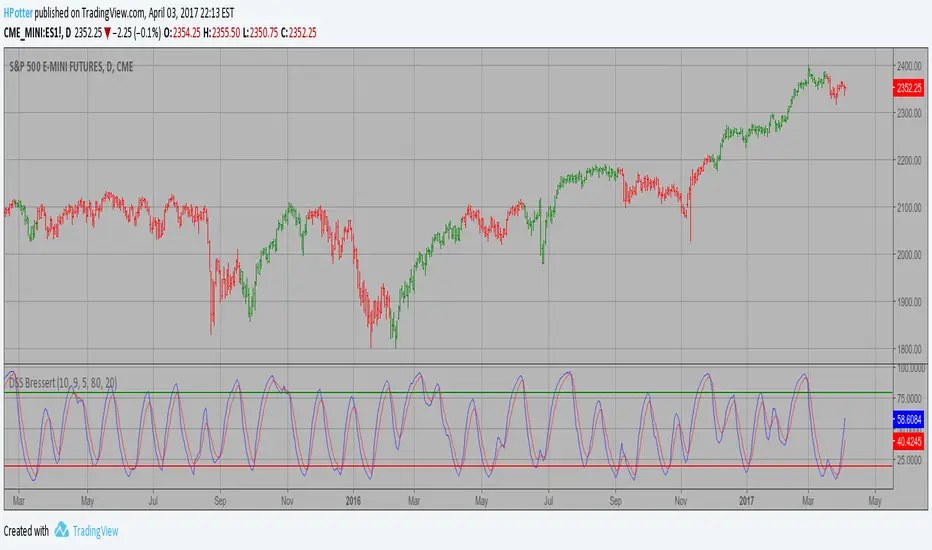
DSS Bressert (Double Smoothed Stochastic) Strategy Double Smoothed Stochastics (DSS) is designed by William Blaw.
It attempts to combine moving average methods with oscillator principles.
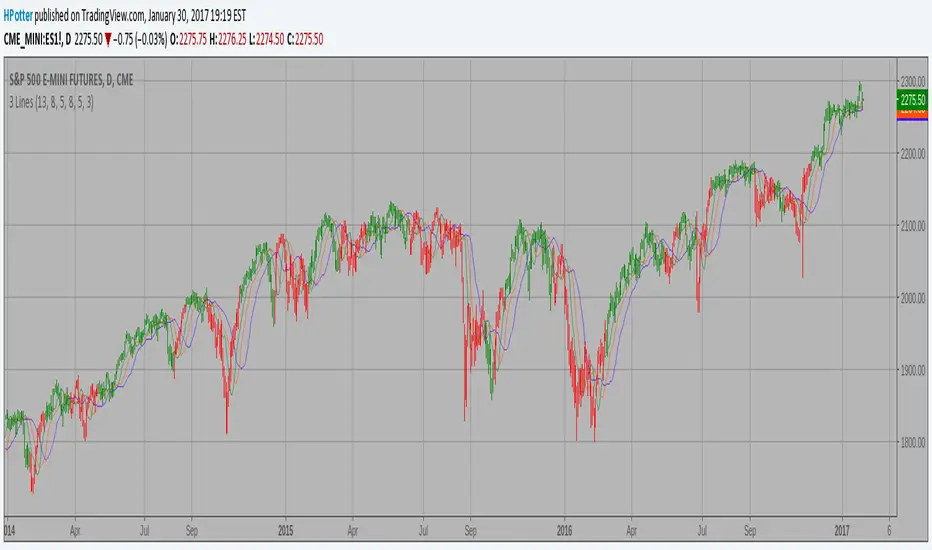
Bill Williams Averages. 3Lines Strategy This indicator calculates 3 Moving Averages for default values of
13, 8 and 5 days, with displacement 8, 5 and 3 days: Median Price (High+Low/2).
The most popular method of interpreting a moving average is to compare
the relationship between a moving average of the security's price with
the security's price itself (or between several moving averages).