[MAD] WaveBuilderThe WaveBuilder indicator is a powerful technical analysis tool that combines wave calculations, channel formation, and smoothing techniques to identify trends, reversals, and potential trading opportunities.
It provides users with customizable settings for different timeframes, smoothing averages, channel levels, and alert conditions, making it a comprehensive and versatile tool for analyzing market dynamics.
----------------------
Wave Settings:
The Wave Settings section in the Multitimeframe WaveTrend indicator allows you to configure parameters related to the wave calculations based on different timeframes and lengths. This section focuses on four different lengths. Here are the details of the Wave Settings (4 Lengths):
Timeframe 1 (TF1): This parameter allows you to select the first timeframe for the wave calculation. You can choose any valid timeframe.
Weight (F1): This setting represents the weight for Timeframe 1. It is a floating-point value that affects the impact of this timeframe in the wave calculation.
Multiplier 2 (TF2): This parameter specifies the multiplier for the second timeframe. It determines the ratio between Timeframe 2 and Timeframe 1.
Weight (F2): This setting represents the weight for Timeframe 2. It determines the influence of Timeframe 2 in the wave calculation.
Multiplier 3 (TF3): This parameter defines the multiplier for the third timeframe. It determines the ratio between Timeframe 3 and Timeframe 1.
Weight (F3): This setting represents the weight for Timeframe 3. It determines the impact of Timeframe 3 in the wave calculation.
Multiplier 4 (TF4): This parameter specifies the multiplier for the fourth timeframe. It determines the ratio between Timeframe 4 and Timeframe 1.
Weight (F4): This setting represents the weight for Timeframe 4. It determines the influence of Timeframe 4 in the wave calculation.
WaveBuilder Fast: This parameter sets the length of the fast wave average. It represents the number of bars considered in the calculation of the fast wave average.
WaveBuilder Slow: This parameter sets the length of the slow wave average. It represents the number of bars considered in the calculation of the slow wave average.
The Wave Settings allow you to configure different timeframes, multipliers, and weights for wave calculations. These settings provide flexibility in customizing the indicator's behavior based on your preferred trading strategy and market conditions.
----------------------
Counter Oscillator:
The Counter Oscillator section in the Multitimeframe WaveTrend indicator enables you to configure parameters related to a counter oscillator. This oscillator helps identify potential reversals or countertrend movements.
Here are the details of the Counter Oscillator settings:
Multiplier Counter (TF5): This parameter allows you to select the multiplier counter timeframe. It determines the ratio between the multiplier counter and the main timeframes.
Weight (F5): This setting represents the weight for the multiplier counter. It determines the influence of the multiplier counter in the counter oscillator calculation.
Length (will_length): This parameter sets the length or period of the counter oscillator. It represents the number of bars considered in the counter oscillator calculation.
The Counter Oscillator settings provide additional insights into the market by analyzing countertrend movements. By adjusting the multiplier counter and length parameters, you can customize the counter oscillator to suit your trading preferences.
----------------------
Wave Smoothing and Mixing:
The Wave Smoothing and Mixing section in the Multitimeframe WaveTrend indicator allows you to configure parameters related to the smoothing and mixing of the wave calculations. Here are the details of the Wave Smoothing and Mixing settings:
Average 1 Type: This parameter allows you to select the type of smoothing average for the first average. You have various options such as WMA, HMA, VWMA, LMA, RMA, SMA, EMA, and more.
Length 1: This setting determines the length or period of the first smoothing average. It represents the number of bars considered in the calculation.
Average 2 Type: This parameter allows you to select the type of smoothing average for the second average.
Length 2: This setting determines the length or period of the second smoothing average.
Mix Factor AVG1-AVG2: This parameter controls the mixing factor between the first and second smoothing averages. It affects the weighting or blending of the two averages.
POW - Factor: This parameter adjusts the power factor, which can compress or expand the resulting values. It allows you to fine-tune the output based on your preferences.
The Wave Smoothing and Mixing settings enable you to smooth the wave calculations and mix different averages to create a more refined and customized output. By selecting the desired smoothing types, adjusting the lengths, and modifying the mix factor and power factor, you can tailor the indicator to your specific trading style.
----------------------
Channel Levels and Alert Mode:
The Channel Levels and Alert Mode section in the Multitimeframe WaveTrend indicator allows you to configure parameters related to the channel levels and the alert mode. Here are the details of the Channel Levels and Alert Mode settings:
Channel Width: This parameter determines the width or range of the channel levels. It represents the distance between the upper and lower channel lines.
Channel Shift Up/Down: This setting allows you to shift the entire channel up or down. It represents the vertical offset of the channel lines.
Alert Mode (Alertmode): This parameter determines the type of alert triggered by the indicator based on the channel levels.
You have options such as Outside, CrossIn, CrossOut, ChangeDir-All, and ChangeDir-Outside.
Channel Levels: The upper and lower channel levels are calculated based on the channel width and offset. They provide visual boundaries for the price movement within the channel.
The Channel Levels and Alert Mode settings help define the channel levels and specify the conditions for generating alert notifications.
By adjusting the channel width, offset, and selecting the appropriate alert mode, you can customize the indicator's behavior according to your trading requirements.
----------------------
Dynamic Channel:
The Dynamic Channel section in the Multitimeframe WaveTrend indicator allows you to configure parameters related to the dynamic channel formation.
This feature helps create channels based on different smoothing averages.
Here are the details of the Dynamic Channel settings:
Channel Average 1 Type: This parameter allows you to select the type of smoothing average for the first channel average.
Length 1: This setting determines the length or period of the first channel average.
Channel Average 2 Type: This parameter allows you to select the type of smoothing average for the second channel average.
Length 2: This setting determines the length or period of the second channel average.
MA 1 / MA 2 Mix Factor: This parameter controls the mixing factor between the first and second channel averages. It affects the weighting or blending of the two averages.
Mixing Off Dynamic in Weight: This parameter allows you to mix off the dynamic in weight.
Smoothing Type: This parameter allows you to select the type of smoothing for the trend within the dynamic channel.
Smoothing Length: This setting determines the length or period of the trend smoothing within the dynamic channel.
The Dynamic Channel settings enable you to create channels based on different smoothing averages and adjust the weighting between them. Additionally, you can apply further smoothing to the trend within the dynamic channel. This feature helps identify trends and potential trade opportunities within the channel.
----------------------
Speed of Change Rate:
The Speed of Change Rate section in the Multitimeframe WaveTrend indicator allows you to configure parameters related to the rate of change in the indicator. Here are the details of the Speed of Change Rate settings:
Plot Speed (plot_speed): This setting determines whether to plot the speed of change on the chart.
Speed Scaling (change_factor): This parameter adjusts the scaling factor for the speed of change.
Speed Smoother (smoothtype_change): This parameter allows you to select the type of smoothing average for the speed of change calculation.
Speed Length (change_length): This setting determines the length or period of the speed of change calculation.
The Speed of Change Rate settings provide insights into the rate at which the indicator values are changing. By visualizing and analyzing the speed of change, you can identify potential acceleration or deceleration in the price movement.
----------------------
Signal Main Configuration:
The Signal Main Configuration section in the Multitimeframe WaveTrend indicator allows you to configure parameters related to the signal input and passthrough. Here are the details of the Signal Main Configuration settings:
Signal Type (inputtype): This parameter determines the type of signal input. You have options such as MultiBit and NoInput.
Select L1 Indicator Signal (inputModule): This parameter allows you to select the source of the L1 indicator signal. You can choose any valid input source, such as the closing price or another indicator.
Signal Passthrough (Passthrough): This setting enables or disables the passthrough of the signal. When enabled, the indicator passes the input signal to the output.
The Signal Main Configuration settings allow you to define the type of signal input and control whether to pass the signal through the indicator or not. This feature provides flexibility in integrating the indicator with other trading strategies or indicators.
----------------------
Multibit Modified Channel:
The Multibit Modified Channel section in the Multitimeframe WaveTrend indicator allows you to configure parameters related to the modified channel based on the multibit input. Here are the details of the Multibit Modified Channel settings:
Input Bull (CH_Trendup_in): This parameter allows you to specify the input channel for bullish signals.
Bull Offset (trendfactorbull): This setting determines the offset for the bullish signals in the modified channel.
Input Bear (CH_Trenddown_in): This parameter allows you to specify the input channel for bearish signals.
Bear Offset (trendfactorbaer): This setting determines the offset for the bearish signals in the modified channel.
The Multibit Modified Channel settings enable you to modify the channel based on the multibit input. By specifying the input channels for bullish and bearish signals and adjusting the respective offsets,
you can customize the channel representation based on your trading strategy.
Multibit Output:
The Multibit Output section in the Multitimeframe WaveBuilder indicator allows you to configure parameters related to the output of the multibit signals and alerts. Here are the details of the Multibit Output settings:
Output Bull (CH_Buy_out): This parameter specifies the output channel for bullish signals.
Output Bear (CH_Sell_out): This parameter specifies the output channel for bearish signals.
Show Alerts (showalerts): This setting determines whether to display alert notifications for the multibit signals.
The Multibit Output settings define the output channels for bullish and bearish signals and control the display of alert notifications. This allows you to visualize and receive alerts for the multibit signals generated by the indicator.
----------------
Here a overview from the settings
--------------------------------
The pipeline of the WaveBuilder can be understood in the following structured manner:
----------
Wave Calculation:
Wave calculation is performed using the input parameters, resulting in wave values.
The wave values are then averaged using Average 1 and Average 2, and the weighted average is obtained.
The weighted average is mixed with other factors to create a mixed value.
----------
Channel Formation:
The mixed value is multiplied by a weight to generate a dynamic part.
The dynamic part is combined with the static channel and the multibit modification to form a base value.
----------
Smoothing and Mixing:
The base value is averaged using Average 1 and Average 2, and the weighted average is calculated.
The mixed2 value is obtained by smoothing the weighted average.
The mixed2 value is further processed using power compression (POW) to refine the output.
----------
Plotting:
The final smoothed and processed values are plotted to visualize the indicator on the chart.
By following this pipeline, the WaveBuilder combines wave calculations, channel formation, smoothing techniques, and power compression to provide valuable insights into market trends and potential trading opportunities.
--------------------------------
Librarys used:
djmad/Signal_transcoder_library
djmad/MAD_MATH
djmad/Mad_Standardparts
Waves

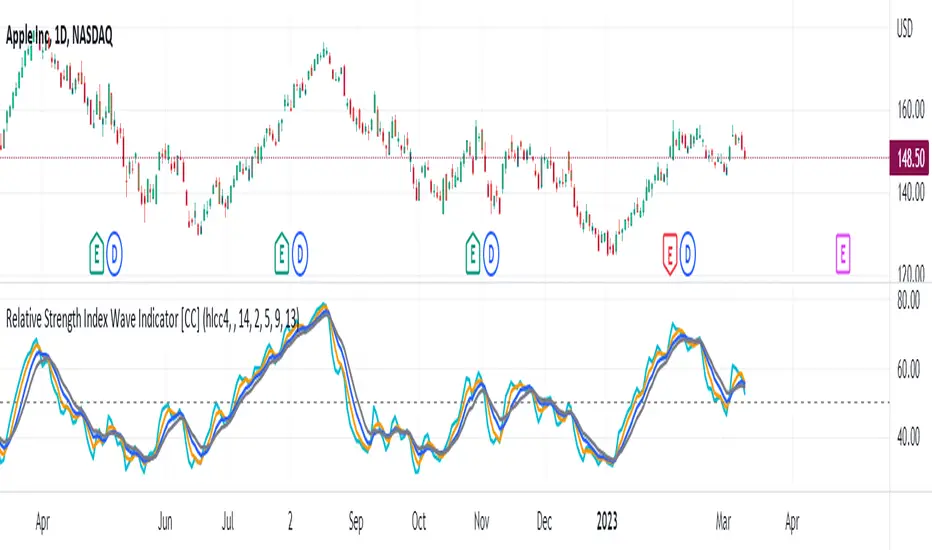
Relative Strength Index Wave Indicator [CC]The Relative Strength Index Wave Indicator was created by Constance Brown (Technical Analysis for the Trading Professional), and this is a unique indicator that uses the weighted close formula, but instead of using the typical price values, it uses the RSI calculated from the various prices. It then creates a rainbow by smoothing the weighted RSI with four different lengths. As far as the buy or sell signals with this indicator go, I did change things from the original source, so feel free to experiment and let me know if anything works better for you. I decided to do a variation of the original source and create buy and sell signals based on crossovers, but my version only uses the first and second smoothed RSI lines. You could also average all of the lines and buy when the average is rising and sell when it starts to fall. I have used my typical buy and sell signals to use darker colors for strong signals and lighter colors for normal signals. Because of the rainbow effect from the wave, the color changes will only appear for the bar itself when you enable that setting.
Let me know if there is any other script you would like to see me publish! I will have plenty more RSI scripts to publish in the next week. Let me know if you like this indicator series.
Harmonic Sine Waves model plot Hey,
Here is another tool that I created. I could not find anything similar.
This script is creating a sine wave, based on the given length, amplitude, horizontal vertical offset.
After this it plots also nearest harmonics to the base sine wave and draws it on the chart.
At the last step it sums up the value for base sine wave with its harmonics.
This is a great way to experience how 4 basic sine waves, when summed up, are creating more complex chart.
This shows that the 'chaotic' chart can be built on just a few most important factors.
You do not have to "know every single fact" about the asset to make a proper forecast.
You just need those most important.
It is crucial though, to offset the chart in a correct way, so it is in phase with the asset that we work on.

NET BSP NET BSP derived from Buying & Selling Pressure which is a volatility indicator that monitors average metrics of green and red candles separately.
We could navigate more confidently through market with projected market balance.
BSP allowed us to track and analyze the ongoing performance of bullish and bearish impulsive waves and their corrections.
Due to unintuitive way of measuring decline with SP going up, I decided to remake it into more intuitive version with better precision.
When we encounter the fall it's better to have declining values of tool to be able to cover it visually with ease.
One of the solutions was to create a sense of balance of Buying Pressure against Selling Pressure.
Since we are oriented by growth, it'd be more logical to summarize the market balance with BP - SP
Comparison:
When Buying and Selling Pressure are equal, NET BSP would be at 0.
NETBSP > 0 and NETBSP > NETBSP = 🟢
NETBSP > 0 and NETBSP < NETBSP = 🟡
NETBSP < 0 and NETBSP < NETBSP = 🔴
NETBSP < 0 and NETBSP > NETBSP = 🟡
Hence, we get visualized stages of uptrends and downtrends which allows to evaluate chances and estimations of upcoming counter-waves.
Also, it is worth to note that output clearly shows how one wave is derived from another in terms of sizing.
Feel free to adjust NET BSP arguments to adapt sensitivity to the timeframe you're working on.

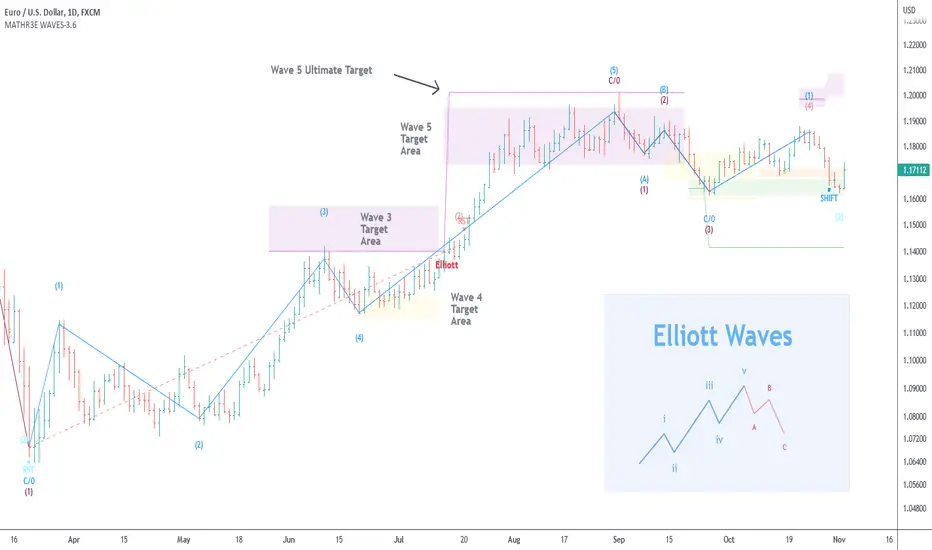
MATHR3E WAVES█ OVERVIEW
MATHR3E WAVES automatically draws Elliott Waves on your charts with their potential associated targets.
█ CONCEPTS
Disclaimer
MATHR3E RETRACEMENTS indicator is intended for advanced traders and may fit your profile, whether you are a day trader or a long-term investor.
It was originally developed by a renowned market analyst and documented in numerous books. Among them is the author Jason Perl.
It is recommended to have read the trading techniques mentioned in the books covering this indicator beforehand.
How to use:
MATHR3E WAVES indicator can provide a roadmap of market direction that you can use to determine price targets and isolate exhaustion points from potential trends in conjunction with other indicators by the same author.
Be aware the indicator's approach is derived from the Elliott wave theory and may slightly diverge from the cardinal rules of Elliott waves.
Principle of the Elliott Wave Theory
Movement in the direction of the trend is unfolding in 5 waves (called motive wave) while any correction against the trend is in three waves (called corrective wave). The movement in the direction of the trend is labeled as 1, 2, 3, 4, and 5. The three-wave correction is labeled as a, b, and c. These patterns can be seen in the long term as well as short term charts.
Wave 1:
Wave one is rarely obvious at its inception. When the first wave of a new bull market begins, the fundamental news is almost universally negative. The previous trend is considered still strongly in force. Fundamental analysts continue to revise their earnings estimates lower; the economy probably does not look strong. Sentiment surveys are decidedly bearish, put options are in vogue, and implied volatility in the options market is high. Volume might increase a bit as prices rise, but not by enough to alert many technical analysts.
Wave 2:
Wave two corrects wave one, but can never extend beyond the starting point of wave one. Typically, the news is still bad. As prices retest the prior low, bearish sentiment quickly builds, and "the crowd" haughtily reminds all that the bear market is still deeply ensconced. Still, some positive signs appear for those who are looking: volume should be lower during wave two than during wave one, prices usually do not retrace more than 61.8% of the wave one gains, and prices should fall in a three-wave pattern.
Wave 3:
Wave three is usually the largest and most powerful wave in a trend. The news is now positive and fundamental analysts start to raise earnings estimates. Prices rise quickly, corrections are short-lived and shallow. Anyone looking to "get in on a pullback" will likely miss the boat. As wave three starts, the news is probably still bearish, and most market players remain negative; but by wave three's midpoint, "the crowd" will often join the new bullish trend. Wave three often extends wave one by a ratio of 1.618:1.
Wave 4:
Wave four is typically clearly corrective. Prices may meander sideways for an extended period, and wave four typically retraces less than 38.2% of wave three. Volume is well below that of wave three. This is a good place to buy a pullback if you understand the potential ahead for wave 5. Still, fourth waves are often frustrating because of their lack of progress in the larger trend.
Wave 5:
Wave five is the final leg in the direction of the dominant trend. The news is almost universally positive and everyone is bullish. Unfortunately, this is when many average investors finally buy-in, right before the top. Volume is often lower in wave five than in wave three, and many momentum indicators start to show divergences (prices reach a new high but the indicators do not reach a new peak).
Wave A:
Corrections are typically harder to identify than impulse moves. In wave A of a bear market, the fundamental news is usually still positive. Most analysts see the drop as a correction in a still-active bull market. Some technical indicators that accompany wave A include increased volume, rising implied volatility in the options markets, and possibly a turn higher in open interest in related futures markets.
Wave B:
Prices reverse higher, which many see as a resumption of the now long-gone bull market. Those familiar with classical technical analysis may see the peak as the right shoulder of a head and shoulders reversal pattern. The volume during wave B should be lower than in wave A. By this point, fundamentals are probably no longer improving, but they most likely have not yet turned negative.
Wave C:
Prices move impulsively lower in five waves. Volume picks up, and by the third leg of wave C, almost everyone realizes that a bear market is firmly entrenched. Wave C is typically at least as large as wave A and often extends to 1.618 times wave A or beyond.
█ FEATURES & BENEFITS
Versatile
The indicator works on relative price action, so you can apply it without having to change any of the default settings.
Targets:
Customize the high and low wave targets to identify possible price target areas.
Adjustable Rules:
• Shift Wave 2: if Wave 4 closes below the low close of Wave 2.
• Shift Wave 4: if Wave A closes below the low close of Wave 4.
• Allow Wave 4 to overlap Wave 1
• Allow truncated Wave 5
• Allow truncated Wave C
Price ratio:
Force waves 2/4 to retrace to a specific Fibonacci level.
Force Waves 3/5 size to a specific Fibonacci level.
Time Ratio:
Force selected waves to last a required number of bars.
Alerts:
Set up your alerts and receive notifications on wave completion.
Alerts format can be adapted to be received on Discord servers.
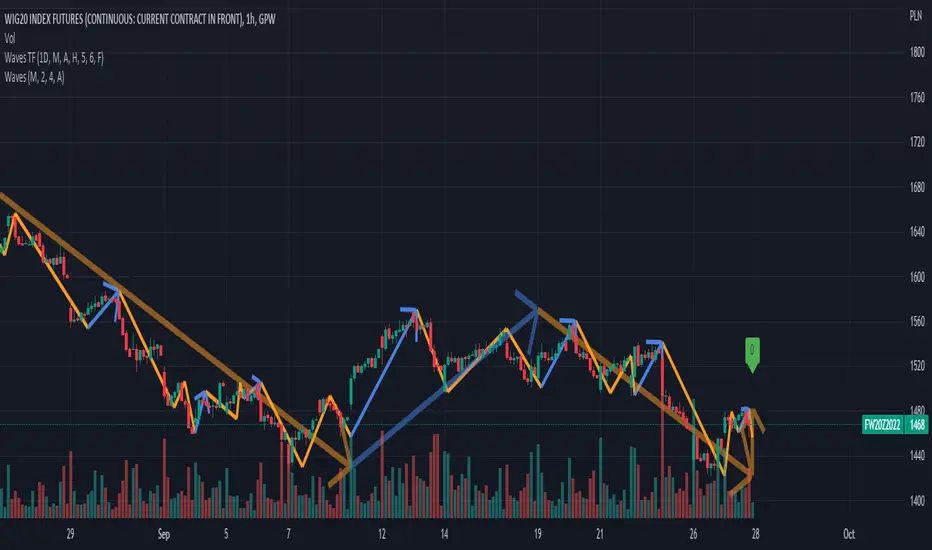
Waves CorrectionsWave theory tool for tracking waves relations and their corrections. It filters out a sets of formations and count how often correction from them are reaching characteristic correction levels marked on the chart as CL1, CL2, CL3.
It supports 2 rulesets/wave variants:
Low - Based on more sensitive trend detection.
Medium - Based on less sensitive trend detection.
Script settings:
| SCANNER |
Trend type - Trend used by scanner to detect sets of waves.
L - Low
M - Medium
<= W1/W2 * 100% <= - Tresholds describing proportions between 1 and 2 wave in the set.
<= W3/W1 * 100% <= - Tresholds describing proportions between 3 and 1 wave in the set.
<= W3/W2 * 100% <= - Tresholds describing proportions between 3 and 2 wave in the set.
Show potencial areas - Showing underway sets
Show Arrows - Showing arrows with possible correction on underway set.
Correction from trend UP - Background and border colors for found sets in up trends
Correction from trend Down - Bakcground and border colors for found sets in down trends.
History - Showing sets in historic data.
Stats - Type of statistic table shown on the screen:
H - Hide
% - Statistics with normal font
%s - Statistics with small font
Wn n= - Picking how many waves are taken into account when calculating statistics .
| TREND VISUALIZATION |
Type - Trend visualization types:
H - Hidden
L - Low
M - Medium
B - Both
Alfred - AI assistant that informs about wave confirmation or trend changes (With "Both" type Alfred will monit only Medium wave).
Shadow - Showing second reprezentation of the trend with drawing with the use of minimal and maximal values. It's usefull to determine the delay between the peak and a wave change signal.
Low/Med Line width/color - Width/color of drawn line. Separate setting for Low and Medium trend type.
| IMPULS VISUALIZATION |
Impuls - Drawing impuls modes:
H - Hidden
F - First
S - Second
A - Auto
Impuls color - Color of the first bullish arrow.
Draw arrow - Drawing arrow at the end of the first bullish arrow.
Troubleshooting:
In case of any problems, send error details to the author of the script.

Mark Structure ShdwMark Structure Show is building the market swing structure, minor and sub structure and marks all possible insignificant pivots
This indicator is the alternative version of Mark Structure indicator, I had to create another indicator in order to avoid programming limitation of TreadingView.
This version uses confirmation approach as confirming by body, it means every swing low/high is confirmed when the body (of newly creating swing low/high correspondingly) takes place and intercepts it. the same behaviour is with breaking structure its confirmed only by body.
From trading prospective with this kind of approach we can easily detect manipulations (caused by sweeps) and disregard those manipulation as elements which are breaking the structure. so its extremely useful for those who are trading smart money price actions and basing on swing structure POI
it supports:
- Marking all pivots with labels or join them continuously with trend lines.
- Marking minor and sub structured swings with labels or join them continuously with trend lines. Marking last actual CHoCH and BOS. Minor and substructure are structures inside swing structure and it can differ from the structure of lower timeframe
- Marking swings of swing structure with labels or join them continuously with trend lines.
- Changing bullish and bearish colors of each kind of structures
- Changing pivot labelings
- Changing colors
Remarks:
- Don't expect to have minor and sub structure in each swing waves, its totally fine when you don't have them at all
- Swing structure is the most significant structure and shows real price direction.
- The last swing is not able to be confirmed it tries to build 2 swings that most likely would be either substructure or SMS BOS

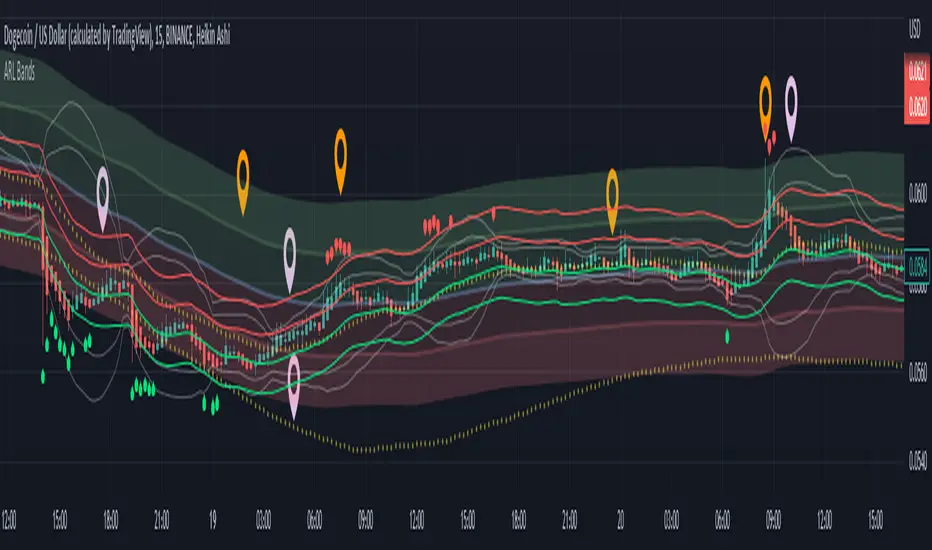
Adaptive Rebound Line Bands (ARL Bands)These bands consist of 4 ARLs (See: Adaptive Rebound Line ('ARL'/AR Line)) that help accurately spot price rebounds.
It is excellent for 15 minute scalping and price-action trading.
See notes in the picture above for more details.
Note: "Top Deviation" is the deviation of the top 'ARL', "High Deviation" is for the high 'ARL', etc.
Elliott Wave Theory [Alerts]This indicator may be one of the first to provide signals & alerts for the Elliott Wave Theory Pattern. Unfortunately, there are few, if any, indicators that are public which allow the Elliott Wave Theory to be plotted+with alerts.
Because this is experimental, I'm going to offer access to it free of charge. Send me a direct message requesting access.
Elliott Wave Theory is a complex chart pattern to learn, and even harder to master. It requires being able to identify the wave lengths of price history and using various tools to plot and assess the price structure in order to find the wave counts. Whilst there are many ways to compute the waves apart of the pattern, there is no universal method that everyone would agree upon. For this indicator, I am using the traditional method.
The different colors represent different cycle types. Using it on a higher timeframe is strongly encouraged for best results.
This version currently provides alerts for the final wave, wave 5. I WILL BE ADDING MORE TO THIS INDICATOR SHORTLY, SEE BELOW:
-Will be adding the other counts to display all the waves
-Will be adding 'correction wave' alerts
-Will be adding 'inverse' pattern alerts
-Will be improving the the labels to include their cycle type
This is not a buy & sell indicator.. This is a TOOL to help analyze the market using Elliott Wave Theory.
The indicator should be used for the following:
-Aiding with EWT analysis
-Helping find potential exit points
-Assist with learning EWT by using this as a template
-Timing trades and improving risk management
-Plotting the overall market

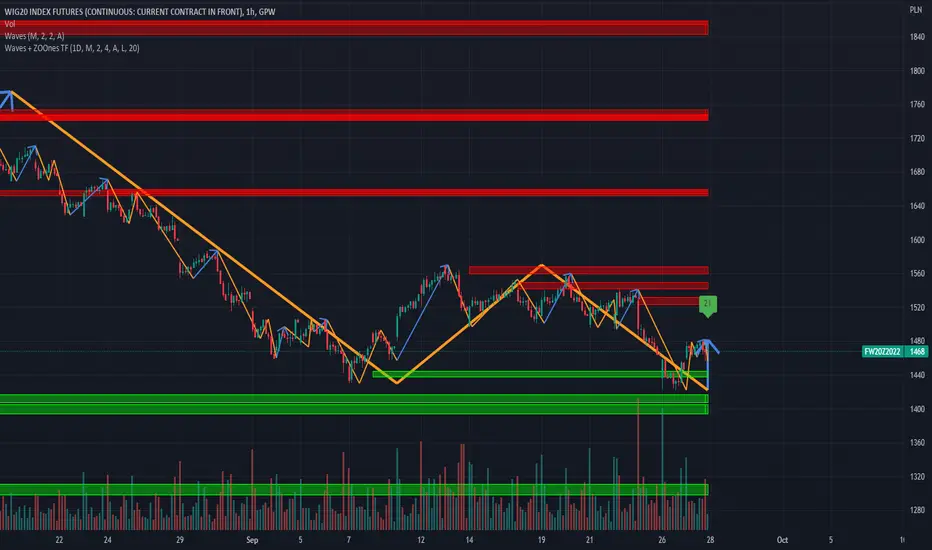
Waves + ZOOnes TimeFrameTrend visualization tool in Wave theory. Unlike Elliot waves, it has a constant pattern length. The formation consists of impulse and 3 corrections.
The script analyzes candle relationships in the currect trend, trend will be continueted until candle are not breaking trend rules.
Currently it supports 2 rulesets/wave variants:
Low - More sensitive (trend will change more ofter).
Meddium - Less sensitive ( trend will change less ofter).
Simultaneous observation of both types allows to detect consolidation before the overlapping movement and increase the probability of indicating the moment of the movement occurrence.
Script with limited access, contact author to get authorization
Features:
- Allow to pick timeframe used for visualization.
- Show Low and Middle type/order waves
- Show support/resistance areas for the Low and Middle type/order waves.
- Types for waves and support areas are picked independently. Script can show Middle Waves with Low Waves support areas.
- Shadow mode that show second wave moved to the wave max/min bars.
- Show historical support/resistance areas that are not valid any more.
Script settings:
Timeframe - Time frame used for visualization. It should be less precise or equal as the chart one. e.g. it can show 1D visualization over 1H chart.
TREND VISUALIZATION
Type - Kind of waves should be drawn.
H(idden) - Do not draw any waves.
L(low) - Draw low waves
M(edium) - Draw medium waves
B(oth) - Draw both low and medium waves
Confirmation - Showing confirmation lavel over current bar If wave direction will not change on this bar
Shadow - Showing second reprezentation of the trend with drawing with the use of minimal and maximal values. It's usefull to determine the delay between the peak and a wave change signal.
Line width - Width of drawn line. Separate setting for Low and Medium trend type.
Color - Color of drawn line. Separate settings for Low and Medium trend type.
Change trend signals - Showing places where alerts are generated (debug feature).
u - trend change to UP
d - trend change to DOWN
U - trand change to UP from the zone
D - trand change to down from the zone
IMPULS VISUALIZATION
Impuls - Picking graphical reprezentation of first bullish arrow.
H - Hidden
F - First
S - Second
A - Auto
Color - Color of the first bullish arrow.
Draw arrow - Turning on/off drawing arrow at the end of the impuls wave.
ZOONES
ZOOnes type - Determines what type of trend is used to designate areas of support.
D - Disabled
L - Low
M - Medium
Only nearest zones - Drawing only one nearest zone above and below current price.
Only nearest potencial zones - Drawing only one nearest potencial zone above and below current price.
Resistance - Set of colors (resistance zone background, resistance zone border, potencial resistance zone background, potencial resistance zone border) used for drawing resistance zones and potencial resistance zones.
Support - Set of colors (support zone background, support zone border, potencial support zone background, potencial support zone border) used for drawing support zones and potencial support zones
Show history - Showing zones in historical data
Show fake potencials - Showing historical potencial zonnes that were rejected (debug purpose).
Double count - Treated support and resistance zoones as one zoone
Zone precision - Determines how many bars are included in area calculation.
Alerts:
Low trend DOWN - When Low trend type is changing from UP to DOWN
Low trend UP - When Low trend type is changing from DOWN to UP
middle trend DOWN - When Middle trend type is changing from UP to DOWN
middle trend UP - When Middle trend type is changing from DOWN to UP
middle trend from ZOOnes DOWN - When Middle trend type is changing from UP to DOWN after hiting resistance area .
middle trend from ZOOnes UP = When Middle trend type is changing from DOWN to UP after hiting support area .
Troubleshooting:
In case of any problems, send error details to the author of the script.
Waves TimeframeCustom timeframe trend wisualization tool in Wave theory. In script setting you can specify based on which timeframe (1D by default) data visaulizaction will be made. It's usefull in short time/day traiding where on the small interval you would like to see more global/bigger interval situation. If it's you case, please check "Waves Pro Trends", that gives posibility to easie check up to 3 different intervals.
Script settings:
• Timeframe – The interval based on which waves are calculated. Script is working correct only for intervals that are equal or more precise than picked here value. In case of picking lower interval than current, error message will appear.
• Type – Type of waves that are drawn:
o H(ide) – Not drawing any waves
o L(ow) – Drawing low level waves
o M(edium) – Drawing mid level waves
o B(oth) – Drawing both low and mid level waves
• Alfred – Showing extra informations about waves in the context of current candle.
• Wave – How script should visualize wave:
o H(ide) - Not drawing waves.
o S(olid line) – Drawng as solid line
o A (Solid line with Arrow) – Drawing as solid line with arrow
o D(otted line) – Drawing as dotted line.
• Shadow – How script should visualise wave shadows. Waves shadow it's a drawing mode in which wave is draw based on it's extrems instead of moment od detection.
o H(ide) - Do not draw any shadows
o S(olid line) – Draw with a solid line
o A (Solid line with Arrow) – Draw as solid line with arrorw
o D(otted line) – Draw as dotted line
• Low line – Color and line width for low level waves
• Medium line – Color and line width for mid level waves
• Impuls – Color and picking impuls mode:
o H(idden) – Do not show impuls
o F(irst) – Impuls is draw starting from the first wave up
o S(econd) – Impuls jis draw starting from the second wave up
o Auto – The algorithm performs an automatic analysis and selects which of the impulse drawing methods presents impulses with greater price dynamics.
CoG RSI Momenum Ichimoku CloudThis indicator is inspired by "RSI ICHIMOKU CLOUD".
Script plots price bars based on selected indicator with Ichimoku Cloud around it.
In my version I have added different oscillators for bar calculations.
Specifically you can choose from:
Center of Gravity(CoG)
Momentum
RSI

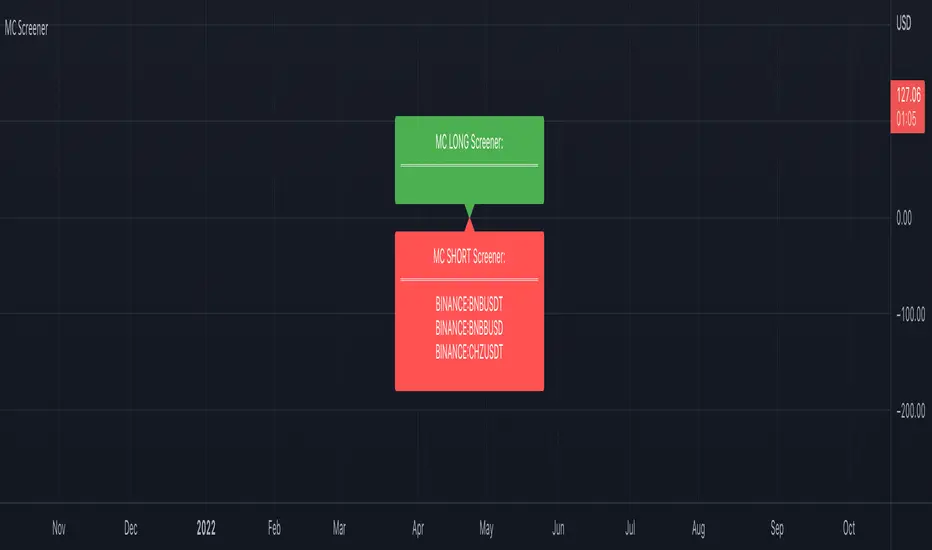
Market Cipher Screener
In recent years, the MarketCipher indicator has become more and more well-known. An expensive indicator that is suitable for trading crypto, but also stocks or Forex. The system works with already known indicators en scripts from Tradingview, but then merged into one working system. The large green and red circles play a major role in this. You can see these as buying or selling moments. I made a script that scans 40 tickers on those red and green circles, without having to buy MarketCipher. When a green or red circle is printed at MarketCipher, it also will appear in this screener. There is a green label for tickers that print a green circle and of course a red label for the tickers that print a red circle.
What's in the script?
- 40 cryptotickers are already included as standard. You can easily adjust this yourself via the wheel.
- Alerts when a new ticker meets the criteria
- The ability to move the labels so that you can load and side-by-side this script multiple times.
A few tips:
- Load the indicator multiple times to screen more tickers.
- The higher the timeframe, the more reliable the direction will be.
- Set an alert so you don't miss any opportunities.
Road map:
- Convert labels to table view.
- In the future table also implement the other components of MarketCipher.
RAS.V2 Strength Index OscillatorHeavily modified version of my previous "Relative Aggregate Strength Oscillator" -Added high/low lines, alma curves,, lrc bands, changed candle calculations + other small things. Replaces the standard RSI indicator with something a bit more insightful.
Credits to @wolneyyy - 'Mean Deviation Detector - Throw Out All Other Indicators ' And @algomojo - 'Responsive Coppock Curve'
And the default Relative Strength Index
The candles are the average of the MFI ,CCI ,MOM and RSI candles, they seemed similar enough in style to me so I created candles out of each and the took the sum of all the candle's OHLC values and divided by 4 to get an average, same as v1 but with some tweaks. Previous Peaks and Potholes visible with the blue horizontal lines which adjust when a new boundary is established. Toggle alma waves or smalrc curves or both to your liking. This indicator is great for calling out peaks and troughs in realtime, although is best when combined with other trusted indicators to get a consensus.

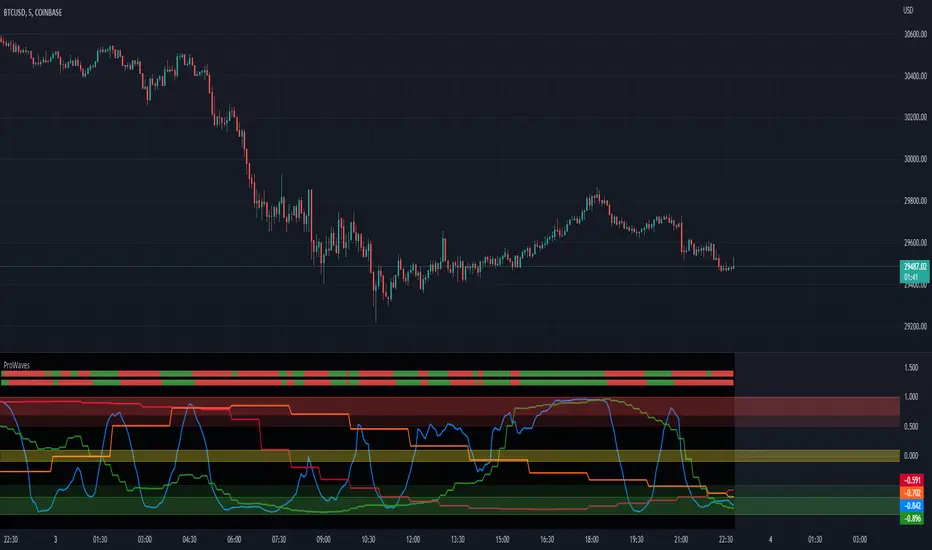
ProWaves - [Soldi]ProWaves
Introducing the latest and greatest tool in the DynaPro Trading Tools! ProWaves is a multi timeframe precision trend tool to help traders identify the waves of the market and trade the convergence, exhaustion points, continuation points of multiple timeframes.
By default you will have a 15m, 1h and 2h Wave on your indicator - this is completely customizable by the user! You can choose up to 3 higher timeframes to display the underlaying wave trend.
How Do I Enter Trades?
To bring ProWaves into a full trading system someone could easily use we have to make a trade trigger system for potential entries - an original and unique Trend Bar system to easily signal a trader that there is an entry present. These trend bars use 2 sensitive weighted moving averages based off the HL2 of the candle, we offset them to create a ribbon like effect to help eliminate any false signals
Include this in your own trading strategy or compile it with DynaPro's other institutional caliber tools!
To use ProWaves effectively you will want to understand wave theory first
This indicator is based off the idea of Elliot wave and fractal cycles of the market, to really understand what this indicator is reading you will need to understand what Elliot Wave is along with fractal cycles in the markets.
What Are The Waves Based On
The waves are primarily a Correlation function to make an oscillated value of "trend", by doing so and measuring this across multiple timeframes we are able to gain a sense of clarity on the tops and bottoms of the markets as well as the trends that take place in between!
NOTE
When the Waves are above/below - 0.5/-0.5 then the wave is in an area of significance for either a reversal or to influence a trend - couple this with the precision of the Trend Bars system then you have a great trading system!
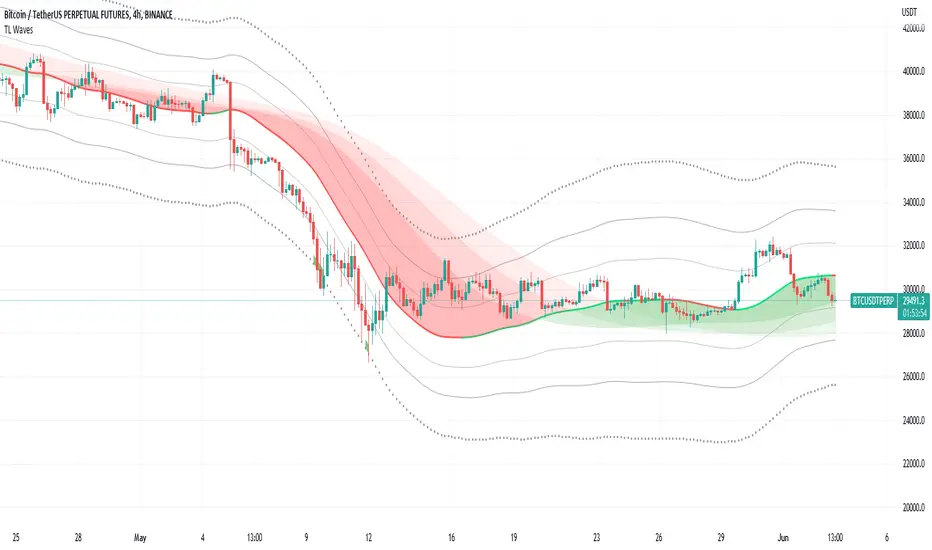
TL WavesI created this indicator inspired by the miyuki waves indicator by eto_miyuki. In my indicator we have 17 types of moving averages which can be selected in the settings.
It is a trend indicator, the base of the wave is a moving average and 4 Average True Range (ATR) Bands derived from the baseline are formed.
There are also 3 moving averages in a guppy style, these 3 moving averages can also be configured.
The moving average options are:
SMA ---> Simple
WMA ---> Weighted
VWMA ---> Volume Weighted
EMA ---> Exponential
DEMA ---> Double EMA
ALMA ---> Arnaud Legoux
HMA ---> Hull MA
SMMA ---> Smoothed
LSMA ---> Least Squares
KAMA ---> Kaufman Adaptive
TEMA ---> Triple EMA
ZLEMA ---> Zero Lag
FRAMA ---> Fractal Adaptive
VIDYA ---> Variable Index Dynamic Average
JMA ---> Jurik Moving Average
T3 ---> Tillson
TRIMA ---> Triangular
All settings are available for changing inputs.
Guppy WavesA lightweight version of the popular "Moving Average Ribbon" or "Guppy" indicators where the visuals are plotted as "waves" rather than moving average lines. As is customary for my indicators, nearly everything about it is user selectable.
Visual Features:
User Customizable Colors
RSI-Based Rainbow Color Scheme
Simple Offset for adjusting transparency
Create great-looking charts very easily
Moving Average Options:
Running (SMoothed) Moving Average (RMA or SMMA ) - very slow/smooth
Simple Moving Average ( SMA )
Exponential Moving Average ( EMA )
Weighted Moving Average ( WMA )
Volume-Weighted Moving Average ( VWMA )
Triple EMA ( TEMA ) - very fast
Exponential Hull Moving Average (EHMA) - Hull with Smoothing (Slower than Hull)
Least Squares Moving Average ( LSMA ) - Simple Linear Regression
Arnaud Legoux Moving Average ( ALMA ) - Adjustable, set offset=1 to be current, offset=0.85 for good smoothing
Hull Moving Average ( HMA ) - very fast
Tillson T3 - very smooth
Donchian Moving Average - plots the average of (lowest, highest) for a given period length
The user can change the source, period, and type of moving average used for every single line on the chart.
Squeeze M + ADX + TTM (Trading Latino & John Carter) by [Rolgui]About this indicator:
This indicator aims to combine two good performing strategies, which can be used separately or together, mainly for investment positions, although it can also be used for intraday trading.
Strategy 1) Squeeze Oscillator and Average Directional Index:
This strategy is taught by Jaime Aibsai, which determines market entries based on reading the direction of the price movement (Directionality of the Oscillator) along with the strength of the Oscillator (Slope of the ADX).
Both tools are configured according to Jaime Abisai's strategy, by default (note that point 23 of the ADX is represented by point 0 on the panel, to make reading easier, its interpretation is not affected). Anyway you can adjust the input data according to your interest.
*You can see this setting in the first panel.
Strategy 2) Squeeze Momentum and Trade The Market Waves:
This strategy can be consulted either in John F. Carter's books or on his website.
This market reading is based on Price Volatility (Bollinger Bands and Keltner Channels interaction) and its Trend (Exponential Moving Averages), showing entries at times when price volatility is low and taking filtering active trend using T.T.M. Waves.
To configure the indicator in the same way that Carter does, it would be enough to turn off the ADX, turn on the Squeeze Momentum signals along with the T.T.M. Waves, and importantly, change the Linear Momentum value to 12 (this configuration can be found in his book).
*You can see this setting in the second panel.
Why this indicator?
I've added and removed the above flags as I needed to query them (which became tedious for me). The main objective of having merged them into one is to make their reading more agile and comfortable and thus improve the decision-making capacity of the trader who wishes to use them.
Credits and Acknowledgments:
I would like to give credits to other authors, for the sections of code that I have used to make this technical indicator. Thanks to @LazyBear, @matetaronna, @jombie and @joren for contributing to the community and keeping their code open. It is priceless!
Feel free to combine and practice your trading with both strategies, personally, they improved my profitability and this is why I recommend researching more about them. I've been using it for crypto investing, let me know if it's worth for you on stock market!
If you have any questions or suggestions you can leave it in the comments!
Greetings!

WavesTrend visualization tool in Wave theory. Unlike Elliot waves, it has a constant pattern length. The formation consists of impulse and 3 corrections.
The script analyzes candle relationships in the currect trend, trend will be continueted until candle are not breaking trend rules.
Currently it supports 2 rulesets/wave variants:
Low - More sensitive (trend will change more ofter).
Meddium - Less sensitive ( trend will change less ofter).
Simultaneous observation of both types allows to detect consolidation before the overlapping movement and increase the probability of indicating the moment of the movement occurrence.
Trend visualization tools is a starting point that can be conected with different technics, to achive better performance.
"Waves" is the primary script of the Waves script series with test free period that consists of:
- Waves + XABCD
- Waves + ZOOnes
- Waves Change Signals
- ... and more in developement.
Features:
- Show Low and Middle type/order waves
- Draw both Wave types at once.
- Shadow mode that show second wave moved to the wave max/min bars.
- "Alfred" assist - Label notifications about trend confirmations or changes.
Script settings:
Trend visualization
Type - Trend visualization types:
H - Hidden
L - Low
M - Medium
B - Both
Alfred - AI assistant that informs about wave confirmation or trend changes (With "Both" type Alfred will monit only Medium wave).
Shadow - Showing second reprezentation of the trend with drawing with the use of minimal and maximal values. It's usefull to determine the delay between the peak and a wave change signal.
Low/Med Line width/color - Width/color of drawn line. Separate setting for Low and Medium trend type.
Impuls visualization
Impuls - Drawing impuls modes:
H - Hidden
F - First
S - Second
A - Auto
Impuls color - Color of the first bullish arrow.
Draw arrow - Drawing arrow at the end of the first bullish arrow.
Extensions
Waves + XABCD - Showing base information about Waves + XABCD script
Waves + ZOOnes - Showing base information about Waves + ZOOnes script
Waves Change Signals - Showing based information about Waves Change Signals script.
more in developement...
Troubleshooting:
In case of any problems, send error details to the author of the script.

SARWThis indicator aims to indicate the correlation between two assets(Current and Base), it does NOT show entries or help your chart analysis directly.
The main features of this Correlation indicator is :
Correlation type : Direct Correlation | Inverse Correlation | No Correlation
Correlation Percentage : as its name, it calculate the Correlation Percentage between Current and base assets if exist
How to use: Chose the base asset (default: bitcoin) and open any other chart to be the other -Current- asset
inputs:
Max Lookback length : how many candles will be included in the scan.
Swing intensity : How many candle should be counted to confirm a Swing, If you are confused leave it as its default.
Base Asset : The base asset to calculate the current asset correlation with.
Important Notes:
As I promised, the previous correlation indicator used each candle alone, while this one uses waves and swings.
The Current asset has more power over the base, because it compares the Base to current, but not the opposite((E.g. if you want to check if some coin have correlation with bitcoin, it's better to use bitcoin and put the other coin name in the input field)).
For any notes on the indicator to be edited, or for another indicator ideas please comment.

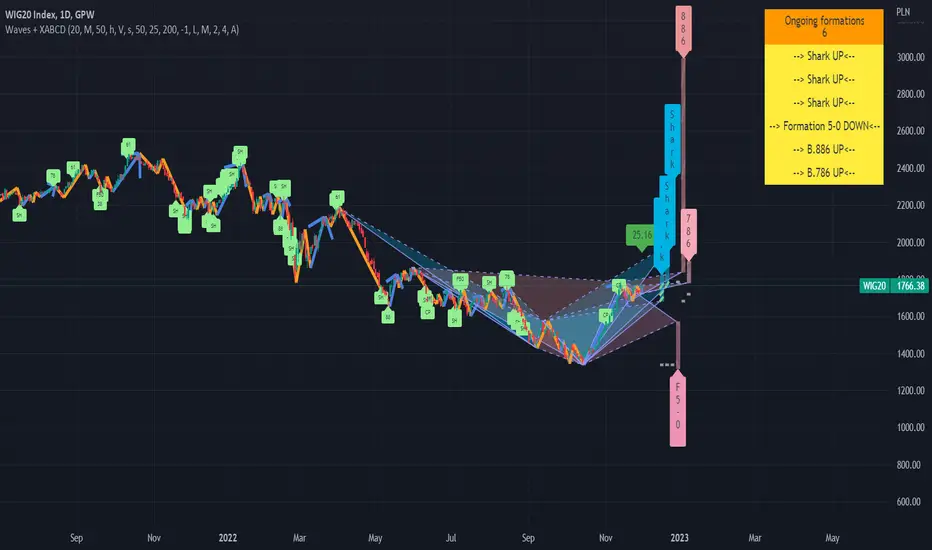
Waves + XABCD v.1.0Advanced harmonic patterns scanner optimazed for Wave theory for Low or Medium wave rules.
It finds on the candle chart:
- Existing pattern with realized target in historic data.
- Potencial patterns with realized and potencial targets.
- Estimated patterns that may become potencial with their potencial targets (it updates instantly with the price change (before closing the bar). Such estimation can be confirmed or invalidated in minutes, but can give an advantage and be usefull on higher intervals.
Supports modified traiding patterns:
B.38
B.50
B.618
B.786
B.886
Shark
Cypher
Formation 5-0
Script with limited access, contact author to get authorization
Existing patterns visualization:
Potencial pattern visualization:
On the chart we can see few potencial patterns ( Sharks & Cyphers ). First target of first formation was realized and trend was changed. Chances of reaching targets in each pattern kind we can check by moving mouse over the label. tooltip will show:
- how many patterns are in historical data on this chart
- targets with % of cases in historical data on this chart when target was reached.
WARNING !!!
For each scanner configration and "D point limit" we can get different values. Also numbers of bars (traidingView account type) will change results. You can contact us for details how to optimaze settings for better performance.
Estimated patterns visualization:
On the chart we can see 2 estimated patterns based on current up trend. We can see that trend was already confirmed and will not change in this bar, but "if he had changed" the patterns will be accepted as potencial giving more arguments for move down.
Patterns performance data:
Below we can see chart with stats params set to "%". In the table on right we can see how many patterns were detected on the chart for the current configuration and how many of them reached particular level within the current D limit.
For each scanner configration and "D point limit" we can get different values. Also numbers of bars (traidingView account type) will change results. You can contact us for details how to optimaze settings for better performance.
Script settings:
| XABCD Scanner |
XABC dist limit - Specifies the maximum distance between successive pattern vertex .
Trend type - Specify which wave type should be used.
precision ‰ - It determines the maximum deviations from the conditions that must be met by the patterns. It also causes enlarge / blur of targets.
B.38, B.50, B.618, B.786, B.886, Shark, Cypher, Formation 5-0 - Filter specifying which patterns should be detected and allowing to set pattern color.
| XABCD Scanner Visualization |
You can configure visualziation for each pattern type separatelu:
Existing - Patterns in the historic data
Potencial - Patterns with known XABC vertrex, but without confirmed D.
Estimated - Dynamic patterns with not confirmed C vertex . After extreme formed they can be confirmed or invalidated.
Shape - Check if you want to see pattern shape.
Target - Check if you want to see posibble targets (In case of high precision value, lines become diagonal).
Label - Decide what format should have label. You can pick from: Fullname, shortname, vertical, hidden.
Targets: Filled/Not filled - Allow to change colors used for targets visualization.
Fill: targets/shape - Transparency param of the drawings.
| XABCD Scanner Statistics |
D point limit - A treshold for filter that counts statistics. If D will be reach after passing treshold it will not count as success in the statistics.
over limit color - Color used for patterns line visualization if D is over limit set in previous point.
pattern filter checkbox - Showing dialog with list of potencial patterns.
pattern filter - Field allowing to pick potencial pattern to show.
stats - Shows/hides stats table.
| Trend visualization |
Type - Specify switch what kind of wave should be drawn.
Confirmation - Draw "C" label if wave was confirmed and will not change in this bar. If wave is changing on this bar shows distance from the treshold.
Shadow - Draws second trendline based on the wave extremes.
Low/Mid line width and color - Wave drawing configuration.
| Impuls visualization |
Impuls - Picking graphical reprezentation of first bullish arrow.
Impuls color - Color of the first bullish arrow.
Draw arrow - Drawing arrow on the end of impuls wave.
Troubleshooting:
In case of any problems, please contact the author of the script. To improve speed of solving problem first check if script is drawn, and if there is a "!" character after script params. If you can see "!" character, move cursor over it for detail. Send message with error details, ticker and interval to us. The more precise will be your description the faster we will be able to help you.
Wave MasterThis indicator is built on Stochastics and pulls data from multiple timeframes to give you a birds eye view on where your asset is at a point in time. There are several factors that go into this indicator:
OVERBOUGHT
When all waves have all migrated to the overbought area, this is a high probability area to go short or take profit off the table.
OVERSOLD
When all waves have migrated to the oversold area, typically this indicates a high probability place to take a long position or purchase some equity.
VISUAL AIDS
Several visual aids have been included in this indicator to assist you, as a trader, to help you easily see what is going on.
Upper/Lower Dots - Green/Yellow/Red dots indicate a cross has occurred. Each color corresponding with the wave in the indicator
Color Coded Background - Red indicates green/yellow wave have gone into overbought territory and green background indicates green/yellow wave have gone into oversold territory. White slices in the background indicate the green has crossed (while in overbought/oversold)
12h/daily candle confirmation - When the 12hr (crypto) or daily (stocks) have crossed, a bright green or bright red candle will appear in the chart to help you indicate a potential for a change in trend
Ichimoku Cloud OscillatorThis script shows Ichimoku values in a different manner. While studying Ichimoku one thing stuck out to me and that is that the Kijun-Sen line is considered to be the equilibrium of the market, it acts like a magnet and price always returns to it. Taking this into account I made a script that plots the distance from equilibrium as an oscillator.
With that value being an oscillator it allows for some analysis that would have been harder to do looking at the normal ichimoku chart. For example smoothing the value and comparing the distance to the average distance to see if the market reached an extremity (too far from equilibrium). I added a bollinger band for those who are interested in analysing the value in that way but in my experience I do not use it except for noticing if market spiked outside of the band (green and red dots).
It is advised to use this oscillator as a trend analysis tool the same way you would use a money flow. Below a breakdown of current features
- Disequilibrium1: The white sharp wave is the raw distance from Kijun with settings to smooth it out using a WMA
- Disequilibrium2: The blue smooth wave is the smooth distance from Kijun with settings to smooth it further out using a WMA
- Yellow line: The distance of Tenkan-Sen from Kijun-Sen which in alot of ichimoku strategys act as a trend filter or a crossover as market change.
- Green and red zone: The slope of the kumo cloud, color coded to see if kumo is red or green. Use it in the same way you would use money flow on market cypher, it is a longer term trend strength indicator and like all smoothed values it lags behind. You can use this to decide which direction to trade in but not as a signal on it's own.
- Bollinger Band: Acts the same way a bollinger band does, use this to analyse the wave structure, especialy the middle line the same way you would use Disequilibrium2, if the waves are a good distance from this line market can be overbought oversold or it is just a good indication that the trend is strong. Outer bands should be your warning bands as the waves tend to jump back to the middle line when touching those.
Would love some feedback on this as I do not think this can be used for divergences but would like to hear some possible patterns/strategys.
My current strategy is noticing an increasing wave after a squeeze (waves keep getting smaller untill a large trend happens, wave no longer goes to middle and keeps expanding). When I notice this I wait for the white wave to enter the blue and touch the mid bollinger line (small pullback during strong trend) and open a trade in the direction of the trend. I use the green and red zone to decide if the long term direction tells the same to get confluence.
