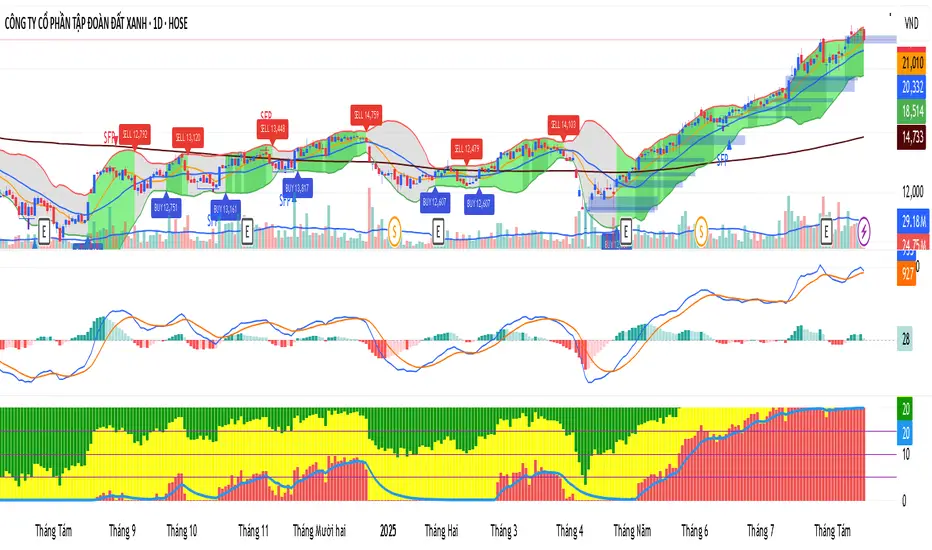
Advanced Trading System - [WOLONG X DBG]Advanced Multi-Timeframe Trading System
Overview
This technical analysis indicator combines multiple established methodologies to provide traders with market insights across various timeframes. The system integrates SuperTrend analysis, moving average clouds, MACD-based candle coloring, RSI analysis, and multi-timeframe trend detection to suggest potential entry and exit opportunities for both swing and day trading approaches.
Methodology
The indicator employs a multi-layered analytical approach based on established technical analysis principles:
Core Signal Generation
SuperTrend Engine: Utilizes adaptive SuperTrend calculations with customizable sensitivity (1-20) combined with SMA confirmation filters to identify potential trend changes and continuations
Braid Filter System: Implements moving average filtering using multiple MA types (McGinley Dynamic, EMA, DEMA, TEMA, Hull, Jurik, FRAMA) with percentage-based strength filtering to help reduce false signals
Multi-Timeframe Analysis: Analyzes trend conditions across 10 different timeframes (1-minute to Daily) using EMA-based trend detection for broader market context
Advanced Features
MACD Candle Coloring: Applies dynamic 4-level candle coloring system based on MACD histogram momentum and signal line relationships for visual trend strength assessment
RSI Analysis: Identifies potential reversal areas using RSI oversold/overbought conditions with SuperTrend confirmation
Take Profit Analysis: Features dual-mode TP detection using statistical slope analysis and Parabolic SAR integration for exit timing analysis
Key Components
Signal Types
Primary Signals: Green ▲ for potential long entries, Red ▼ for potential short entries with trend and SMA alignment
Reversal Signals: Small circular indicators for RSI-based counter-trend possibilities
Take Profit Markers: X-cross symbols indicating statistical TP analysis zones
Pullback Signals: Purple arrows for potential trend continuation entries using Parabolic SAR
Visual Elements
8-Layer MA Cloud: Customizable moving average cloud system with 3 color themes for trend visualization
Real-Time Dashboard: Multi-timeframe trend analysis table showing bullish/bearish status across all timeframes
Dynamic Candle Colors: 4-intensity MACD-based coloring system (ranging from light to strong trend colors)
Entry/SL/TP Labels: Automatic calculation and display of suggested entry points, stop losses, and multiple take profit levels
Usage Instructions
Basic Configuration
Sensitivity Setting: Start with default value 6
Increase (7-15) for more frequent signals in volatile markets
Decrease (3-5) for higher quality signals in trending markets
MA Filter Type: McGinley Dynamic recommended for smoother signals
Filter Strength: Set to 80% for balanced filtering, adjust based on market conditions
Signal Interpretation
Long Entry: Green ▲ suggests when price crosses above SuperTrend with bullish SMA alignment
Short Entry: Red ▼ suggests when price crosses below SuperTrend with bearish SMA alignment
Reversal Opportunities: Small circles indicate RSI-based counter-trend analysis
Take Profit Zones: X-crosses mark statistical TP areas based on slope analysis
Dashboard Analysis
Green Cells: Bullish trend detected on that timeframe
Red Cells: Bearish trend detected on that timeframe
Multi-Timeframe Confluence: Look for alignment across multiple timeframes for stronger signal confirmation
Risk Management Features
Automatic Calculations
ATR-Based Stop Loss: Dynamic stop loss calculation using ATR multiplier (default 1.9x)
Multiple Take Profit Levels: Three TP targets with 1:1, 1:2, and 1:3 risk-reward ratios
Position Sizing Guidance: Entry labels display suggested price levels for order placement
Confirmation Requirements
Trend Alignment: Requires SuperTrend and SMA confirmation before signal generation
Filter Validation: Braid filter must show sufficient strength before signals activate
Multi-Timeframe Context: Dashboard provides broader market context for decision making
Optimal Settings
Timeframe Recommendations
Scalping: 1M-5M charts with sensitivity 8-12
Day Trading: 15M-1H charts with sensitivity 6-8
Swing Trading: 4H-Daily charts with sensitivity 4-6
Market Conditions
Trending Markets: Reduce sensitivity, increase filter strength
Ranging Markets: Increase sensitivity, enable reversal signals
High Volatility: Adjust ATR risk factor to 2.0-2.5
Advanced Features
Customization Options
MA Cloud Periods: 8 customizable periods for cloud layers (default: 2,6,11,18,21,24,28,34)
Color Themes: Three professional color schemes plus transparent option
Dashboard Position: 9 positioning options with 4 size settings
Signal Filtering: Individual toggle controls for each signal type
Technical Specifications
Moving Average Types: 21 different MA calculations including advanced types (Jurik, FRAMA, VIDA, CMA)
Pullback Detection: Parabolic SAR with customizable start, increment, and maximum values
Statistical Analysis: Linear regression slope calculation for trend-based TP analysis
Important Limitations
Lagging Nature: Some signals may appear after potential entry points due to confirmation requirements
Ranging Markets: May produce false signals during extended sideways price action
High Volatility: Requires parameter adjustment during news events or unusual market conditions
Computational Load: Multiple timeframe analysis may impact performance on slower devices
No Guarantee: All signals are suggestions based on technical analysis and may be incorrect
Educational Disclaimers
This indicator is designed for educational and analytical purposes only. It represents a technical analysis tool based on mathematical calculations of historical price data and should not be considered as financial advice or trading recommendations.
Risk Warning: Trading involves substantial risk of loss and is not suitable for all investors. Past performance of any trading system or methodology is not necessarily indicative of future results. The high degree of leverage can work against you as well as for you.
Important Notes:
Always conduct your own analysis before making trading decisions
Use appropriate position sizing and risk management strategies
Never risk more than you can afford to lose
Consider your investment objectives, experience level, and risk tolerance
Seek advice from qualified financial professionals when needed
Performance Disclaimer: Backtesting results do not guarantee future performance. Market conditions change constantly, and what worked in the past may not work in the future. Always paper trade new strategies before risking real capital.
Wellenanalyse

Apex Edge – Wolfe Wave HunterApex Edge – Wolfe Wave Hunter
The modern Wolfe Wave, rebuilt for the algo era
This isn’t just another Wolfe Wave indicator. Classic Wolfe detection is rigid, outdated, and rarely tradable. Apex Edge – Wolfe Wave Hunter re-engineers the pattern into a modern, SMC-driven model that adapts to today’s liquidity-dominated markets. It’s not about drawing pretty shapes – it’s about extracting precision entries with asymmetric risk-to-reward potential.
🔎 What it does
Automatic Wolfe Wave Detection
Identifies bullish and bearish Wolfe Wave structures using pivot-based logic, symmetry filters, and slope tolerances.
Channel Glow Zones
Highlights the Wolfe channel and projects it forward into the future (bars are user-defined). This allows you to see the full potential of the trade before price even begins its move.
Stop Loss (SL) & Entry Arrow
At the completion of Wave 5, the algo prints a Stop Loss line and a tiny entry arrow (green for bullish, red for bearish). but the colours can be changed in user settings. This is the “execution point” — where the Wolfe setup becomes tradable.
Target Projection Lines
TP1 (EPA): Derived from the traditional 1–4 line projection.
TP2 (1.272 Fib): Optional secondary profit target.
TP3 (1.618 Fib): Optional extended target for large runners.
All TP lines extend into the future, so you can track them as price evolves.
Volume Confirmation (optional)
A relative volume filter ensures Wave 5 is formed with meaningful market participation before a setup is confirmed.
Alerts (ready out of the box)
Custom alerts can be fired whenever a bullish or bearish Wolfe Wave is confirmed. No need to babysit the charts — let the script notify you.
⚙️ Customisation & User Control
Every trader’s market and style is different. That’s why Wolfe Wave Hunter is fully customisable:
Arrow Colours & Size
Works on both light and dark charts. Choose your own bullish/bearish entry arrow colours for maximum visibility.
Tolerance Levels
Adjust symmetry and slope tolerance to refine how strict the channel rules are.
Tighter settings = fewer but cleaner zones.
Looser settings = more frequent setups, but with slightly lower structural quality.
Channel Glow Projection
Define how many bars forward the channel is drawn. This controls how far into the future your Wolfe zones are extended.
Stop Loss Line Length
Keep the SL visible without it extending infinitely across your chart.
Take Profit Line Colors
Each TP projection can be styled to your preference, allowing you to clearly separate TP1, TP2, and TP3.
This isn’t a one-size-fits-all tool. You can shape Wolfe detection logic to match the pairs, timeframes, and market conditions you trade most.
🚀 Why it’s different
Classic Wolfe waves are rare — this script adapts the model into something practical and tradeable in modern markets.
Liquidity-aligned — many setups align with structural sweeps of Wave 3 liquidity before driving into profit.
Entry built-in — most Wolfe scripts only draw the structure. Wolfe Wave Hunter gives you a precise entry point, SL, and projected TPs.
Backtest-friendly — you’ll quickly discover which assets respect Wolfe waves and which don’t, creating your own high-probability Wolfe watchlist.
⚠️ Limitations & Disclaimer
Not all markets respect Wolfe Waves. Some FX pairs, metals, and indices respect the structure beautifully; others do not. Backtest and create your own shortlist.
No guaranteed sweeps. Many entries occur after a liquidity sweep of Wave 3, but not all. The algo is designed to detect Wolfe completion, not enforce textbook liquidity rules.
Probabilistic, not predictive. Wolfe setups don’t win every time. Always use risk management.
High-RR focus. This is not a high-frequency tool. It’s designed for precision, asymmetric setups where risk is small and reward potential is large.
✅ The Bottom Line
Apex Edge – Wolfe Wave Hunter is a modern reimagination of the Wolfe Wave. It blends structural geometry, liquidity dynamics, and algo-driven execution into a single tool that:
Detects the pattern automatically
Provides SL, entry, and TP levels
Offers alerts for hands-off trading
Allows deep customisation for different markets
When it hits, it delivers outstanding risk-to-reward. Backtest, refine your tolerances, and build your watchlist of assets where Wolfe structures consistently pay.
This isn’t just Wolfe detection — it’s Wolfe trading, rebuilt for the modern trader.
Developer Notes - As always with the Apex Edge Brand, user feedback and recommendations will always be respected. Simply drop us a message with your comments and we will endeavour to address your needs in future version updates.

Buy and Sell Signals (Altius Consulting)Generates Buy and Sell signals based on MACD and RSI.
- Plots MACD, Signal & Histogram (optional pane).
- Buy Label (toggle): Bullish MACD crossover + RSI < threshold (no convergence requirement).
- Sell Label: Bearish MACD crossover (MACD crosses below Signal) prints a SELL tag.
- Alert: Provided for convergence-based buy condition (add your own for simple crossover if desired).

LSMAsThis indicator calculates and plots two Least Squares Moving Averages (LSMA) based on different lengths and a Smoothed Moving Average (SMMA) of the longer LSMA.
Inputs
lengthA : Period length for the first, longer LSMA.
lengthB : Period length for the second, shorter LSMA.
signAl : Signal period used in SMMA smoothing.
Calculations
LSMA-A and LSMA-B : Calculates the linear regression (least squares) of source over lengthA and lengthB respectively, with no offset. These represent two LSMAs, one slow and one fast.
SMMA : This is a smoothed moving average of the longer LSMA (LSMA-A).
Purpose
This indicator helps traders identify trend directions and momentum by using two least squares regression lines of different lengths to capture short- and long-term trends in price. The SMMA smoothing of the longer LSMA may be used as a signal or confirmation line to reduce noise and produce smoother signals.
It generates buy and sell signals based on the intersection of the LSMA-A and SMMA. If the LSMA-A crosses the SMMA upwards, a BUY signal is generated; if it crosses the SMMA downwards, a SELL signal is generated.
The LSMA-B, which is short-term, can be used for wave analysis. When a peak forms, a high is observed on the chart, and when a valley forms, a low is observed. This allows us to determine whether the wave is rising or falling.
Summary
Two LSMAs are calculated: one slow (lengthA), one fast (lengthB).
A smoothed moving average (SMMA) of the slow LSMA is computed using the signal length (signAl).
All three curves are overlaid on the price chart for visual trend and momentum analysis.

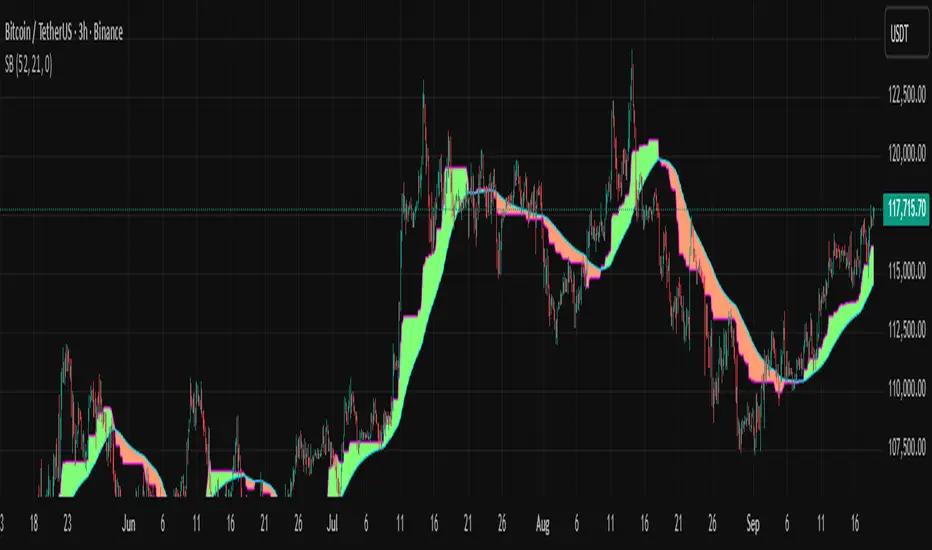
Smoothed Basis Overview and Purpose
The script calculates a smoothed mid-range basis between the highest and lowest prices over a specified period, then applies a smoothing function (smoothed moving average) to show the trend direction or momentum in a less noisy way. The area between the basis and its smoothed value is color-filled to visually highlight when the basis is above or below the smoothed average, signaling potentially bullish or bearish momentum.
Indicator Setup
length = Period length for calculating the highest and lowest values.
signal = Smoothing period used to smooth the basis.
offset =Optional horizontal shift to the plots (default 0).
Core Calculations
lower = Finds the lowest low over the past length bars.
upper = Finds the highest high over the past length bars.
basis = Calculates the midpoint between the highest and lowest.
Smoothing Calculation (Smoothed Moving Average - SMMA)
Declares smma as 0.0 initially. If the previous smma value is not available (like on the first bar), initializes with a simple moving average of basis over signal bars. Else applies formula
which gives a smoother version of basis which reacts less to sudden changes.
Plotting and Color Fill
Plots the raw basis line and smoothed basis line .
Fills the area between the basis and smoothed basis lines:
Greenish fill if the basis is above the smoothed value (potentially bullish).
Reddish fill if the basis is below the smoothed value (potentially bearish).
Interpretation and Use
The indicator visually shows where price ranges are shifting by tracking the midpoint between recent highs and lows.
The smoothed basis serves as a trend or momentum filter by dampening noise in the basis line.
When the basis is above the smoothed line (green fill), it signals upward momentum or strength; below it (red fill) suggests downward momentum or weakness.
The length and signal parameters allow tuning for different timeframes or asset volatility.
In summary, this code creates a custom smoothed oscillator based on the midpoint range of price extremes, highlighting trend changes via color fills and smoothening price action noise with an SMMA.
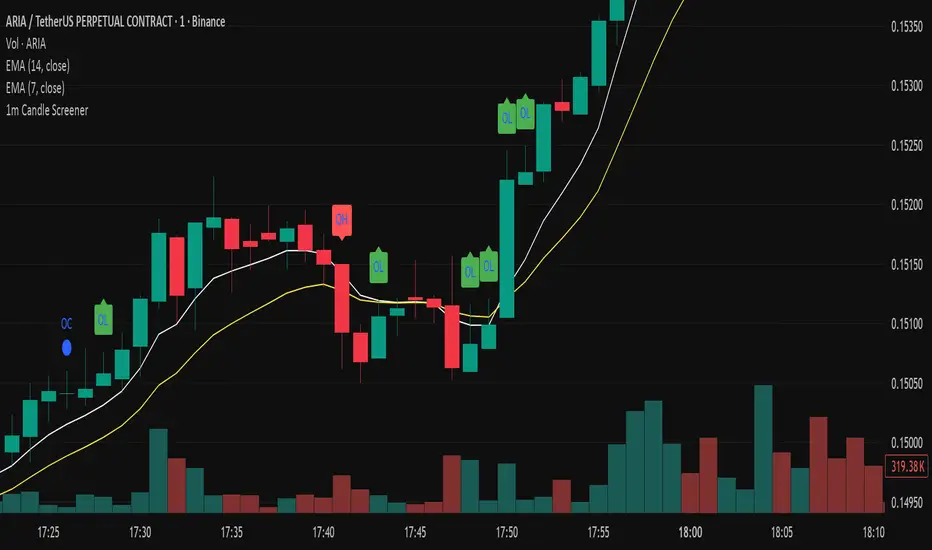
Precision Candle Marker – OL/OH/OC ScreenerThis indicator highlights high-probability precision candles on any perpetual contract, designed especially for scalpers and short-term traders.
It marks three unique candle setups on the 1-minute chart (works on other timeframes too):
🟢 Open = Low (OL) → Strong bullish momentum, buyers took control instantly.
🔴 Open = High (OH) → Strong bearish momentum, sellers took control instantly.
🔵 Open = Close (OC) → Doji / indecision candle, potential reversal or continuation signal.
Use cases:
Identify breakout entry points in uptrend/downtrend.
Filter noise and focus on precision candles.
Combine with trend indicators (EMA, VWAP, RSI) for confirmation.
This tool is best suited for scalping perpetual contracts (e.g., BTCUSDT, ETHUSDT) but works on any symbol and timeframe.
Adaptive Gap Bands - DolphinTradeBot1️⃣ Overview
Adaptive Gap Bands is a momentum indicator that measures the percentage difference between fast and slow moving averages. This helps identify potential overbought or oversold zones.
The goal is to analyze “gap” behaviors within a trend and generate clearer entry–exit signals.
Since the bands are anchored to the slow moving average, they are more sensitive to the trend direction, making signals stronger in line with the prevailing trend.
📌 Signals do not repaint — once confirmed, they remain fixed on the chart.
2️⃣ How It Works ?
The indicator tracks the distance between fast and slow MAs.
The indicator measures the percentage gap between the fast and slow moving averages, relative to the slow MA.
Each time the gap reaches a new extreme during a swing, that value is stored.
When the averages cross, the stored values from the last N swings (defined by Swing Count) are collected.
These gap values are then averaged to create a smoother and more adaptive reference.
The bands are built by multiplying this average gap with the % Multiplier and projecting it around the slow MA.
3️⃣ How to Use It ?
Add the script to your chart.
Green label → potential Long signal.
Red label → potential Short signal.
Signals often appear when price moves outside the adaptive bands, showing extreme momentum.
Can also be used as a reference tool in manual trades to set profit/loss expectations.
By comparing upward vs. downward gaps, it can help analyze and confirm the dominant trend direction.
4️⃣⚙️ Settings
Swing Count → Number of past swings considered.
% Multiplier → Adjusts band width (narrower or wider).
MA Lengths & Types → Choose fast and slow moving averages (EMA, SMA, RMA, etc.).

Guppy MMA [Alpha Extract]A sophisticated trend-following and momentum assessment system that constructs dynamic trader and investor sentiment channels using multiple moving average groups with advanced scoring mechanisms and smoothed CCI-style visualizations for optimal market trend analysis. Utilizing enhanced dual-group methodology with threshold-based trend detection, this indicator delivers institutional-grade GMMA analysis that adapts to varying market conditions while providing high-probability entry and exit signals through crossover and extreme value detection with comprehensive visual mapping and alert integration.
🔶 Advanced Channel Construction
Implements dual-group architecture using short-term and long-term moving averages as foundation points, applying customizable MA types to reduce noise and score-based averaging for sentiment-responsive trend channels. The system creates trader channels from shorter periods and investor channels from longer periods with configurable periods for optimal market reaction zones.
// Core Channel Calculation Framework
maType = input.string("EMA", title="Moving Average Type", options= )
// Short-Term Group Construction
stMA1 = ma(close, st1, maType)
stMA2 = ma(close, st2, maType)
// Long-Term Group Construction
ltMA1 = ma(close, lt1, maType)
ltMA2 = ma(close, lt2, maType)
// Smoothing Application
smoothedavg = ma(overallAvg, 10, maType)
🔶 Volatility-Adaptive Zone Framework
Features dynamic score-based averaging that expands sentiment signals during strong trend periods and contracts during consolidation phases, preventing false signals while maintaining sensitivity to genuine momentum shifts. The dual-group averaging system optimizes zone boundaries for realistic market behavior patterns.
// Dynamic Sentiment Adjustment
shortTermAvg = (stScore1 + stScore2 + ... + stScore11) / 11
longTermAvg = (ltScore1 + ltScore2 + ... + ltScore11) / 11
// Dual-Group Zone Optimization
overallAvg = (shortTermAvg + longTermAvg) / 2
allMAAvg = (shortTermAvg * 11 + longTermAvg * 11) / 22
🔶 Step-Like Boundary Evolution
Creates threshold-based trend boundaries that update on smoothed average changes, providing visual history of evolving bullish and bearish levels with performance-optimized threshold management limited to key zones for clean chart presentation and efficient processing.
🔶 Comprehensive Signal Detection
Generates buy and sell signals through sophisticated crossover analysis, monitoring smoothed average interaction with zero-line and thresholds for high-probability entry and exit identification. The system distinguishes between trend continuation and reversal patterns with precision timing.
🔶 Enhanced Visual Architecture
Provides translucent zone fills with gradient intensity scaling, threshold-based historical boundaries, and dynamic background highlighting that activates upon trend changes. The visual system uses institutional color coding with green bullish zones and red bearish zones for intuitive market structure interpretation.
🔶 Intelligent Zone Management
Implements automatic trend relevance filtering, displaying signals only when smoothed average proximity warrants analysis attention. The system maintains optimal performance through smart averaging management and historical level tracking with configurable MA periods for various market conditions.
🔶 Multi-Dimensional Analysis Framework
Combines trend continuation analysis through threshold crossovers with momentum detection via extreme markers, providing comprehensive market structure assessment suitable for both trending and ranging market conditions with score-normalized accuracy.
🔶 Advanced Alert Integration
Features comprehensive notification system covering buy signals, sell signals, strong bull conditions, and strong bear conditions with customizable alert conditions. The system enables precise position management through real-time notifications of critical sentiment interaction events and zone boundary violations.
🔶 Performance Optimization
Utilizes efficient MA smoothing algorithms with configurable types for noise reduction while maintaining responsiveness to genuine market structure changes. The system includes automatic visual level cleanup and performance-optimized visual rendering for smooth operation across all timeframes.
This indicator delivers sophisticated GMMA-based market analysis through score-adaptive averaging calculations and intelligent group construction methodology. By combining dynamic trader and investor sentiment detection with advanced signal generation and comprehensive visual mapping, it provides institutional-grade trend analysis suitable for cryptocurrency, forex, and equity markets. The system's ability to adapt to varying market conditions while maintaining signal accuracy makes it essential for traders seeking systematic approaches to trend trading, momentum reversals, and sentiment continuation analysis with clearly defined risk parameters and comprehensive alert integration.

RSI Divergence + Hidden RSI Divergence + Hidden (TV-like pairing, final)
What it does
This indicator plots RSI and automatically detects both regular and hidden divergences by pairing RSI pivots with price pivots. It supports a TradingView-like loose pairing (within a user-defined bar tolerance) and a strict same-bar pairing. Detected signals are drawn with lines and optional labels on the RSI pane for quick visual verification.
Divergence logic
Regular Bullish (label: Bull)
Price makes a lower low while RSI makes a higher low → potential upward reversal.
Regular Bearish (label: Bear)
Price makes a higher high while RSI makes a lower high → potential downward reversal.
Hidden Bullish (label: H_Bull)
Price makes a higher low while RSI makes a lower low → trend-continuation bias upward.
Hidden Bearish (label: H_Bear)
Price makes a lower high while RSI makes a higher high → trend-continuation bias downward.
All conditions use pivot-to-pivot comparisons with optional equality tolerance for price and RSI to reduce false “equal” mismatches.
Pairing modes
TV-like
Pairs the latest price and RSI pivots if their pivot bars occur within ±tolBars.
A lightweight “pending” buffer allows pairing a newly detected pivot with a recent opposite pivot that arrived a few bars earlier/later (within tolerance).
Same Bar
Price and RSI pivots must occur on the exact same bar to form a pair.
Key inputs
RSI Source & Length: srcRsi, rsiLen (default 14). RSI line and reference levels (70/50/30) can be shown/hidden.
Pivot Window: leftBars, rightBars for both price and RSI pivots.
Pairing: pairMode = TV-like or Same Bar; tolBars for bar tolerance (TV-like only).
Price Pivot Basis: priceMode = High/Low (default) or Close.
Equality Tolerance:
allowEqual (use >=/<=),
priceEpsTks (ticks) for price equality slack,
rsiEps (points) for RSI equality slack.
Visibility: showRSI, showRegular, showHidden, showLabels.
Visuals
Lines (on RSI):
Regular Bearish: red
Regular Bullish: lime
Hidden Bearish: orange
Hidden Bullish: teal
Labels (optional): "Bear", "Bull", "H_Bear", "H_Bull" placed on the RSI series at the second pivot.
Alerts
Four alert conditions are provided and fire when the corresponding divergence is confirmed:
Bear (Regular)
Bull (Regular)
H_Bear (Hidden)
H_Bull (Hidden)
Notes & tips
Divergences are evaluated only when both price and RSI pivots exist and can be paired under the selected mode.
Pivot sensitivity: smaller leftBars/rightBars → earlier but noisier signals; larger values → fewer, more stable pivots.
Tolerance: If you miss valid setups because pivots land a few bars apart, use TV-like with a small tolBars (e.g., 1–2). If you prefer stricter confirmation, use Same Bar.
Equality slack: Use priceEpsTks and rsiEps to avoid rejecting near-equal highs/lows due to tiny differences.
Works on any symbol/timeframe; as with all divergence tools, treat signals as context—combine with trend, structure, and risk management.

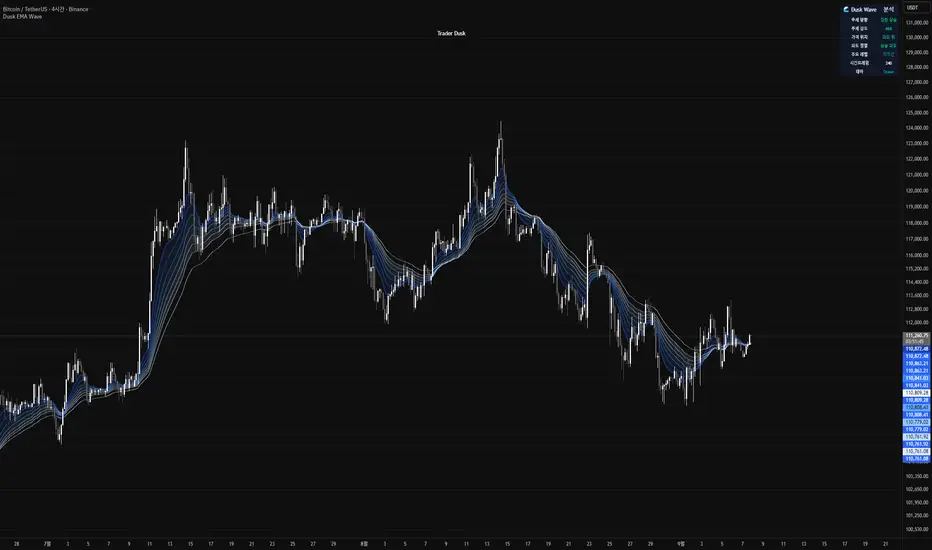
Dusk Wave🌊 Dusk Wave (시각적 분석 도구)
개요
기반 기술: 8단계 추세 파도 시각화
시간대: 모든 시간대 호환
신호: 신호 없음 (분석 전용)
용도: 추세 방향 및 강도 분석
Wave 테이블 설명
DUSK WAVE | TREND ANALYSIS
├─ Wave Alignment: 8개 파도 정렬 상태
├─ Trend Strength: 추세 강도 (Strong/Medium/Weak)
├─ Wave Direction: 파도 전체 방향 (Up/Down/Sideways)
├─ Fast Waves: 단기 파도 상태 (1-4번)
├─ Slow Waves: 장기 파도 상태 (5-8번)
├─ Convergence: 파도 수렴/발산 상태
└─ Trend Quality: 추세 품질 등급 (A/B/C/D)
Wave 해석 가이드
파란색 그라데이션: 8개 EMA 파도 표시
정렬 상태: 모든 파도가 같은 방향 = 강한 추세
파도 간격: 좁을수록 강한 추세, 넓을수록 약한 추세
색상 변화: 파도별 속도 차이 시각화
🌊 Dusk Wave (Visual Analysis Tool) - English Version
Overview
Core Technology: 8-Stage Trend Wave Visualization
Timeframe: Compatible with all timeframes
Signals: No signals (Analysis only)
Purpose: Trend direction and strength analysis
Wave Table Description
DUSK WAVE | TREND ANALYSIS
├─ Wave Alignment: 8 wave alignment status
├─ Trend Strength: Trend intensity (Strong/Medium/Weak)
├─ Wave Direction: Overall wave direction (Up/Down/Sideways)
├─ Fast Waves: Short-term wave status (Waves 1-4)
├─ Slow Waves: Long-term wave status (Waves 5-8)
├─ Convergence: Wave convergence/divergence state
└─ Trend Quality: Trend quality grade (A/B/C/D)
Wave Interpretation Guide
Blue Gradient: 8 EMA waves display
Alignment Status: All waves same direction = Strong trend
Wave Spacing: Closer = Stronger trend, Wider = Weaker trend
Color Changes: Visualizes speed differences between waves
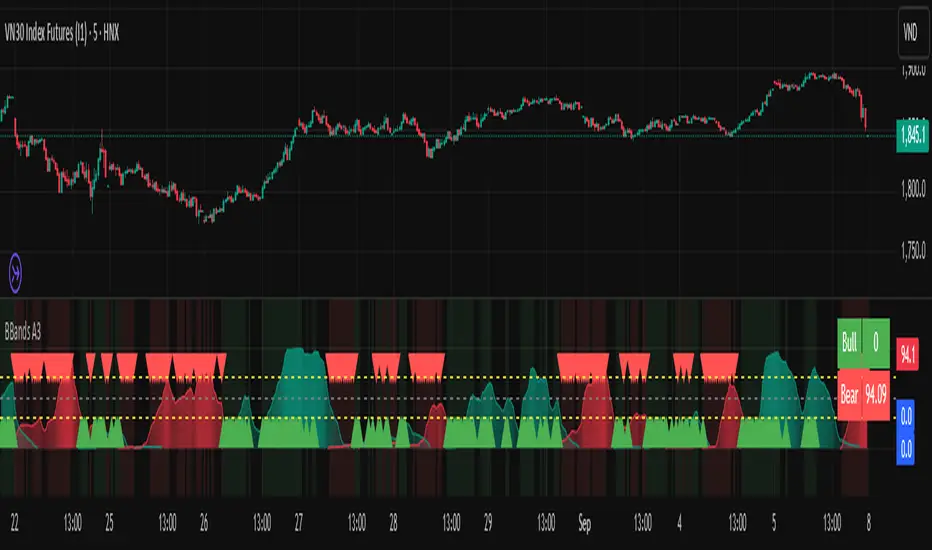
Bollinger Breakout A3 updateBollinger Breakout A3 update from LuxAlgo signal
You can try it with some another signal.
1H Candlestick vs EMA Crossover# Description — 1H Candlestick vs EMA Crossover (Pine Script)
This indicator is built in **TradingView Pine Script v5** and is designed to track the relationship between the **1‑hour candlestick close** and the **1‑hour Exponential Moving Average (EMA)**. It works on any chart timeframe but always pulls in **1H data** using `request. security`.
### Core Features
* **Customizable EMA length** (default = 200)
* **Plots the 1H EMA** as an orange line on your chart
* Optionally shows the **1H close** as a faint gray line for reference
* Detects and highlights when the **1H candle close crosses above or below the 1H EMA**
* **Arrows**: Green triangles appear below the bar when a bullish crossover happens (1H close > EMA); red triangles appear above the bar when a bearish crossover happens (1H close < EMA)
* **Alerts**: Built‑in `alert condition` statements let you create TradingView alerts whenever a crossover occurs
### How to Use
1. Adjust the EMA length if you want a faster or slower moving average.
2. Enable alerts: Right‑click the chart → Add Alert → choose this indicator and select either “crossed ABOVE EMA” or “crossed BELOW EMA.”
### Trading Applications
* **Trend Confirmation**: Use the 1H EMA as a higher‑timeframe filter while trading on lower timeframes.
* **Entry/Exit Signals**: Crossovers can mark potential entry points for trend continuation or reversals.
* **Scalping/Intraday**: Even on a 5m or 15m chart, you can overlay the 1H EMA to align your trades with the bigger trend.
This makes the indicator a simple yet powerful tool for aligning trades with higher‑timeframe momentum and avoiding false signals from lower‑timeframe noise.

Draw Trend LinesSometimes the simplest indicators help traders make better decisions. This indicator draws simple trend lines, the same lines you would draw manually.
To trade with an edge, traders need to interpret the recent price action, whether it's noisy or choppy, or it's trending. Trend Lines will help traders with that interpretation.
The lines drawn are:
1. lower tops
2. higher bottoms
Because trends are defined as higher lows, or lower highs.
When you see "Wedges", formed by prices chopping between top and bottom trend lines, that's noisy environment not to be traded. When you learn to "stop yourself", you already have an edge.
Often when you see a trend, it's still not too late. Trend will continue until it doesn't. But the caveat is a very steep trend is unlikely to continue, because buying volume is extremely unbalanced to cause the steep trend, and that volume will run out of energy. (Same on the sell side of course)
Trends can reverse, and when price action breaks the trend line, Breakout/Breakdown traders can take this as an entry signal.
Enjoy, and good trading!

Ai Golden Support and Resistance Adaptive Support & Resistance (ADR-scaled ABCD + Breakout/Retest Zones)
What it does
This indicator detects actionable support/resistance zones from swing structure and breakout events, then keeps each zone active until it’s invalidated by price. It adapts zone sensitivity using Average Daily Range (ADR) so the same rules scale across symbols and vol regimes.
Core Logic (high level)
Swing & ABCD pattern seed
Detects alternating pivots (high–low–high–low or low–high–low–high) using a user-selected lookback.
Validates basic AB–BC–CD proportions: BC must retrace a portion of AB; CD must extend BC within a set range.
From a valid sequence, sets a candidate level (top for bearish, bottom for bullish).
Breakout confirmation
A level becomes confirmed when price closes beyond it (crossover/crossunder).
On confirmation, the script draws a dotted reference line and records how many bars elapsed from the seed pivot to breakout. That count defines the lookback window used for local extremes.
Zone construction
Supply (bearish): builds a box around the most recent local range near the bearish seed;
Demand (bullish): builds a box around the most recent local range near the bullish seed.
Each zone’s height is derived from nearby extremes and the seed swing, so boxes reflect local structure rather than fixed pip widths.
Volatility normalization (ADR%)
ADR is computed from daily candles.
The Risk Profile input (“High/Medium/Low”) scales required move sizes using ADR%, and adjusts pivot sensitivity (fewer/more bars).
Higher risk → more sensitive (smaller ADR %, tighter pivot lookback).
Lower risk → stricter filters (larger ADR %, wider pivot lookback).
Explosive-move filter (streak logic)
Searches the seeded lookback for consecutive same-color candles (config via the risk profile).
Requires the cumulative % move of that streak to exceed an ADR-scaled threshold.
When found, the zone is tagged as originating from an “explosive” move (potentially higher reaction probability).
Zone persistence & invalidation
Zones persist and auto-extend to the right until invalidated.
Invalidation occurs when price closes through a rule-based threshold derived from the seed structure (stored per zone).
Once invalidated, the zone is marked inactive and stops updating.
Inputs & Controls
Risk Profile: High / Medium / Low (sets pivot lookback, streak length, and ADR% thresholds).
Labels & Visuals: Toggle labels and level lines; set line width.
Colors/Boxes: Supply (red), Demand (green); dotted breakout references.
No broker/session settings are required; the script adapts per symbol via ADR.
On-Chart Elements
Dotted breakout lines at confirmed levels (with measured bars-to-breakout).
Supply/Demand boxes that extend until invalidation.
Optional labels for clarity; minimal clutter by default.
How to Use
Context: Use higher-TF context for bias; apply zones on your trading TF.
Confluence: Combine zones with your own triggers (structure breaks, rejection wicks, momentum shifts).
Invalidation: If price closes beyond a zone’s invalidation threshold, treat that zone as inactive.
Sensitivity: If too many zones appear, switch to Medium/Low Risk (stricter ADR% & pivots); if too few, use High Risk.
Notes & Limitations
Logic is rule-based; there is no machine learning.
Daily ADR is computed from D timeframe, so intraday charts inherit daily volatility context.
Results vary by symbol and timeframe; validate settings per market.
This is an indicator (no orders or P/L).

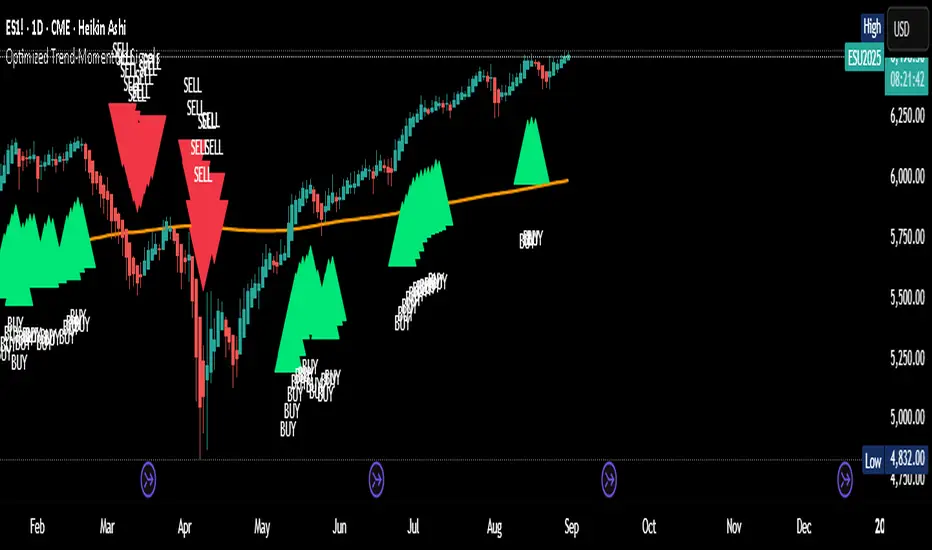
Optimized Trend-Momentum SignalsThis indicator combines trend, momentum, and volume-strength factors into a single buy/sell signal system. It integrates:
SMA 200 → Identifies the long-term trend (price above = bullish bias, below = bearish bias).
MACD (12,26,9) → Confirms momentum direction with line crossovers.
RSI (7) → Filters strength (above 50 = bullish, below 50 = bearish).
ROC (45) → Validates positive or negative rate of change.
Signal Logic:
Buy Signal → Price above SMA 200, MACD bullish, RSI > 50, and ROC > 0.
Sell Signal → Price below SMA 200, MACD bearish, RSI < 50, and ROC < 0.
Features:
Clear arrows for BUY and SELL signals.
Long-term SMA plotted for trend visualization.
Alerts built-in for real-time notifications.
This tool helps traders filter out noise and act only when all major confirmation factors align, reducing false signals and improving decision-making.
Elliott Wave [BigBeluga]🔵 OVERVIEW
Elliott Wave automatically finds and draws an Elliott-style 5-wave impulse and a dashed projection for a potential -(a)→(b)→(c) correction. It detects six sequential reversal points from rolling highs/lows — 1, 2, 3, 4, 5, (a) — validates their relative placement, and then renders the wave with labels and horizontal reference lines. If price invalidates the structure by closing back through the Wave-5 level inside a 100-bar window, the pattern is cleared (optionally kept as “broken”) while key dotted levels remain for context.
🔵 CONCEPTS
Reversal harvesting from extremes : The script scans highest/lowest values over a user-set Length and stores swing points with their bar indices.
Six-point validation : A pattern requires six pivots (1…5 and (a)). Their vertical/temporal order must satisfy Elliott-style constraints before drawing.
Impulse + projection : After confirming 1→5, the tool plots a curved polyline through the pivots and a dashed forward path from (a) toward (b) (midpoint of 5 and (a)) and back to (c).
Risk line (invalidator) : The Wave-5 price is tracked; a close back through it within 100 bars marks the structure as broken.
Minimal persistence : When broken, the wave drawing is removed to avoid noise, while dotted horizontals for waves 5 and 4 remain as reference.
🔵 FEATURES
Automatic pivot collection from rolling highs/lows (user-controlled Length ).
Wave labeling : Points 1–5 are printed; the last collected swing is marked b
. Projected i
& i
are shown with a dashed polyline.
Breaker line & cleanup : If price closes above Wave-5 (opposite for bears) within 100 bars, the pattern is removed; only dotted levels of 5 and 4 stay.
Styling controls :
Length (pivot sensitivity)
Text Size for labels (tiny/small/normal/large)
Wave color input
Show Broken toggle to keep invalidated patterns visible
Lightweight memory : Keeps a compact buffer of recent pivots/draws to stay responsive.
🔵 HOW TO USE
Set sensitivity : Increase Length on noisy charts for cleaner pivots; decrease to catch earlier/shorter structures.
Wait for confirmation : Once 1→5 is printed and (a) appears, use the Wave-5 line as your invalidation. A close back through it within ~100 bars removes the active wave (unless Show Broken is on).
Plan with the dashed path : The (a)→(b)→(c) projection offers a scenario for potential corrective movement and risk placement.
Work MTF : Identify cleaner waves on higher TFs; refine execution on lower TFs near the breaker or during the move toward (b).
Seek confluence : Align with structure (S/R), volume/Delta, or your trend filter to avoid counter-context trades.
🔵 CONCLUSION
Elliott Wave systematizes discretionary wave analysis: it detects and labels the 5-wave impulse, projects a plausible (a)-(b)-(c) path, and self-cleans on invalidation. With clear labels, dotted reference levels, and a practical breaker rule, it gives traders an objective framework for scenario planning, invalidation, and timing.

EMA Range OscillatorEMA Range Oscillator (ERO) - User Guide
Overview
The EMA Range Oscillator (ERO) is a technical indicator that measures the distance between two Exponential Moving Averages (EMAs) and the distance between price and EMA. It normalizes these distances into a 0-100 range, helping traders identify trend strength, market momentum, and potential reversal points.
Components
Main Line
Green Line: EMA20 > EMA50 (Uptrend)
Red Line: EMA20 < EMA50 (Downtrend)
Histogram
White Histogram: Price distance from EMA20
Key Levels
Upper Level (80): High divergence zone
Middle Level (50): Neutral zone
Lower Level (20): Low divergence zone
Parameters
ParameterDefaultDescriptionFast EMA20Short-term EMA periodSlow EMA50Long-term EMA periodNormalization Period100Lookback period for scalingUpper80Upper threshold levelLower20Lower threshold level
How to Read the Indicator
High Values (Above 80)
Strong trend in progress
EMAs are widely separated
High momentum
Potential overbought/oversold conditions
Watch for possible trend exhaustion
Low Values (Below 20)
Consolidation phase
EMAs are close together
Low volatility
Potential breakout setup
Range-bound market conditions
Middle Zone (20-80)
Normal market conditions
Moderate trend strength
Balanced momentum
Look for directional clues from color changes

Relative Weighted Rate of Change (WROC) vs Nifty 50Relative Weighted Rate of Change (WROC) vs Nifty 50

Trend Display Table (with Change Alerts)📌 Indicator: Trend Display Table (with Change Alerts)
This indicator helps identify trend direction based on a 15-minute 20 SMA compared against a 10 EMA applied to that SMA.
Trend Logic:
Bullish → 20 SMA crosses above 10 EMA (on SMA values)
Bearish → 20 SMA crosses below 10 EMA (on SMA values)
Neutral → No crossover (trend continues from previous state)
Display:
A compact trend table appears on the chart (top-right), showing the current trend with customizable colors, font size, and background.
Alerts:
Alerts are triggered only when the trend changes (from Bullish → Bearish or Bearish → Bullish).
This prevents repeated alerts on every bar.
✅ Useful for:
Confirming higher timeframe trend bias
Filtering trades in choppy markets
Getting notified instantly when the trend flips

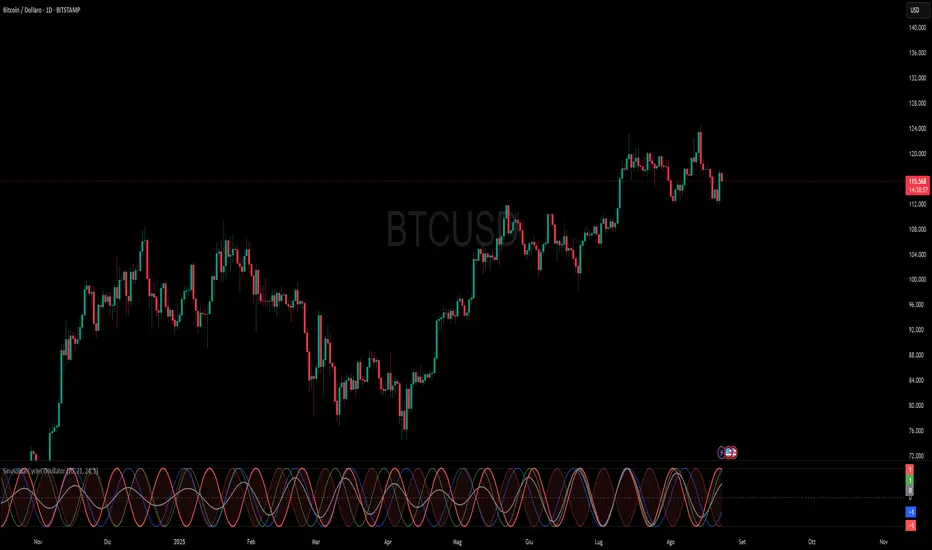
Sinusoidal Cycles OscillatorTitle: Sinusoidal Cycles Oscillator – Multi-Cycle Market Indicator
Description:
Discover market rhythm with the Sinusoidal Cycles Oscillator, a powerful tool for technical analysis and cyclical trading.
Three customizable cycles track short, medium, and long-term market oscillations.
Cycle 1 serves as the main reference wave with an optional mirror envelope.
Cycles 2 & 3 provide supporting harmonics for deeper insight.
Composite wave averages all cycles to reveal overall market phase.
Features:
Fully adjustable periods and amplitude.
Visualize tops, bottoms, and turning points at a glance.
Oscillator ranges from -1 to +1 with clear threshold guides.
Ideal for traders using cycle analysis, harmonic trading, or market timing.
Easy-to-read visual overlay and separate panel option.
Use it to:
Identify potential price reversals.
Compare market cycles across multiple timeframes.
Enhance timing and entry/exit decisions.
Auto-Fit Growth Trendline# **Theoretical Algorithmic Principles of the Auto-Fit Growth Trendline (AFGT)**
## **🎯 What Does This Algorithm Do?**
The Auto-Fit Growth Trendline is an advanced technical analysis system that **automates the identification of long-term growth trends** and **projects future price levels** based on historical cyclical patterns.
### **Primary Functionality:**
- **Automatically detects** the most significant lows in regular periods (monthly, quarterly, semi-annually, annually)
- **Constructs a dynamic trendline** that connects these historical lows
- **Projects the trend into the future** with high mathematical precision
- **Generates Fibonacci bands** that act as dynamic support and resistance levels
- **Automatically adapts** to different timeframes and market conditions
### **Strategic Purpose:**
The algorithm is designed to identify **fundamental value zones** where price has historically found support, enabling traders to:
- Identify optimal entry points for long positions
- Establish realistic price targets based on mathematical projections
- Recognize dynamic support and resistance levels
- Anticipate long-term price movements
---
## **🧮 Core Mathematical Foundations**
### **Adaptive Temporal Segmentation Theory**
The algorithm is based on **dynamic temporal partition theory**, where time is divided into mathematically coherent uniform intervals. It uses modular transformations to create bijective mappings between continuous timestamps and discrete periods, ensuring each temporal point belongs uniquely to a specific period.
**What does this achieve?** It allows the algorithm to automatically identify natural market cycles (annual, quarterly, etc.) without manual intervention, adapting to the inherent periodicity of each asset.
The temporal mapping function implements a **discrete affine transformation** that normalizes different frequencies (monthly, quarterly, semi-annual, annual) to a space of unique identifiers, enabling consistent cross-temporal comparative analysis.
---
## **📊 Local Extrema Detection Theory**
### **Multi-Point Retrospective Validation Principle**
Local minima detection is founded on **relative extrema theory with sliding window**. Instead of using a simple minimum finder, it implements a cross-validation system that examines the persistence of the extremum across multiple historical periods.
**What problem does this solve?** It eliminates false minima caused by temporal volatility, identifying only those points that represent true historical support levels with statistical significance.
This approach is based on the **statistical confirmation principle**, where a minimum is only considered valid if it maintains its extremum condition during a defined observation period, significantly reducing false positives caused by transitory volatility.
---
## **🔬 Robust Interpolation Theory with Outlier Control**
### **Contextual Adaptive Interpolation Model**
The mathematical core uses **piecewise linear interpolation with adaptive outlier correction**. The key innovation lies in implementing a **contextual anomaly detector** that identifies not only absolute extreme values, but relative deviations to the local context.
**Why is this important?** Financial markets contain extreme events (crashes, bubbles) that can distort projections. This system identifies and appropriately weights them without completely eliminating them, preserving directional information while attenuating distortions.
### **Implicit Bayesian Smoothing Algorithm**
When an outlier is detected (deviation >300% of local average), the system applies a **simplified Kalman filter** that combines the current observation with a local trend estimation, using a weight factor that preserves directional information while attenuating extreme fluctuations.
---
## **📈 Stabilized Extrapolation Theory**
### **Exponential Growth Model with Dampening**
Extrapolation is based on a **modified exponential growth model with progressive dampening**. It uses multiple historical points to calculate local growth ratios, implements statistical filtering to eliminate outliers, and applies a dampening factor that increases with extrapolation distance.
**What advantage does this offer?** Long-term projections in finance tend to be exponentially unrealistic. This system maintains short-to-medium term accuracy while converging toward realistic long-term projections, avoiding the typical "exponential explosions" of other methods.
### **Asymptotic Convergence Principle**
For long-term projections, the algorithm implements **controlled asymptotic convergence**, where growth ratios gradually converge toward pre-established limits, avoiding unrealistic exponential projections while preserving short-to-medium term accuracy.
---
## **🌟 Dynamic Fibonacci Projection Theory**
### **Continuous Proportional Scaling Model**
Fibonacci bands are constructed through **uniform proportional scaling** of the base curve, where each level represents a linear transformation of the main curve by a constant factor derived from the Fibonacci sequence.
**What is its practical utility?** It provides dynamic resistance and support levels that move with the trend, offering price targets and profit-taking points that automatically adapt to market evolution.
### **Topological Preservation Principle**
The system maintains the **topological properties** of the base curve in all Fibonacci projections, ensuring that spatial and temporal relationships are consistently preserved across all resistance/support levels.
---
## **⚡ Adaptive Computational Optimization**
### **Multi-Scale Resolution Theory**
It implements **automatic multi-resolution analysis** where data granularity is dynamically adjusted according to the analysis timeframe. It uses the **adaptive Nyquist principle** to optimize the signal-to-noise ratio according to the temporal observation scale.
**Why is this necessary?** Different timeframes require different levels of detail. A 1-minute chart needs more granularity than a monthly one. This system automatically optimizes resolution for each case.
### **Adaptive Density Algorithm**
Calculation point density is optimized through **adaptive sampling theory**, where calculation frequency is adjusted according to local trend curvature and analysis timeframe, balancing visual precision with computational efficiency.
---
## **🛡️ Robustness and Fault Tolerance**
### **Graceful Degradation Theory**
The system implements **multi-level graceful degradation**, where under error conditions or insufficient data, the algorithm progressively falls back to simpler but reliable methods, maintaining basic functionality under any condition.
**What does this guarantee?** That the indicator functions consistently even with incomplete data, new symbols with limited history, or extreme market conditions.
### **State Consistency Principle**
It uses **mathematical invariants** to guarantee that the algorithm's internal state remains consistent between executions, implementing consistency checks that validate data structure integrity in each iteration.
---
## **🔍 Key Theoretical Innovations**
### **A. Contextual vs. Absolute Outlier Detection**
It revolutionizes traditional outlier detection by considering not only the absolute magnitude of deviations, but their relative significance within the local context of the time series.
**Practical impact:** It distinguishes between legitimate market movements and technical anomalies, preserving important events like breakouts while filtering noise.
### **B. Extrapolation with Weighted Historical Memory**
It implements a memory system that weights different historical periods according to their relevance for current prediction, creating projections more adaptable to market regime changes.
**Competitive advantage:** It automatically adapts to fundamental changes in asset dynamics without requiring manual recalibration.
### **C. Automatic Multi-Timeframe Adaptation**
It develops an automatic temporal resolution selection system that optimizes signal extraction according to the intrinsic characteristics of the analysis timeframe.
**Result:** A single indicator that functions optimally from 1-minute to monthly charts without manual adjustments.
### **D. Intelligent Asymptotic Convergence**
It introduces the concept of controlled asymptotic convergence in financial extrapolations, where long-term projections converge toward realistic limits based on historical fundamentals.
**Added value:** Mathematically sound long-term projections that avoid the unrealistic extremes typical of other extrapolation methods.
---
## **📊 Complexity and Scalability Theory**
### **Optimized Linear Complexity Model**
The algorithm maintains **linear computational complexity** O(n) in the number of historical data points, guaranteeing scalability for extensive time series analysis without performance degradation.
### **Temporal Locality Principle**
It implements **temporal locality**, where the most expensive operations are concentrated in the most relevant temporal regions (recent periods and near projections), optimizing computational resource usage.
---
## **🎯 Convergence and Stability**
### **Probabilistic Convergence Theory**
The system guarantees **probabilistic convergence** toward the real underlying trend, where projection accuracy increases with the amount of available historical data, following **law of large numbers** principles.
**Practical implication:** The more history an asset has, the more accurate the algorithm's projections will be.
### **Guaranteed Numerical Stability**
It implements **intrinsic numerical stability** through the use of robust floating-point arithmetic and validations that prevent overflow, underflow, and numerical error propagation.
**Result:** Reliable operation even with extreme-priced assets (from satoshis to thousand-dollar stocks).
---
## **💼 Comprehensive Practical Application**
**The algorithm functions as a "financial GPS"** that:
1. **Identifies where we've been** (significant historical lows)
2. **Determines where we are** (current position relative to the trend)
3. **Projects where we're going** (future trend with specific price levels)
4. **Provides alternative routes** (Fibonacci bands as alternative targets)
This theoretical framework represents an innovative synthesis of time series analysis, approximation theory, and computational optimization, specifically designed for long-term financial trend analysis with robust and mathematically grounded projections.

Capiba Directional Momentum Oscillator (ADX-based)
🇬🇧 English
Summary
The Capiba ADX is a momentum oscillator that transforms the classic ADX (Average Directional Index) into a much more intuitive visual tool. Instead of analyzing three separate lines (ADX, DI+, DI-), this indicator consolidates the strength and direction of the trend into a single histogram that oscillates around the zero line.
The result is a clear and immediate reading of market sentiment, allowing traders to quickly identify who is in control—buyers or sellers—and with what intensity.
How to Interpret and Use the Indicator
The operation of the Capiba ADX is straightforward:
Green Histogram (Above Zero): Indicates that buying pressure (DI+) is in control. The height of the bar represents the magnitude of the bullish momentum. Taller green bars suggest a stronger uptrend.
Red Histogram (Below Zero): Indicates that selling pressure (DI-) is in control. The "depth" of the bar represents the magnitude of the bearish momentum. Lower (more negative) red bars suggest a stronger downtrend.
Zero Line (White): This is the equilibrium point. Crossovers through the zero line signal a potential shift in trend control.
Crossover Above: Buyers are taking control.
Crossover Below: Sellers are taking control.
Reference Levels (Momentum Strength)
The indicator plots three fixed reference levels to help gauge the intensity of the move:
0 Line: Equilibrium.
100 Line: Signals significant directional momentum. When the histogram surpasses this level, the trend (whether bullish or bearish) is gaining considerable strength.
200 Line: Signals very strong directional momentum, or even potential exhaustion conditions. Moves that reach this level are powerful but may also precede a consolidation or reversal.
Usage Strategy
Trend Confirmation: Use the indicator to confirm the direction of your analysis. If you are looking for long positions, the Capiba ADX should ideally be green and, preferably, rising.
Strength Identification: Watch for the histogram to cross the 100 and 200 levels to validate the strength of a breakout or an established trend.
Entry/Exit Signals: A zero-line crossover can be used as a primary entry or exit signal, especially when confirmed by other technical analysis tools.
Acknowledgements
This indicator is the result of adapting knowledge and open-source codes shared by the vibrant TradingView community.
KhoiHV - Bollinger Bands Buy/Sell Area ProBollinger Bands Buy/Sell Area Pro is a professional-grade indicator designed to identify potential trading opportunities based on Bollinger Bands. It highlights dynamic buy and sell areas by combining price action with volatility, helping traders quickly visualize market conditions.
✨ Key Features
Automatically plots upper, middle, and lower Bollinger Bands.
Marks Buy Areas when price enters oversold zones near the lower band.
Marks Sell Areas when price enters overbought zones near the upper band.
Configurable inputs for length, source, and multiplier to fit any trading style.
Easy-to-read chart visuals with colored zones for instant recognition.
💡 How to Use
Look for Buy Areas near the lower band in trending markets to catch potential rebounds.
Watch for Sell Areas near the upper band to anticipate possible pullbacks.
Combine with volume, momentum, or trend indicators for stronger confirmation.
This tool is especially useful for traders who want a clear, visual edge in spotting volatility-based entries and exits without constantly recalculating signals.