IWMA - DolphinTradeBot1️⃣ WHAT IS IT ?
▪️ The Inverted Weighted Moving Average (IWMA) is the reversed version of WMA, where older prices receive higher weights, while recent prices receive lower weights. As a result, IWMA focuses more on past price movements while reducing sensitivity to new prices.
2️⃣ HOW IS IT WORK ?
🔍 To understand the IWMA(Inverted Weighted Moving Average) indicator, let's first look at how WMA (Weighted Moving Average) is calculated.
LET’S SAY WE SELECTED A LENGTH OF 5, AND OUR CURRENT CLOSING VALUES ARE .
▪️ WMA Calculation Method
When calculating WMA, the most recent price gets the highest weight, while the oldest price gets the lowest weight.
The Calculation is ;
( 10 ×1)+( 12 ×2)+( 21 ×3)+( 24 ×4)+( 38 ×5) = 10+24+63+96+190 = 383
1+2+3+4+5 = 15
WMA = 383/15 ≈ 25.53
WMA = ta.wma(close,5) = 25.53
▪️ IWMA Calculation Method
The Inverted Weighted Moving Average (IWMA) is the reversed version of WMA, where older prices receive higher weights, while recent prices receive lower weights. As a result, IWMA focuses more on past price movements while reducing sensitivity to new prices.
The Calculation is ;
( 10 ×5)+( 12 ×4)+( 21 ×3)+( 24 ×2)+( 38 ×1) = 50+48+63+48+38 = 247
1+2+3+4+5 = 15
IWMA = 247/15 ≈ 16.46
IWMA = iwma(close,5) = 16.46
3️⃣ SETTINGS
in the indicator's settings, you can change the length and source used for calculation.
With the default settings, when you first add the indicator, only the iwma will be visible. However, to observe how much it differs from the normal wma calculation, you can enable the "show wma" option to see both indicators with the same settings or you can enable the Show Signals to see IWMA and WMA crossover signals .
4️⃣ 💡 SOME IDEAS
You can use the indicator for support and resistance level analysis or trend analysis and reversal detection with short and long moving averages like regular moving averages.
Another option is to consider whether the iwma is above or below the normal wma or to evaluate the crossovers between wma and iwma.
Wellenanalyse

[iQ]PRO Master iQWave SystemWelcome to the PRO Master iQWave System, an exclusive, ndicator crafted for TradingView. This cutting-edge tool harnesses sophisticated mathematical models to deliver precise buy and sell signals, empowering traders with a comprehensive view of market dynamics.
Key Features
Advanced Analytical Framework: Seamlessly integrates state-of-the-art techniques in signal processing, statistical analysis, and market profiling to uncover high-probability trading opportunities.
Holistic Market Insight: Combines proprietary methods for data transformation, frequency-based cycle detection, adaptive trend and seasonality extraction, and moment-driven anomaly identification—offering a multi-dimensional approach to price analysis.
Customizable Precision: With a wide range of user inputs, traders can tailor the system to their unique strategies and adapt it to diverse market conditions, ensuring flexibility across asset classes and timeframes.
Intuitive Visual Feedback: Displays critical insights directly on your chart, including adaptive fits, statistical boundaries, market profile levels, and a clear, actionable signal label—making complex analysis accessible at a glance.
Why Choose PRO Master iQWave System?
Designed for experienced traders, this indicator stands out by blending advanced analytics with practical usability. Whether you're identifying reversals, filtering noise, or gauging market structure, the PRO Master iQWave System equips you with a robust, all-in-one solution. Its proprietary algorithms distill intricate market data into actionable signals, helping you stay ahead of the curve.
Elevate Your Trading
Experience the power of next-level technical analysis. The PRO Master iQWave System is more than an indicator—it's a strategic edge, reserved for those ready to unlock its potential. Take your trading to new heights with this exclusive tool, available only by invitation.
ADvM, of MMiQ

Fibonacci - DolphinTradeBot
OVERVIEW
The 'Fibonacci - DolphinTradeBot' indicator is a Pine Script-based tool for TradingView that dynamically identifies key Fibonacci retracement levels using ZigZag price movements. It aims to replicate the Fibonacci Retracement tool available in TradingView’s drawing tools. The indicator calculates Fibonacci levels based on directional price changes, marking critical retracement zones such as 0, 0.236, 0.382, 0.5, 0.618, 0.786, and 1.0 on the chart. These levels are visualized with lines and labels, providing traders with precise areas of potential price reversals or trend continuation.
HOW IT WORKS ?
The indicator follows a zigzag formation. After a large swing movement, when new swings are formed without breaking the upper and lower levels, it places Fibonacci levels at the beginning and end points of the major swing movement."
▪️(Bullish) Structure :High → HigherLow → LowerHigh
▪️(Bearish) Structure :Low → LowerHigh → HigherLow
▪️When Fibonacci retracement levels are determined, a "📌" mark appears on the chart.
▪️If the price closes outside of these levels, a "❌" mark will appear.
USAGE
This indicator is designed to plot Fibonacci levels within an accumulation zone following significant price movements, helping you identify potential support and resistance. You can adjust the pivot periods to customize the zigzag settings to your preference. While classic Fibonacci levels are used by default, you also have the option to input custom levels and assign your preferred colors.
Set the Fibonacci direction option to "upward" to detect only bullish structures, "downward" to detect only bearish structures, and "both" to see both at the same time.
"To view past levels, simply enable the ' Show Previous Levels ' option, and to display the zigzag lines, activate the ' Show Zigzag ' setting."
ALERTS
The indicator, by default, triggers an alarm when both a level is formed and when a level is broken. However, if you'd like, you can select the desired level from the " Select Level " section in the indicator settings and set the alarm based on one of the conditions below.
▪️ cross-up → If the price breaks the Fibonacci level to the upside.
▪️ cross-down → If the price breaks the Fibonacci level to the downside.
▪️ cross-any → If the price breaks the Fibonacci level in any direction.

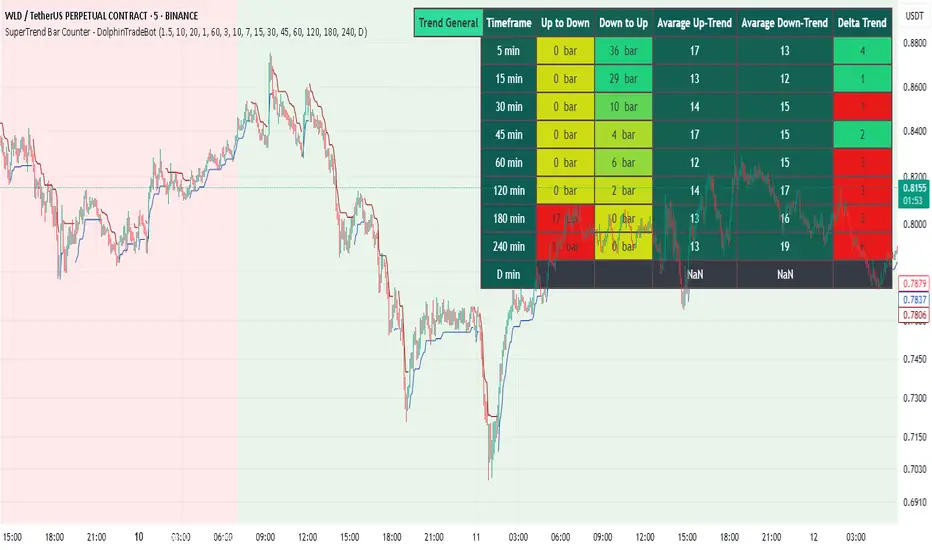
SuperTrend Bar Counter - DolphinTradeBot
OVERVIEW
This indicator calculates the lengths of upward and downward trends based on the specified SuperTrend settings and timeframe. It then takes the average length of the entered number of swings and compares the current trend durations with these averages. The main goal is to anticipate potential reversals in advance.
HOW IS IT WORK ?
The indicator actually contains two different but conceptually similar metrics.
The first part; shows how long the Supertrend stays in an upward or downward trend in real time. Additionally, it analyzes how close the current value is to the average of the Supertrend bar count for the given input.
The second part; aims to provide a different perspective on general trend analysis. It calculates the average duration of upward and downward trends in bars based on the SuperTrend indicator settings within a specified period and timeframe. If, contrary to expectations, downward trends last longer than upward trends, the background is colored green, indicating a prediction that the trend will continue upward.
Explanation of the second part logic: As you know, moving averages or similar approaches that follow the price are often correct when looking back retrospectively, but they cannot serve as leading indicators in real-time trading.That's why, when performing trend analysis, I wanted to introduce a completely different perspective based on price movement, yet still grounded in price action itself.
This phenomenon is partly due to the nature of the SuperTrend itself. After strong price movements, SuperTrend tends to reverse direction much more quickly during pullbacks. Following a strong upward move, a downward trend is detected much earlier and tends to last longer. The indicator provides an alternative perspective by analyzing which directional movement occurs more rapidly and uses this insight for trend prediction.
HOW TO USE ?
It can be used to identify potential price reversals or to assess whether the price is generally cheap or expensive.
In the settings section, you can adjust the SuperTrend parameters and timeframes for the values displayed in the table.
In the second part, you can configure the values used for general trend analysis.
NOTE
Things to be aware of: As the chart's timeframe decreases, pulling data from higher timeframes becomes more difficult. For example, when the chart is set to a 5-minute timeframe, it may fail to retrieve swing periods from the daily timeframe. Similarly, on a 4-hour chart, when calculating the average swing, there might be enough data for only 5 periods instead of 20.
Please keep in mind that this indicator was created solely to provide an idea. It should only be considered as a perspective or a supporting tool that influences your decision by no more than 5% at most.
ARSI | QuantumResearch🚀 Adaptative RSI (ARSI) | QuantumResearch 🚀
The Adaptative RSI (ARSI) is an advanced momentum-based oscillator that enhances traditional RSI analysis by incorporating a dynamic smoothing factor and adaptive thresholding. This innovative approach allows the indicator to dynamically adjust to changing market conditions, reducing lag and improving responsiveness to trend shifts.
🔍 Why ARSI?
Unlike conventional RSI, ARSI dynamically adapts its smoothing factor based on market volatility. This allows for better trend identification, earlier entries, and improved exits—all without unnecessary noise.
🔗 Key Features:
✅ Adaptative RSI Calculation – The smoothing factor automatically adjusts based on RSI’s distance from equilibrium.
✅ Dynamic Threshold Mechanism – Uses standard deviation-based adaptive bands to define overbought/oversold levels dynamically.
✅ Trend Detection & Confirmation – ARSI reacts quickly to trend shifts, helping traders catch early moves and avoid unnecessary drawdowns.
✅ Customizable Visuals – Multiple color schemes and visual overlays to match different trading styles.
✅ Alerts for Trend Reversals – Stay ahead with real-time alerts for bullish and bearish trend shifts.
📊 How ARSI Helps in Trading
📈 Catch Early Trends – The oscillator helps identify breakouts before they become obvious, allowing for early positioning in emerging trends.
📉 Avoid Drawdowns – The indicator signals early exits, helping to protect capital before major market sell-offs.
📊 Enhance Confirmation – Can be used alongside other momentum indicators for better trade validation.
📊 Real-World Application of ARSI
🟢 ETH: Avoiding a 50% Drawdown
🔹 This ETH chart demonstrates how ARSI signaled an early exit, preventing a massive drawdown of nearly 50%.
🟢 SOL: Identifying Early Trends
🔹 ARSI caught early bullish momentum on SOL, allowing traders to enter the uptrend before the major rally.
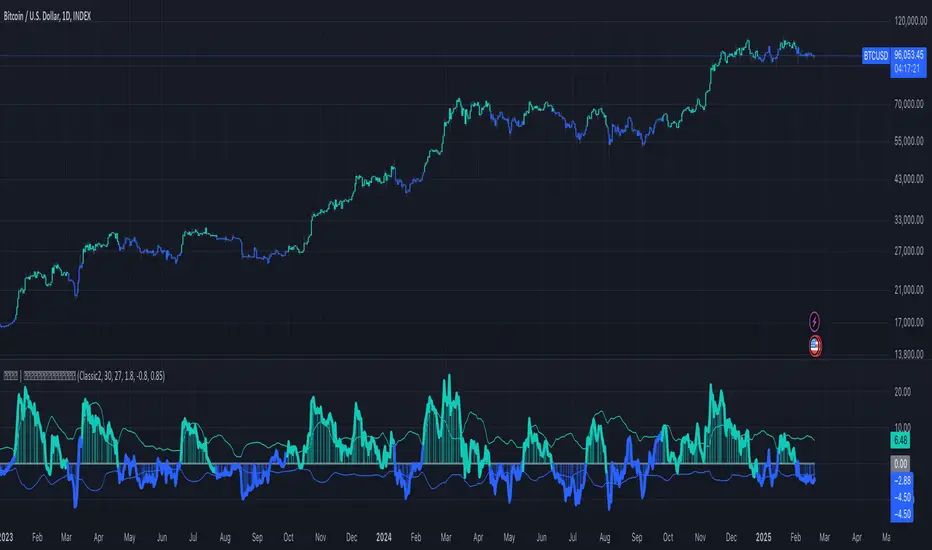
🟢 BTC: Exit Before the COVID Crash
🔹 ARSI issued a timely exit before the COVID crash, helping traders avoid a massive market collapse.
🟢 TOTAL: Early Exit Before a Major Market Drop
🔹 The indicator provided a clear warning signal before the market downturn, allowing risk mitigation.
🟢 DOGE: Trend Continuation Confirmation
🔹 ARSI successfully confirmed trend continuation on DOGE, keeping traders aligned with the market move.
⚠️ Disclaimer
The content provided is for informational and educational purposes only. Nothing contained within should be considered financial, investment, legal, or other professional advice. Past performance does not guarantee future results. Trading cryptocurrencies involves substantial risk of loss and is not suitable for every investor.
🔥 Enhance your trading with the Adaptive RSI (ARSI) | QuantumResearch – Stay ahead of the trend! 🚀

Solar VPR (No EVMA) + Alpha TrendThis Pine Script v6 indicator combines Solar VPR (without EVMA slow average) and Alpha Trend to identify potential trading opportunities.
Solar VPR calculates a Simple Moving Average (SMA) of the hlc3 price and defines upper/lower bands based on a percentage multiplier. It highlights bullish (green) and bearish (red) zones.
Alpha Trend applies ATR-based smoothing to an SMA, identifying trend direction. Blue indicates an uptrend, while orange signals a downtrend.
Buy/Sell Signals appear when price crosses Alpha Trend and aligns with Solar VPR direction.

Intraday Anchored FanSimilar to an Anchored VWAP, this lets you click a bar on an Intraday chart to add an "Anchored Fan" which displays lines at up to 6 levels above and below the chosen Anchor Point. Useful to measure the retracement during swing moves.
You can reposition the fan by either hovering over the anchor or by clicking the name of the study to "activate" it, and then dragging. You can also change the Anchor Point in Settings.
By default the anchor uses the bar Close, but you can change this manually in settings OR you can use the fancy "Auto high/low" mode which is handy if you are mainly dropping the fan on local swing highs and lows.
The default line measures were chosen for ES (Futures) but the study should be usable with nearly anything as long as you adjust the settings to something appropriate for the ticker. If you want to use this on NQ, for example, it would be reasonable to multiple each of these settings by 3.5 or so.
NOTE: If the fan is off the left side of the chart, one way to see the Anchor handle again easily is to switch to a higher timeframe; for example if you are on the 5min maybe use the 15min or hourly to find the handle -- if it is WAY off the left side (for example if you let many days pass without advancing it) it's generally easiest to use Settings to move it back to "now".

cashdata by farashahThis indicator is designed to generate wave charts following the NeoWave method.
NeoWave, developed by Glenn Neely in 1990, offers a scientific and objective approach to wave analysis.
A Cash Data is essential for accurate analysis, requiring highs and lows to be plotted in the exact order they occurred—a process that can be complex and time-consuming.
The indicator automates this process by identifying highs and lows for any symbol and timeframe, plotting them in real-time.
For instance, on a monthly timeframe, it finds yearly highs and lows and arranges them sequentially, forming a "Yearly Wave Chart" for NeoWave analysis.
•Generates Wave Charts for multiple timeframes(yearly, monthly, weekly, daily, hourly, minutely).
• Provides real-time auto-updating Wave Charts.
• Supports plotting based on calendar time, bar count, or equal distances.
• Compatible with all account types.

Machine Learning + Geometric Moving Average 250/500Indicator Description - Machine Learning + Geometric Moving Average 250/500
This indicator combines password-protected market analysis levels with two powerful Geometric Moving Averages (GMA 250 & GMA 500).
🔒 Password-Protected Custom Levels
Access pre-defined long and short price levels for select assets (crypto, stocks, and more) by entering the correct password in the indicator settings.
Once the correct password is entered, the indicator automatically displays:
Green horizontal lines for long entry zones.
Red horizontal lines for short entry zones.
If the password is incorrect, a warning label will appear on the chart.
📈 Geometric Moving Averages (GMA)
This indicator calculates GMA 250 and GMA 500, two long-term trend-following tools.
Unlike traditional moving averages, GMAs use logarithmic smoothing to better handle exponential price growth, making them especially useful for assets with strong trends (e.g., crypto and tech stocks).
GMA 250 (white line) tracks the medium-term trend.
GMA 500 (gold line) tracks the long-term trend.
⚙️ Customizable & Flexible
Works on multiple assets, including cryptocurrencies, equities, and more.
Adaptable to different timeframes and trading styles — ideal for both swing traders and long-term investors.
This indicator is ideal for traders who want to blend custom support/resistance levels with advanced geometric trend analysis to better navigate both volatile and trending markets.

Waves and Harmonic Patterns by BULL┃NETThe B | N WAHA (Waves and Harmonic Patterns by BULL | NET)
indicator provides traders using CFD brokers with the most significant price and time events from the stock exchange of the underlying original index or security. For example traders are able to easily identify the price at the Daily Open and Close time of up to three additional stock exchanges. Traders can choose from a huge list of options including the values from the current and previous Day, Week, Month and Year. In addition traders can enable the display of the Expected Move by either implied or historical volatility. The indicator can show Open Gaps (gap between close and open of two trading sessions) also which traders would usually see only on the original chart of an index or security.
The B | N WAHA indicator can help traders to make better entry decisions based on the real market sessions.
█ ⚠️ DISCLAIMER – READ BEFORE YOU USE ⚠️
█ FEATURES
— PATTERN OPTIONS
● Deviation for ratio calculation
Any pattern has a unique set of ratios for different retracements. In a perfect world each ratio would be hit exactly. But the stock market is far from perfect and especially in volatile markets ratios have to be adjusted. The default is 5%. The maximum is 10%
● (Name of pattern)
The list of patters recognized will grow with new versions of the indicator. The settings for each pattern are the same.
Each available pattern will be recognized and drawn by default. If you disable the checkbox in front of the pattern name the indicator will ignore this pattern completely no matter if another checkbox for this pattern is active.
● Developing
As soon as a new possible pattern is recognized, the indicator will draw a label at the starting point (0, A or X) of the pattern. For the indicator “possible” means there is only the last point missing, which is D in case of ABCD and XABCD patterns. Once the last point has reached the completion price range, the indicator will draw the pattern. If you enable this checkbox the indicator will draw a zickzack line between the already existing points.
● Projection
If there is a new possible pattern the indicator will draw a projection box to indicate the price range where the final point has to be located for completion of the pattern. Don’t confuse this with a buy or sell signal! The appearance of the box doesn’t tell anything about the chance of a pattern to get completed. It simply tells you that the price has to reach the box and to retrace within the box to form a valid pattern. This allows you to prepare a strategy if the price hits the box. If you disable the checkbox no box will be drawn.
● History
For backtesting or learning purpose you can display all historical occurrences of a pattern. Best practice is to disable all other patterns and enable the history checkbox only together with the checkbox of the patten name.
— PIVOPOINT OPTIONS
To identify patterns you need pivot points. True high and lows in the chart. If you use B | N GABO or B | N DESC you already know about this concept. The indicator is using three different levels of pivot points in parallel for better detection of patterns.
● Level 1
This is the fast running pivot level. You can choose from 2 to 4. Default is 3.
● Level 2
This is the pivot level with medium pace. Selectable levels are 5 to 9. Default is 5.
● Level 3
This is the slow running pivot level. The minimum level is 10, the maximum is 20. The default is 15.
● Pivotpoints
By default pivot points are not displayed on the chart because this ads a lot of noise. For backtesting and learning purposes you can enable this option.
● Label
● Text
● Size
This three settings define the appearance of the pivot points.
— HARMONIC PATTERN OPTIONS
The settings in this section control how the zickzack line of a pattern gets drawn on the chart. The settings for bullish and bearish pattern are identical.
● Show bullish/bearish pattern
By default both types of patterns are drawn on the chart. For backtesting or learning purpose you can disable it.
● Line
The color of the zickzack lines.
● ABC
The line style to connect points A, B and C.
● CD
The line style to connect points C and D.
● (Line Width)
The width of lines ABC and CD.
● Label
The color of the label for a completed pattern. This label marks starting point.
● Developing
The color of the label while a pattern is developing.
● Text
The color of the text in the label.
● (Text size)
The size of the text.
— HARMONIC PATTERN LABEL OPTIONS
The label which marks the start of a pattern can contain multiple information. To reduce noise on the chart you can disable each information separately. If you disable them all, the label will display the designation of the pattern starting point, e.g. “A” for an ABCD or “X” for an XABCD.
● Title
The title identifies the type of pattern. E.g. a possibly developing ABCD pattern will display ABC at the beginning to denote the point A, B and C have been detected. If this pattern completes the title would change to ABCD in case of a standard ABCD pattern or to AB=CD if the pattern matches all criteria needed for this ‘perfect’ type of ABCD.
● Number
Each pattern carries a unique number needed to identify the projection and targets in case there are multiple patterns in parallel.
● Ratio
First this is the retracement level of point C from point B toward point A. It is the decimal value of the percentage. In a perfect world this would be 0.618 (61.8%). In volatile markets this can be as low as 0.382 and as high as 0.786. If Ratio is enabled BD ratio will get displayed as well once point D is about to complete a ABCD pattern.
● Tooltip
Enabled by default the tooltip shows all the information and more if you hover the mouse pointer over the label.
● Perfect
If the pattern is formed “perfect” it will change its color to denote a possibly strong trend reversal. E.g. a perfect AB=CD is formed if the time and price difference between A and B is equal to the time and price difference between C and D. The calculation contains a 5% deviation to reflect usual market conditions.
— PROJECTION OPTIONS
If the “Projection” checkbox of a pattern is enabled (See PATTERN OPTIONS) the indicator will display the price range where the final point must sit to form a valid pattern. You can customize the box that marks this price range or disable it at all.
● Bull / Bear
The color of the box border.
● (Style)
The line style of the box border.
● Background
The background color of the box.
● Text
The color of the text in the box.
● (Text size)
The size of the text.
— PROJECTION DESCRIPTION OPTIONS
The box which marks the possible landing zone for pattern completion can contain multiple information. To reduce noise on the chart you can disable each information separately.
● Price Range
To complete a pattern successfully point D needs to be located within the minimum and maximum price of the range. For bullish pattern the price range is increasing (e.g. 100 – 120) and for bearish pattern it is decreasing (e.g. 100 – 80).
● Title
The title identifies the type of pattern. E.g. a possibly developing ABCD pattern will display ABC at the beginning to denote the point A, B and C have been detected. If this pattern completes the title would change to ABCD in case of a standard ABCD pattern or to AB=CD if the pattern matches all criteria needed for this ‘perfect’ type of ABCD.
● Number
Each pattern carries a unique number needed to identify the projection and targets in case there are multiple patterns in parallel.
— TARGET OPTIONS
● Display ABCD Targets
Once a pattern is completed the indicator will display multiple price lines for targets or other important price levels. This is enabled by default.
The cosmetic setting are separated for bullish and bearish pattern targets. However they are identical.
● Bull / Bear Line
The color of the target lines.
● (Line style)
The style of the target lines.
● Label
The color of the label which contains information about the target.
● Text
The color of the text in the label.
● (Text size)
The size of the text.
— TARGET LABEL OPTIONS
The target label can contain multiple information. To reduce noise on the chart you can disable each information separately. If you disable all information a blank label will be displayed necessary to hold the tooltip.
● Price
The target price.
● Number
The unique number of the pattern.
● Title
The target identifier.
● Direction
New traders often get confused with bullish and bearish pattern. A small arrow facing down or up will tell them the expected price move to reach the targets.
● Tooltip
If enabled the tooltip shows all the information and more if you hover the mouse pointer over the label.
● Remove if hit
By default target lines and labels will get removed one bar after the price has hit the target. If you disable this option target lines will stay together with the pattern until it gets invalidated.
— DISPLAY OPTIONS
● 2 Decimals
To streamline the appearance of prices they are set to display two decimals only. Numbers get rounded! However, trading currency pairs or crypto assets might need to display the full amount of decimals. In this case simply disable the setting “2 Decimals”.
— ALERT OPTIONS
Bevor you can use alerts in TradingView you have to activate them.
1. Click on the alert button
2. From the first drop down in conditions select B | N WAHA
3. From the third drop down (the one below the first one) select Any alert() function call
4. Skip the expiration if you want the alerts to be active for ever
5. Give The Alert a name or keep the default
6. Click on create
You have to repeat this procedure in every timeframe you use. This is not a limitation of the indicator. This is how TradingView alerts work.
Now you can select the events in the alert options of B | N WAHA you want to get noticed about. Alerts get fired when a bar gets confirmed which is the last close of a bar.
-------------------------------------------------------
Disclaimer BullNet: The information provided in this document is for educational and informational purposes only and does not constitute financial, investment, or trading advice. Any use of the content is at your own risk. No liability is assumed for any losses or damages resulting from reliance on this information. Trading financial instruments involves significant risks, including the potential loss of all invested capital. There is no guarantee of profits or specific outcomes. Please conduct your own research and consult a professional financial advisor if needed.
Disclaimer TradingView: According to the www.tradingview.com
Copyright: 2025-BULLNET - All rights reserved.
Roadmap:
Version 1.0 03.03.2025

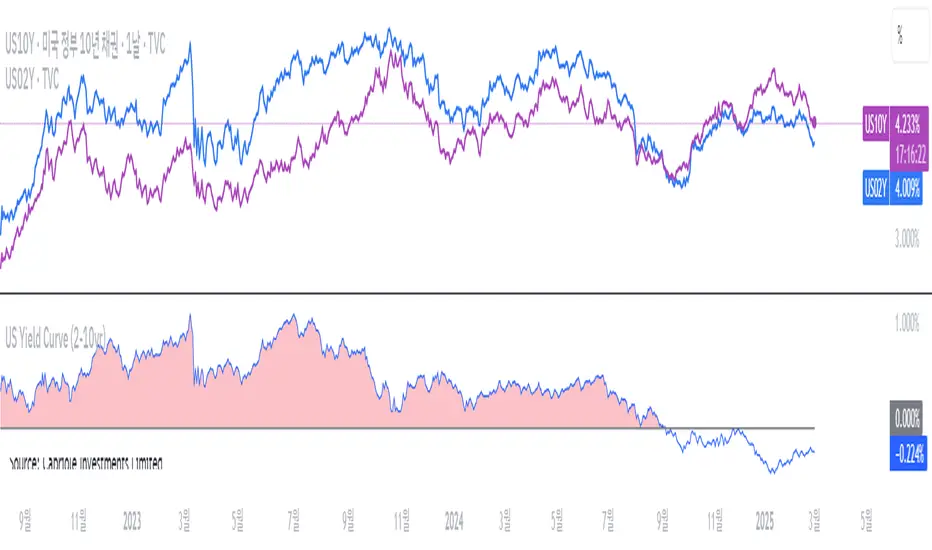
US Yield Curve (2-10yr)US Yield Curve (2-10yr) by oonoon
2-10Y US Yield Curve and Investment Strategies
The 2-10 year US Treasury yield spread measures the difference between the 10-year and 2-year Treasury yields. It is a key indicator of economic conditions.
Inversion (Spread < 0%): When the 2-year yield exceeds the 10-year yield, it signals a potential recession. Investors may shift to long-term bonds (TLT, ZROZ), gold (GLD), or defensive stocks.
Steepening (Spread widening): A rising 10-year yield relative to the 2-year suggests economic expansion. Investors can benefit by shorting bonds (TBT) or investing in financial stocks (XLF). The Amundi US Curve Steepening 2-10Y ETF can be used to profit from this trend.
Monitoring the curve: Traders can track US10Y-US02Y on TradingView for real-time insights and adjust portfolios accordingly.
WAVES II by WestmontWAVES II by Westmont is a next-generation evolution of the original WAVES indicator, designed to offer improved responsiveness , enhanced functionality , and clearer visual clarity . By incorporating advanced momentum filtering and smoother transitions in the VWAP (Volume Weighted Average Price) area , WAVES II provides users with a more dynamic and actionable tool for market analysis.
This indicator introduces new methodologies , visual enhancements , and advanced forecasting capabilities , making it an ideal tool for traders seeking faster insights and sharper reactions to market movements.
Key Features of WAVES II
WaveTrend Calculation
The core of WAVES II is the WaveTrend , which is calculated using the HLC3 (High + Low + Close) price .
The WaveTrend is smoothed through two processes:
EMA (Exponential Moving Average): Applied to the HLC3 to capture faster price movements .
SMA (Simple Moving Average): Applied to the first wave to smooth out shorter-term fluctuations.
VWAP Area Crossover
WAVES II calculates the VWAP area by subtracting the second wave from the first .
The indicator detects when this VWAP area crosses key levels :
Bullish Signal : When the VWAP area crosses upward with positive momentum.
Bearish Signal : When the VWAP area crosses downward with negative momentum.
Momentum Detection
Momentum is calculated by measuring the price change between bars and smoothing this change over a short period .
Positive momentum signals increasing price movement , while negative momentum indicates a slowing or reversing trend .
This momentum detection filters out weaker price movements , highlighting only the significant trend shifts and giving users confirmation of market movements.
Visual Enhancements
Glowing VWAP Lines : The VWAP area is plotted with multiple layers of colors, gradually fading in opacity. This highlights areas of strong price movement and reversals.
Fading Gradient Effect : The VWAP line is filled with a gradient that adjusts its opacity based on the distance from the center line, visually indicating market strength and reinforcing key levels.
VWAP Projection
WAVES II projects the VWAP area forward , based on its recent slope, to offer a forward-looking view of potential price movements. This projection helps traders anticipate short-term market direction and react faster to potential trend changes.
Key Differences Between WAVES and WAVES II
Smoothing and WaveTrend Calculation Adjustments
WAVES : Uses fixed smoothing parameters for WaveTrend calculation, resulting in a relatively stable and slower response to market changes.
The first smoothing (wavetrend1) uses an EMA with a fixed length.
The second smoothing (wavetrend2) uses a simple moving average (SMA) with a fixed length.
WAVES II : Introduces more responsive settings like smoothing_length, deviation_length, first_wave_length, and second_wave_length for faster reaction times to market movements. These adjustments make WAVES II ideal for traders who need quicker feedback and sharper market transitions.
Momentum Detection
WAVES : Does not incorporate momentum-based logic, relying only on the VWAP area and its relationship to historical values.
WAVES II : Adds momentum detection, which calculates the difference between current and previous price movements, smoothed over a defined period. This helps identify bullish and bearish trends more accurately, providing additional confirmation and improving signal reliability.
VWAP Area Cross Detection
WAVES : Detects VWAP area crossovers based on recent high and low values.
WAVES II : Refines cross detection by incorporating a momentum filter. A Bullish cross is confirmed when the VWAP area crosses upwards with positive momentum, while a Bearish cross is confirmed when it crosses down with negative momentum. This dual-condition approach enhances signal accuracy and offers better context for trade decisions.
Plotting and Visualization
WAVES : Plots the VWAP line, center line, and uses color transitions for VWAP area fills to represent market conditions.
WAVES II : Introduces a multi-layer glow effect for the VWAP line, with varying opacities, creating a visually dynamic experience. The gradient glow effect provides a clearer representation of market strength and proximity to the center line, making it easier to spot market shifts and interpret momentum at a glance.
Why WAVES II Was Created as a Separate Indicator
New Features and Functionality :
WAVES II introduces key features like momentum detection and VWAP projections , which significantly alter how the indicator operates. These are not minor updates but represent a shift in how the tool functions , providing faster and more detailed insights for traders. WAVES II gives traders sharper market feedback with improved responsiveness to price changes.
Targeted for Different Trading Styles :
WAVES II is aimed at traders who need faster reactions and more dynamic , reliable signals . While WAVES remains a solid choice for those who prefer a more stable, traditional approach, WAVES II caters to traders who require quicker feedback and more granular market insights. By offering both tools, traders can select the one that aligns with their style, whether that’s for faster decision-making or a more conservative approach .
Visual Clarity :
The enhanced visual effects in WAVES II, such as the multi-layer glow and gradient VWAP transitions , offer greater clarity and a more intuitive charting experience . These visual improvements allow traders to quickly interpret changes in the market, making WAVES II a more effective tool for detailed and actionable market analysis.
Clear Value for Traders :
WAVES II brings significant enhancements over the original WAVES, including more advanced features , faster momentum detection , and better visual representation of market dynamics . This makes WAVES II a more powerful tool for traders seeking dynamic market insights . It is an ideal choice for those who need quicker and more reliable feedback than traditional tools can provide.
How to Use WAVES II
Users can watch for WaveTrend crossovers (when the line crosses 0) and VWAP area dots (bullish or bearish) to spot potential buy or sell signals.
Users can use momentum to confirm signals, helping you identify whether the market is gaining or losing strength.
WAVES II offers advanced features , faster responsiveness , and clearer visuals compared to the original WAVES indicator. By introducing momentum detection and refining the handling of VWAP crossovers , WAVES II enhances the overall trading experience, providing more dynamic, actionable insights for traders. While WAVES remains an excellent tool for those who prefer a simpler, more stable approach, WAVES II is designed for traders who seek a more detailed , faster-reacting tool for market analysis.

Percentage Based ZigZag█ OVERVIEW
The Percentage-Based ZigZag indicator is a custom technical analysis tool designed to highlight significant price reversals while filtering out market noise. Unlike many standard zigzag tools that rely solely on fixed price moves or generic trend-following methods, this indicator uses a configurable percentage threshold to dynamically determine meaningful pivot points. This approach not only adapts to different market conditions but also helps traders distinguish between minor fluctuations and truly significant trend shifts—whether scalping on shorter timeframes or analyzing longer-term trends.
█ KEY FEATURES & ORIGINALITY
Dynamic Pivot Detection
The indicator identifies pivot points by measuring the percentage change from the previous extreme (high or low). Only when this change exceeds a user-defined threshold is a new pivot recognized. This method ensures that only substantial moves are considered, making the indicator robust in volatile or noisy markets.
Enhanced ZigZag Visualization
By connecting significant highs and lows with a continuous line, the indicator creates a clear visual map of price swings. Each pivot point is labelled with the corresponding price and the percentage change from the previous pivot, providing immediate quantitative insight into the magnitude of the move.
Trend Reversal Projections
In addition to marking completed reversals, the script computes and displays potential future reversal points based on the current trend’s momentum. This forecasting element gives traders an advanced look at possible turning points, which can be particularly useful for short-term scalping strategies.
Customizable Visual Settings
Users can tailor the appearance by:
• Setting the percentage threshold to control sensitivity.
• Customizing colors for bullish (e.g., green) and bearish (e.g., red) reversals.
• Enabling optional background color changes that visually indicate the prevailing trend.
█ UNDERLYING METHODOLOGY & CALCULATIONS
Percentage-Based Filtering
The script continuously monitors price action and calculates the relative percentage change from the last identified pivot. A new pivot is confirmed only when the price moves a preset percentage away from this pivot, ensuring that minor fluctuations do not trigger false signals.
Pivot Point Logic
The indicator tracks the highest high and the lowest low since the last pivot. When the price reverses by the required percentage from these extremes, the algorithm:
1 — Labels the point as a significant high or low.
2 — Draws a connecting line from the previous pivot to the current one.
3 — Resets the extreme-tracking for detecting the next move.
Real-Time Reversal Estimation
Building on traditional zigzag methods, the script incorporates a projection calculation. By analyzing the current trend’s strength and recent percentage moves, it estimates where a future reversal might occur, offering traders actionable foresight.
█ HOW TO USE THE INDICATOR
1 — Apply the Indicator
• Add the Percentage-Based ZigZag indicator to your trading chart.
2 — Adjust Settings for Your Market
• Percentage Move – Set a threshold that matches your trading style:
- Lower values for sensitive, high-frequency analysis (ideal for scalping).
- Higher values for filtering out noise on longer timeframes.
• Visual Customization – Choose your preferred colors for bullish and bearish signals and enable background color changes for visual trend cues.
• Reversal Projection – Enable or disable the projection feature to display potential upcoming reversal points.
3 — Interpret the Signals
• ZigZag Lines – White lines trace significant high-to-low or low-to-high movements, visually connecting key swing points.
• Pivot Labels – Each pivot is annotated with the exact price level and percentage change, providing quantitative insight into market momentum.
• Trend Projections – When enabled, projected reversal levels offer insight into where the current trend might change.
4 — Integrate with Your Trading Strategy
• Use the indicator to identify support and resistance zones derived from significant pivots.
• Combine the quantitative data (percentage changes) with your risk management strategy to set optimal stop-loss and take-profit levels.
• Experiment with different threshold settings to adapt the indicator for various instruments or market conditions.
█ CONCLUSION
The Percentage-Based ZigZag indicator goes beyond traditional trend-following tools by filtering out market noise and providing clear, quantifiable insights into price action. With its percentage threshold for pivot detection and real-time reversal projections, this original methodology and customizable feature set offer traders a versatile edge for making informed trading decisions.

WAVES by WestmontWAVES by Westmont is a trading indicator that combines WaveTrend analysis with VWAP dynamics to provide traders with insights into market momentum , volatility , and trends . Users can rely on this tool to help identify market shifts , potential trend reversals , and momentum changes . The script integrates custom logic with standard public domain functions to enhance signal accuracy and market analysis.
WAVES builds on familiar tools, such as the Exponential Moving Average ( EMA ), Simple Moving Average ( SMA ), and basic fractal analysis , to create a comprehensive view of price behavior. Users can interpret this indicator to gain a clearer picture of market conditions, utilizing both WaveTrend’s trend-following signals and VWAP’s volume-weighted price reference.
How the Components Work Together:
Divergence Functions
WAVES uses the bottom_fractal and bot_fractal functions to detect local highs and lows, helping identify potential reversal points in the market. These functions work alongside the WaveTrend and VWAP analysis to confirm or challenge potential turning points.
WaveTrend Calculation
ESA (Exponential Smoothing Average): Provides a smoothed base for price direction.
DE (Deviation): Measures volatility, indicating how much price is fluctuating.
CI (Commodity Channel Index): Tracks cycles between price and the smoothed ESA, identifying potential price shifts.
These values are smoothed using EMA and SMA for greater stability. Users can rely on these smoothed signals to reduce noise and improve trend clarity.
VWAP Area Calculation
Users can observe the VWAP area , calculated from the difference between two WaveTrend lines ( wavetrend1 and wavetrend2 ), to understand market equilibrium in relation to volume-weighted price action. The VWAP area provides a clearer picture of price movement relative to market volume.
Signal Dots and Visualization
Bullish Signals: Users can look for blue dots when the VWAP area crosses upwards , indicating that price is above the VWAP and suggesting upward momentum .
Bearish Signals: Users can look for purple dots when the VWAP area crosses downwards , indicating that price is below the VWAP and suggesting downward momentum .
Smooth VWAP Gradient Fill
Users can visually track momentum using the smooth gradient fill between the VWAP plot and the center line . The fill color changes from blue ( positive momentum ) to purple ( negative momentum ), and turquoise ( neutral ), helping traders quickly assess market sentiment and trend strength.
How to Use WAVES by Westmont :
Bullish Momentum : Users can look for blue dots when the VWAP area crosses upward . This suggests the market is in an uptrend as price moves above the VWAP , potentially indicating upward price action .
Bearish Momentum : Users can look for purple dots when the VWAP area crosses downward . This suggests the market is in a downtrend as price moves below the VWAP , indicating potential for downward price action .
Neutral Market Conditions : Users can observe when the VWAP area remains near the center line ( turquoise ), indicating market consolidation or indecision .
Code Usage :
The indicator uses TradingView’s built-in functions (EMA, SMA, and fractals), which are well-optimized for standard technical analysis. These functions serve as a foundation for the indicator’s calculations. Users can trust that the public domain functions ensure efficient performance, while the added customizations enhance signal quality by integrating WaveTrend and VWAP dynamics.

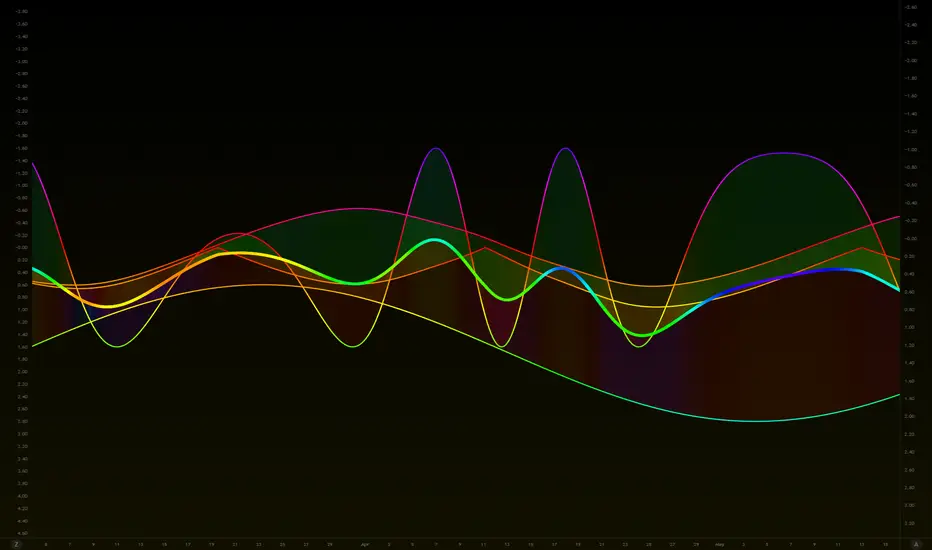
Wave Modulation Demo█ OVERVIEW
This script demonstrates Stacked Wave Modulation by visualizing four interconnected waves. Wave 1 is the base wave, influencing Wave 2's frequency, which in turn modulates Wave 3's amplitude, and finally, Wave 3 modulates Wave 4's phase. Explore the fascinating effects of wave modulation by adjusting the inputs for each wave and their modulation scales.
══════════════════════════════════════════════════
█ CONCEPTS
This script visualizes a cascade of wave modulations:
1 — Base Wave (Wave 1): This is the foundational wave. Its parameters (type, frequency, amplitude, phase, vertical shift) are directly controlled and serve as the basis for subsequent modulations.
2 — Frequency Modulation (Wave 2): Wave 2's frequency is modulated by Wave 1 . As Wave 1 oscillates, it dynamically changes the frequency of Wave 2 , creating interesting frequency variations. The Frequency Mod Scale input controls the intensity of this modulation.
3 — Amplitude Modulation (Wave 3): Building upon the cascade, Wave 3 's amplitude is modulated by Wave 2 . The peaks and troughs of Wave 2 influence the amplitude of Wave 3 , resulting in amplitude variations. The Amplitude Mod Scale input adjusts the strength of this amplitude modulation.
4 — Phase Modulation (Wave 4): Finally, Wave 4 's phase is modulated by Wave 3 . Wave 3 's oscillations shift the phase of Wave 4 , leading to phase-related distortions and dynamic wave patterns. The Phase Mod Scale input determines the extent of phase modulation.
5 — Stacked Wave (Average): The script calculates and plots the average of all four waves, providing a composite view of the combined modulation effects.
══════════════════════════════════════════════════
█ FEATURES
The script is organized into input groups for each wave, allowing for detailed customization:
1 — Wave 1: Base Wave
• Type : Select the waveform type for Wave 1 (Sine, Cosine, Triangle, Square).
• Frequency (Hz) : Sets the base frequency of Wave 1 in Hertz (cycles per second).
• Amplitude : Controls the vertical amplitude or height of Wave 1.
• Phase Shift (deg) : Adjusts the phase shift of Wave 1 in degrees, shifting the wave horizontally.
• Vertical Shift : Sets the vertical position of Wave 1 on the chart.
2 — Wave 2: Frequency Modulation
• Type : Select the waveform type for Wave 2.
• Base Frequency (Hz) : Sets the base frequency of Wave 2, before modulation.
• Amplitude : Controls the amplitude of Wave 2.
• Phase Shift (deg) : Adjusts the phase shift of Wave 2.
• Vertical Shift : Sets the vertical position of Wave 2.
• Frequency Mod Scale : Determines the degree to which Wave 1 modulates Wave 2's frequency. Higher values increase the modulation effect.
3 — Wave 3: Amplitude Modulation
• Type : Select the waveform type for Wave 3.
• Base Frequency (Hz) : Sets the base frequency of Wave 3.
• Amplitude : Controls the base amplitude of Wave 3, before modulation.
• Phase Shift (deg) : Adjusts the phase shift of Wave 3.
• Vertical Shift : Sets the vertical position of Wave 3.
• Amplitude Mod Scale : Determines the degree to which Wave 2 modulates Wave 3's amplitude. Higher values increase the modulation effect.
4 — Wave 4: Phase Modulation
• Type : Select the waveform type for Wave 4.
• Base Frequency (Hz) : Sets the base frequency of Wave 4.
• Amplitude : Controls the amplitude of Wave 4.
• Phase Shift (deg) : Sets the base phase shift of Wave 4, before modulation.
• Vertical Shift : Sets the vertical position of Wave 4.
• Phase Mod Scale : Determines the degree to which Wave 3 modulates Wave 4's phase. Higher values increase the modulation effect.
══════════════════════════════════════════════════
█ HOW TO USE
1. Add the "Stacked Wave Modulation Demo" script to your TradingView chart.
2. Explore the input settings. Each wave has its own group of customizable parameters.
3. Adjust the Type , Frequency , Amplitude , Phase Shift , and Vertical Shift for each wave to define their base characteristics.
4. Experiment with the modulation scales ( Frequency Mod Scale , Amplitude Mod Scale , Phase Mod Scale ) to control the intensity of the modulation effects between the waves.
5. Observe how the waves interact and how the modulations shape their forms and the final stacked wave (average).
══════════════════════════════════════════════════
█ NOTES
* This script utilizes the `waves` and `hsvColor` libraries. Look for other scripts on my profile.
* The frequencies are set in Hertz (cycles per second), which relate to bars on the chart. A frequency of 0.5 Hz means 0.5 cycles per bar, or 1 cycle every 2 bars.
* Adjusting the modulation scales allows you to fine-tune the visual impact of the modulation effects.
* The color of each wave plot is dynamically generated based on its value using the HSV color model for visual distinction.
* Feel free to modify and experiment with the script to create different modulation schemes or stacking methods.
Let me know if you have any other questions or would like further refinements!
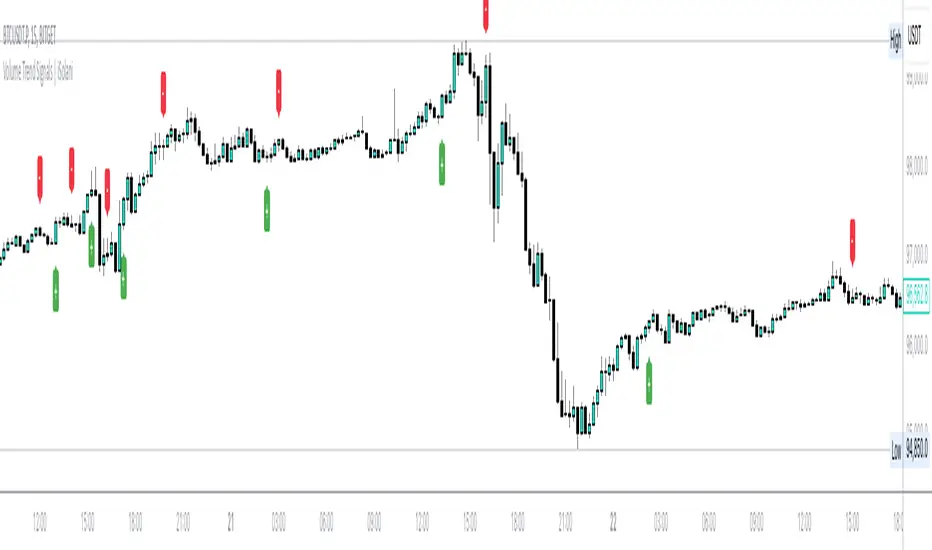
Volume Trend Signals | iSolani
Volume Trend Signals | iSolani: Syncing Price Momentum with Volume Confirmation
In the dance between price action and volume, discerning true trend commitment requires seeing how institutional players vote with their capital. The Volume Trend Signals | iSolani illuminates this interplay by generating precise crossover signals when volume-accelerated price movements gain sustained traction. Unlike conventional volume oscillators, it employs a two-layered confirmation system —blending volatility-adjusted thresholds with adaptive smoothing—to spotlight high-probability entries aligned with smart-money activity.
Core Methodology
The indicator executes a five-phase process to filter meaningful trends:
Logarithmic Price Scaling: Measures percentage-based price changes via HLC3 typical price, reducing large-value bias in volatile markets.
Volatility Dynamic Filter: Uses a 30-bar standard deviation of price changes, scaled by user sensitivity (default 2x), to set momentum thresholds.
Volume Governance: Caps raw volume at 3x its 40-bar SMA, neutralizing outlier spikes while preserving institutional footprints.
Directional Flow Accumulation: Sums volume as positive/negative based on whether price movement breaches volatility-derived boundaries.
Signal Refinement: Smooths the Volume Flow Indicator (VFI) with a 3-bar SMA, then triggers alerts via crosses over a 20-bar EMA signal line.
Breaking New Ground
This tool introduces three evolutionary improvements over traditional volume indicators:
EMA Convergence Signals: Unlike basic zero-cross systems, it requires VFI to overtake its own EMA, confirming sustained momentum shifts.
Context-Aware Volume: The 3x volume cap adapts to current market activity, preventing false signals during news-driven liquidity spikes.
Minimalist Visual Alerts: Uses and symbols below/above candles, reducing chart clutter while emphasizing pivotal moments.
Engine Under the Hood
The script’s logic flows through four computational stages:
Data Conditioning: Computes HLC3 and its log-based rate of change for normalized price analysis.
Threshold Calibration: Derives dynamic entry/exit levels from 30-period volatility multiplied by user sensitivity.
Volume Processing: Filters and signs volume based on price meeting threshold criteria.
Signal Generation: Triggers buy/sell labels when the 3-bar SMA of cumulative flow crosses the 20-bar EMA.
Standard Configuration
Optimized defaults balance responsiveness and reliability:
VFI Length: 40-bar accumulation window
Sensitivity: 2.0 (double the volatility-derived threshold)
Signal Smoothing: 20-bar EMA
Volume Cap: 3x average (hidden parameter)
Smoothing: Enabled (3-bar SMA on VFI)
By fusing adaptive volume filtering with EMA-confirmed momentum, the Volume Trend Signals | iSolani cuts through market noise to reveal institutional-grade trend inflection points. Its unique crossover logic—prioritizing confirmation over speed—makes it particularly effective in swing trading and trend-following strategies across equities, commodities, and forex markets.
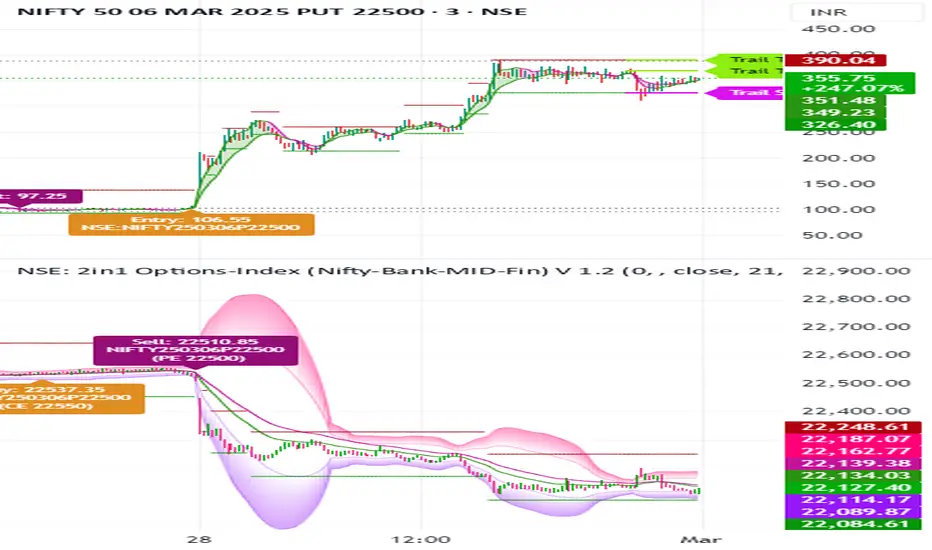
NSE: 2in1 Options-Index (Nifty-Bank-MID-Fin)
1. Using Two Charts in One Indicator with Buy and Sell Signals on Both Charts
Dual-Chart Functionality: This indicator allows you to monitor two charts simultaneously – the main chart (Options) and the underlying index chart (NIFTY, BANKNIFTY, etc.).
The index chart (below the main chart) shows the underlying index movement.
The main chart displays the Options data (e.g., NIFTY options, BANKNIFTY options).
Buy/Sell Signals on Both Charts:
Buy and sell signals are generated on both the options chart and the index chart, ensuring you don’t miss any trading opportunities.
This dual-chart setup helps you correlate the movement of the index with the options data for better decision-making.
2. Works Across Major Indices (NIFTY, BANKNIFTY, FINNIFTY, etc.)
Automatic Index Detection: The script automatically detects the underlying index based on the chart symbol. It supports:
NIFTY, BANKNIFTY, FINNIFTY, MIDCPNIFTY, SENSEX
Flexibility: Whether you’re trading NIFTY options or BANKNIFTY options, the indicator adapts to the selected index and provides accurate signals.
3. Helps You Select ATM, ITM, and OTM Strikes (Ideal for Beginners and Advanced Traders)
ATM (At-The-Money) Strike Calculation:
The script calculates the ATM strike price based on the current spot price of the underlying index.
ITM (In-The-Money) and OTM (Out-Of-The-Money) Strikes:
Users can adjust the strike price using a slider to select ITM or OTM strikes.
This feature is especially helpful for beginners who are learning about options trading and want to understand the difference between ITM, ATM, and OTM strikes.
Strike Price Display:
The selected strike price is displayed on the chart, making it easy to identify the right strike for your trades.
4. Double EMA Selection for Trading
Customizable EMAs:
The script uses two Exponential Moving Averages (EMAs) to generate signals:
Short EMA (Default: 21 periods)
Long EMA (Default: 34 periods)
Users can customize the EMA lengths based on their trading strategy.
5. Option Chart in the Main Chart with Index Chart Below for Easy Monitoring
Integrated Chart Setup:
The main chart displays the options data (e.g., NIFTY options, BANKNIFTY options).
The index chart (below the main chart) shows the underlying index movement.
Benefits:
This setup allows you to monitor both the options and the index in a single view, making it easier to:
Correlate the movement of the index with the options data.
Identify trading opportunities directly on the chart.
No need to switch between multiple charts – everything is in one place.
6. Targets and Stop-Loss When the Signal is Generated
Dynamic Targets and Stop-Loss:
The script calculates targets and stop-loss levels based on the Predicted Range (PR) bands.
Trailing Stop-Loss:
The stop-loss level adjusts dynamically as the price moves in your favor.
Target Levels:
Two target levels are provided (Target 1 and Target 2) based on the PR bands.
Visual Indicators:
Targets and stop-loss levels are plotted on the chart with labels and lines for easy reference.
Colors:
Trailing Stop: Light Pink
Target 1: Light Green
Target 2: Light Green
7. Various Other Options in One Indicator
Advanced Statistical Bands (KRO Settings):
The script includes Kernel Regression Oscillator (KRO) settings for advanced traders.
Plots upper and lower bands based on standard deviation and kernel regression.
Helps identify overbought and oversold conditions.
Customizable Alerts:
Users can enable/disable alerts for:
Buy/Sell signals.
Trailing stop-loss hits.
Target achievements.
Summary of Benefits
All-in-One Tool: Combines candlestick analysis, EMAs, options strike selection, targets, stop-loss, and advanced statistical bands in a single indicator.
Beginner-Friendly: Helps new traders understand ATM, ITM, and OTM strikes while providing clear buy/sell signals.
Advanced Features: Includes KRO settings, dynamic targets, and trailing stop-loss for experienced traders.
Dual-Chart Setup: Monitor options and the underlying index simultaneously for better decision-making.
Customizable: Adjust EMA lengths, strike prices, colors, and alerts to suit your trading style.
Adaptative Volume Weighted Oscillator | QuantumResearchQuantumResearch Adaptative Volume Weighted Oscillator (AVWO)
The Adaptative Volume Weighted Oscillator (AVWO) is an advanced momentum indicator that dynamically adjusts to changing market conditions. By combining Volume-Weighted Moving Averages (VWMA) with adaptive smoothing and volatility-based thresholds, this tool refines trend signals and enhances decision-making for traders.
🚀 Key Features:
Volume Sensitivity: Incorporates VWMA to account for volume-driven price movements, effectively filtering out market noise.
Adaptive Thresholds: Utilizes dynamic upper and lower bounds that adjust based on market volatility.
Momentum Confirmation: Identifies potential trend continuations or reversals with precision.
Customizable Visuals: Offers multiple color themes and bar color settings for clear and personalized visualization.
1. How It Works
The AVWO calculates the percentage difference between the price and the VWMA. This measure helps identify potential shifts in market momentum.
VWMA Calculation: Computes a moving average with volume
Oscillator Derivation: Determines how far the current price deviates from its VWMA.
Dynamic Thresholds: Employs volatility to set adaptive upper and lower limits.
Adaptive Smoothing: Applies a smoothing factor to fine-tune threshold responsiveness to new price movements.
🎯 Bullish Signal: Occurs when the oscillator breaks above the adaptive upper threshold.
⚠️ Bearish Signal: Occurs when the oscillator drops below the adaptive lower threshold.
2. Visual Representation
The AVWO offers clear and intuitive visual cues to aid in market analysis:
Color-Coded Histogram: Momentum bars change colors based on trend direction.
Threshold Lines: Dynamic lines mark overbought and oversold zones.
Bar Coloring: Candle colors adjust to reflect prevailing market conditions.
3. Backtest Performance
Extensive backtesting on major assets has demonstrated the effectiveness of the AVWO indicator:
BTC/USD
ETH/USD
SOL/USD
SUI/USD
📊 Key Results:
High Trend Recognition Accuracy: Captures strong trends with minimal lag.
Versatile Across Timeframes: Performs well in both short-term and long-term strategies.
Volume-Weighted Confirmation: Effectively filters false signals in volatile markets.
4. Customization & Parameters
The AVWO is highly configurable to suit your trading style:
VWMA Length (default: 30)
Adaptive Smoothing Factor (default: 0.85)
Threshold Multipliers
Color Modes (choose from 8 different themes for optimal visibility)
5. Trading Applications
This indicator is versatile and can be used in various trading strategies:
Trend Following: Confirms momentum shifts, helping to stay in profitable trades longer.
6. Final Thoughts
The Adaptative Volume Weighted Oscillator (AVWO) is a powerful tool for traders seeking a refined, volume-based momentum indicator.
Its unique blend of VWMA, dynamic thresholds, and adaptive smoothing enhances trend detection accuracy.
Whether used for scalping, swing trading, or long-term analysis, this indicator adapts seamlessly to various market conditions.
Important Disclaimer: No indicator guarantees future results. Always implement proper risk management and use additional confluences when trading.
LongWave | QuantumResearchQuantumResearch LongWave Indicator
The LongWave Indicator is a comprehensive trend-following system that integrates two universal strategies, two technical indicators, and one on-chain indicator tailored specifically for Bitcoin (BTC).
By blending advanced market dynamics with on-chain insights, this indicator provides precise long and short signals to help traders navigate the market with confidence. 📊🚀
1. Overview
This indicator is designed to:
Identify Market Trends: Combines multiple trend-based methodologies to define clear market directions. 🔄
Leverage On-Chain Data: Utilizes fundamental Bitcoin network activity for enhanced trend validation. ⚡
Provide Customization: Allows users to fine-tune sensitivity, thresholds, and visual preferences. 🎨
2. How It Works
A. Multi-Layer Trend Detection
Two Universal Strategies – These strategies apply proprietary trend-following algorithms to analyze price movements over multiple timeframes. 🕰️
Two Technical Indicators – A combination of statistical smoothing and momentum-based calculations refines trend signals. 📈
One On-Chain Indicator – Analyzes Bitcoin’s market valuation and investor behavior to confirm directional bias. 🏦
B. Trend Score Calculation
Each component contributes to a weighted trend score, ensuring robust and adaptive market assessments. 📊
The final LongWave Score is derived by averaging inputs from the five core systems. ⚖️
C. Dynamic Thresholds & Signal Generation
Long Entry Signal – Triggered when the LongWave Score exceeds the upper threshold, indicating strong bullish momentum. ✅
Short/Cash Signal – Triggered when the LongWave Score drops below the lower threshold, signaling market weakness. ❌
3. Visual Representation
Trend Bar Coloring:
Green Bars – Indicate bullish momentum (Long Signal). ✅
Blue Bars – Indicate bearish momentum (Short/Cash Signal). ❌
Trend Confirmation Line:
A Hull Moving Average (HMA) dynamically shifts color based on market conditions. 📊
Table-Based Signal Dashboard:
Displays real-time trend scores for each component. 🔢
Includes rate of change (ROC) metrics to assess momentum shifts. 🚀
LW signal ligne:
Aligns with the LongWave Score to confirm entry and exit decisions.
4. Customization & Parameters
The LongWave Indicator is designed with high flexibility to adapt to various trading styles:
Threshold Adjustments:
Users can modify long and short thresholds to optimize signal sensitivity. 🎛️
Trend Component Weights:
Custom weighting for each universal strategy and indicator to tailor output precision. ⚙️
On-Chain Sensitivity:
Fine-tune on-chain Z-score parameters to reflect market conditions accurately. 📡
Visual Preferences:
Color Modes: Choose from multiple pre-set themes for enhanced readability. 🎨
5. Trading Applications
Trend Following – Ideal for traders looking to capitalize on extended bullish and bearish trends. 📈
Market Timing – Helps identify optimal entry and exit points with trend-based validation. ⏳
On-Chain Confluence – Merges technical analysis with on-chain insights to confirm directional bias. 🔗
Risk Management – Provides clear buy/cash indications, reducing uncertainty in trading decisions. ⚠️
6. Final Thoughts
The QuantumResearch LongWave Indicator is a high-precision tool designed for trend confirmation, risk mitigation, and market positioning.
By integrating technical and fundamental insights, it offers traders a complete market perspective.
Important Disclaimer: No indicator guarantees future performance. Always use proper risk management and conduct additional research. ⚠️📊

Crypto Scanner v4This guide explains a version 6 Pine Script that scans a user-provided list of cryptocurrency tokens to identify high probability tradable opportunities using several technical indicators. The script combines trend, momentum, and volume-based analyses to generate potential buying or selling signals, and it displays the results in a neatly formatted table with alerts for trading setups. Below is a detailed walkthrough of the script’s design, how traders can interpret its outputs, and recommendations for optimizing indicator inputs across different timeframes.
## Overview and Key Components
The script is designed to help traders assess multiple tokens by calculating several indicators for each one. The key components include:
- **Input Settings:**
- A comma-separated list of symbols to scan.
- Adjustable parameters for technical indicators such as ADX, RSI, MFI, and a custom Wave Trend indicator.
- Options to enable alerts and set update frequencies.
- **Indicator Calculations:**
- **ADX (Average Directional Index):** Measures trend strength. A value above the provided threshold indicates a strong trend, which is essential for validating momentum before entering a trade.
- **RSI (Relative Strength Index):** Helps determine overbought or oversold conditions. When the RSI is below the oversold level, it may present a buying opportunity, while an overbought condition (not explicitly part of this setup) could suggest selling.
- **MFI (Money Flow Index):** Similar in concept to RSI but incorporates volume, thus assessing buying and selling pressure. Values below the designated oversold threshold indicate potential undervaluation.
- **Wave Trend:** A custom indicator that calculates two components (WT1 and WT2); a crossover where WT1 moves from below to above WT2 (particularly near oversold levels) may signal a reversal and a potential entry point.
- **Scanning and Trading Zone:**
- The script identifies a *bullish setup* when the following conditions are met for a token:
- ADX exceeds the threshold (strong trend).
- Both RSI and MFI are below their oversold levels (indicating potential buying opportunities).
- A Wave Trend crossover confirms near-term reversal dynamics.
- A *trading zone* condition is also defined by specific ranges for ADX, RSI, MFI, and a limited difference between WT1 and WT2. This zone suggests that the token might be in a consolidation phase where even small moves may be significant.
- **Alerts and Table Reporting:**
- A table is generated, with each row corresponding to a token. The table contains columns for the symbol, ADX, RSI, MFI, WT1, WT2, and the trading zone status.
- Visual cues—such as different background colors—highlight tokens with a bullish setup or that are within the trading zone.
- Alerts are issued based on the detection of a bullish setup or entry into a trading zone. These alerts are limited per bar to avoid flooding the trader with notifications.
## How to Interpret the Indicator Outputs
Traders should use the indicator values as guidance, verifying them against their own analysis before making any trading decision. Here’s how to assess each output:
- **ADX:**
- **High values (above threshold):** Indicate strong trends. If other indicators confirm an oversold condition, a trader may consider a long position for a corrective reversal.
- **Low values:** Suggest that the market is not trending strongly, and caution should be taken when considering entry.
- **RSI and MFI:**
- **Below oversold levels:** These conditions are traditionally seen as signals that an asset is undervalued, potentially triggering a bounce.
- **Above typical resistance levels (not explicitly used here):** Would normally caution a trader against entering a long position.
- **Wave Trend (WT1 and WT2):**
- A crossover where WT1 moves upward above WT2 in an oversold environment can signal the beginning of a recovery or reversal, thereby reinforcing buy signals.
- **Trading Zone:**
- Being “in zone” means that the asset’s current values for ADX, RSI, MFI, and the closeness of the Wave Trend lines indicate a period of consolidation. This scenario might be suitable for both short-term scalping or as an early exit indicator, depending on further market analysis.
## Timeframe Optimization Input Table
Traders can optimize indicator inputs depending on the timeframe they use. The following table provides a set of recommended input values for various timeframes. These values are suggestions and should be adjusted based on market conditions and individual trading styles.
Timeframe ADX RSI MFI ADX RSI MFI WT Channel WT Average
5-min 10 10 10 20 30 20 7 15
15-min 12 12 12 22 30 20 9 18
1-hour 14 14 14 25 30 20 10 21
4-hour 16 16 16 27 30 20 12 24
1-day 18 18 18 30 30 20 14 28
Adjust these parameters directly in the script’s input settings to match the selected timeframe. For shorter timeframes (e.g., 5-min or 15-min), the shorter lengths help filter high-frequency noise. For longer timeframes (e.g., 1-day), longer input values may reduce false signals and capture more significant trends.
## Best Practices and Usage Tips
- **Token Limit:**
- Limit the number of tokens scanned to 10 per query line. If you need to scan more tokens, initiate a new query line. This helps manage screen real estate and ensures the table remains legible.
- **Confirming Signals:**
- Use this script as a starting point for identifying high potential trades. Each indicator’s output should be used to confirm your trading decision. Always cross-reference with additional technical analysis tools or market context.
- **Regular Review:**
- Since the script updates the table every few bars (as defined by the update frequency), review the table and alerts regularly. Market conditions change rapidly, so timely decisions are crucial.
## Conclusion
This Pine Script provides a comprehensive approach for scanning multiple cryptocurrencies using a combination of trend strength (ADX), momentum (RSI and MFI), and reversal signals (Wave Trend). By using the provided recommendation table for different timeframes and limiting the tokens to 20 per query line (with a maximum of four query lines), traders can streamline their scanning process and more effectively identify high probability tradable tokens. Ultimately, the outputs should be critically evaluated and combined with additional market research before executing any trades.

On-chain Zscore | QuantumResearchQuantumResearch On-chain Zscore Indicator
The On-chain Zscore Indicator by QuantumResearch is a cutting-edge tool designed for traders and analysts who leverage on-chain metrics to assess Bitcoin’s market conditions. This indicator calculates a composite Z-score using three key on-chain metrics: NUPL (Net Unrealized Profit/Loss), SOPR (Spent Output Profit Ratio), and MVRV (Market Value to Realized Value). By normalizing these values through standard deviations, the indicator provides a dynamic, data-driven approach to identifying overbought and oversold conditions, improving market timing and decision-making.
1. Overview
This indicator integrates multiple on-chain metrics to:
Assess Market Cycles – Utilize Z-score normalization to detect potential tops and bottoms.
Smooth Volatility – Apply EMA and standard deviation filtering to refine signals.
Identify Buy & Sell Signals – Use adaptive thresholds to highlight market extremes.
Provide Visual Clarity – Color-coded bar signals and background fills for intuitive analysis.
2. How It Works
A. Z-score Calculation
What is a Z-score? – The Z-score measures how far a data point deviates from its historical mean in terms of standard deviations. This helps in identifying statistical extremes.
Zscore(source,mean,std)=>
zscore = (source-mean)/std
zscore
Standard Deviation Normalization – Each on-chain metric (NUPL, SOPR, MVRV) is individually standardized before being combined into a final score.
B. On-Chain Components
NUPL Z-score – Measures unrealized profits and losses relative to market cycles.
SOPR Z-score – Evaluates profit-taking behavior on spent outputs.
MVRV Z-score – Assesses whether Bitcoin is overvalued or undervalued based on market cap vs. realized cap.
C. Composite On-chain Score
The indicator computes an average Z-score of the three on-chain metrics to create a composite market assessment.
Adaptive thresholds (default: 0.73 for bullish signals, -0.44 for bearish signals) dynamically adjust based on market conditions.
3. Visual Representation
This indicator features color-coded elements and dynamic threshold visualization:
Bar Colors
Green Bars – Bullish conditions when Z-score exceeds the upper threshold.
Red Bars – Bearish conditions when Z-score drops below the lower threshold.
Gray Bars – Neutral market conditions.
Threshold Bands & Background Fill
Upper Band (Overbought) – Default threshold set at 0.73.
Middle Band – Neutral zone at 0.
Lower Band (Oversold) – Default threshold set at -0.44.
4. Customization & Parameters
This indicator is highly configurable, allowing traders to fine-tune settings based on their strategy:
On-Chain Z-score Settings
NUPL Z-score Length – Default: 126 periods
SOPR Z-score Length – Default: 111 periods
MVRV Z-score Length – Default: 111 periods
Signal Thresholds
Upper Threshold (Bullish Zone) – Default: 0.73
Lower Threshold (Bearish Zone) – Default: -0.44
Color & Visual Settings
Choose from eight customizable color modes to suit personal preferences.
5. Trading Applications
The On-chain Zscore Indicator is versatile and can be applied in various market scenarios:
Macro Trend Analysis – Identify long-term market tops and bottoms using normalized on-chain metrics.
Momentum Confirmation – Validate price action trends with SOPR & MVRV behavior.
Market Timing – Use deviation thresholds to enter at historically significant price zones.
Risk Management – Avoid overextended markets by watching for extreme Z-score readings.
6. Final Thoughts
The QuantumResearch On-chain Zscore Indicator provides a unique approach to market evaluation by combining three critical on-chain metrics into a single, normalized score.
By standardizing Bitcoin’s market behavior, this tool helps traders and investors make informed decisions based on historical statistical extremes.
Backtesting and validation are essential before using this indicator in live trading. While it enhances market analysis, it should be used alongside other tools and strategies.
Disclaimer: No indicator can guarantee future performance. Always use appropriate risk management and perform due diligence before trading.

ZenAlgo - WavesZenAlgo - Waves is an advanced technical analysis indicator designed to refine trading decisions through a unique combination of multiple methodologies. By integrating Wave-like oscilator, RSI+MFI, and a dynamic Extra Moving Average (MA), it provides a structured approach to trend analysis and momentum detection. Unlike standalone indicators, this tool synchronizes multiple perspectives to provide holistic view and reduce noise.
Purpose and Justification for Integration
ZenAlgo - Waves strategically integrates multiple methodologies to provide trend validation. This indicator goes beyond standalone calculations by layering:
Original Wave Oscillator: Used to detect market momentum shifts and overbought/oversold conditions, further filtered by additional trend confirmation layers.
RSI + MFI Fusion: Introduces price-volume relationship validation, reducing misleading momentum reading.
Dynamic Extra Moving Average (MA): Acts as an adaptive trend filter, ensuring signals align with prevailing market direction rather than reacting to noise.
Divergence Detection: Contextualized divergence detection for both Wave and RSI+MFI.
Multi-Timeframe Trend Table: Facilitates confirmation across different timeframes, helping traders validate trade setups.
Attribution & Originality
ZenAlgo - Waves is an independently developed indicator that builds upon well-known technical analysis techniques while introducing significant enhancements. Unlike traditional WaveTrend indicator, it replaces the fixed constants of the original WaveTrend approach with a dynamic formula based on standard deviation , allowing for more adaptive and responsive calculations.
Additionally, this script integrates Ehlers' Super Smoother Filter , a highly regarded smoothing technique pioneered by John F. Ehlers and freely available for public use. Beyond these foundations, ZenAlgo - Waves incorporates proprietary logic and unique enhancements, setting it apart from conventional alternatives.
If you're seeking an exact replication of WaveTrend, please note that this indicator follows a distinct methodology, producing different calculations and outputs.
How to Use
Identify Key Zones: Observe Wave oscillator values to detect potential overbought and oversold conditions, which may vary based on settings.
Check RSI+MFI Histogram: Confirm momentum strength—bullish (increasing green bars) or bearish (increasing red bars).
Assess Trend via Extra MA: Use the Extra Moving Average to determine overall trend direction.
Look for Divergences: Identify divergences between price action and Wave/RSI+MFI for potential reversals.
Monitor Multi-Timeframe Trend Table: Check for alignment across timeframes for additional confirmation.
Set Alerts for Key Conditions: Configure alerts for Wave crossovers, divergences, and Extra MA state changes.
Analyze Conditions Before Making Decisions: The indicator does not execute trades. Traders should use it as a confirmation tool alongside a broader strategy.
Detailed Explanation of Calculation Logic
ZenAlgo - Waves builds on established wave-based oscillator principles, fine-tuning them for greater adaptability:
Baseline & Difference: Computes a smoothed average of the price source (e.g., HLC3) and measures the difference (or "deviation") between the current price and this baseline.
Volatility Scaling: Uses standard deviation to capture market volatility instead of relying on a static multiplier.
Normalization & Smoothing: Processes the resulting ratio into an oscillator, helping identify overbought and oversold zones. Optionally applies a secondary smoothing pass (including Ehlers' Super Smoother - SMMA) to reduce noise while preserving trend structure.
RSI + MFI Integration: Fuses RSI and MFI into a single composite metric, weighting RSI momentum with volume-adjusted MFI values for a clearer representation of momentum strength.
Extra Moving Average Filtering: A variety of moving average types (EMA, Hull, ZEMA, etc.) smooth the underlying trend, with sensitivity to trend changes customizable.
Divergence Detection: Identifies both regular and hidden divergences by comparing oscillator movements against price action, adjusting dynamically based on historical volatility.
Multi-Timeframe Trend Confirmation: Aggregates data across multiple timeframes (e.g., 1m, 5m, 15m, 1h) to provide a broader market context.
Alerts and Key Conditions: Alerts can be configured for specific conditions such as Wave crossovers, RSI+MFI confirmation, or Extra MA transitions. These alerts serve as notifications, not as automatic trading signals.
Why It’s Worth Paying For
ZenAlgo - Waves differentiates itself from free indicators by providing:
Contextual Signal Filtering: Integrates price-volume analysis and trend alignment checks.
Adaptive Trend Classification: Dynamically adjusts to market conditions.
Multi-Layer Confirmation: Requires momentum, volume, and trend agreement before providing insights.
Advanced Divergence Detection: Filters out noise-based divergences, highlighting only significant price-action-driven reversals.
Multi-Timeframe Validation: Helps ensure that observed trends are consistent across different timeframes.
Considerations for Use:
During periods of low trading volume, as price action lacks conviction.
In highly volatile market conditions, rapid price swings can introduce uncertainty.
Fundamental news events can override technical patterns.
If trends contradict across multiple timeframes, additional confirmation is recommended before making decisions.
Important Notes
This indicator is a tool for technical analysis and does not guarantee trading success.
Best Practices: Use ZenAlgo - Waves in conjunction with other indicators and fundamental analysis for a well-rounded approach.
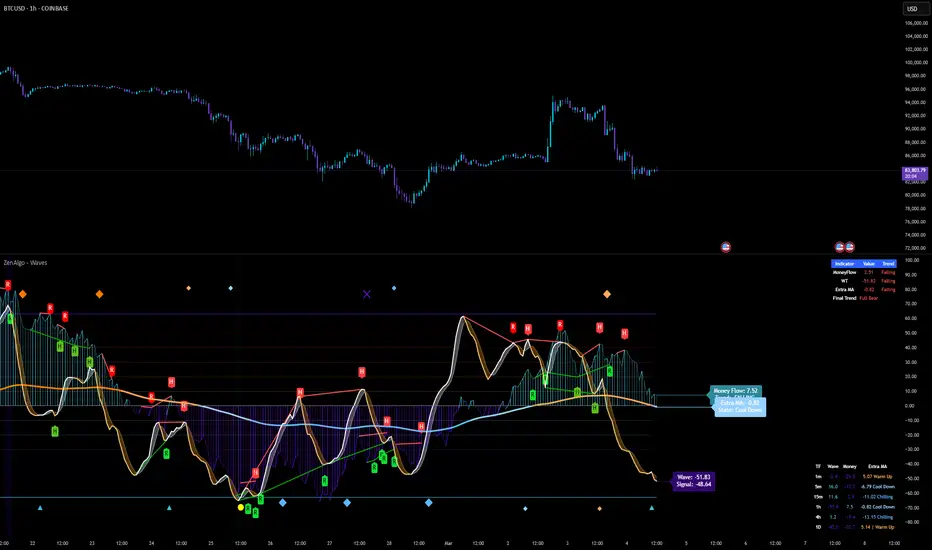
Fibonacci Cycle Finder🟩 Fibonacci Cycle Finder is an indicator designed to explore Fibonacci-based waves and cycles through visualization and experimentation, introducing a trigonometric approach to market structure analysis. Unlike traditional Fibonacci tools that rely on static horizontal levels, this indicator incorporates the dynamic nature of market cycles, using adjustable wavelength, phase, and amplitude settings to visualize the rhythm of price movements. By applying a sine function, it provides a structured way to examine Fibonacci relationships in a non-linear context.
Fibonacci Cycle Finder unifies Fibonacci principles with a wave-based method by employing adjustable parameters to align each wave with real-time price action. By default, the wave begins with minimal curvature, preserving the structural familiarity of horizontal Fibonacci retracements. By adjusting the input parameters, the wave can subtly transition from a horizontal line to a more pronounced cycle,visualizing cyclical structures within price movement. This projective structure extends potential cyclical outlines on the chart, opening deeper exploration of how Fibonacci relationships may emerge over time.
Fibonacci Cycle Finder further underscores a non-linear representation of price by illustrating how wave-based logic can uncover shifts that are missed by static retracement tools. Rather than imposing immediate oscillatory behavior, the indicator encourages a progressive approach, where the parameters may be incrementally modified to align wave structures with observed price action. This refinement process deepens the exploration of Fibonacci relationships, offering a systematic way to experiment with non-linear price dynamics. In doing so, it revisits fundamental Fibonacci concepts, demonstrating their broader adaptability beyond fixed horizontal retracements.
🌀 THEORY & CONCEPT 🌀
What if Fibonacci relationships could be visualized as dynamic waves rather than confined to fixed horizontal levels? Fibonacci Cycle Finder introduces a trigonometric approach to market structure analysis, offering a different perspective on Fibonacci-based cycles. This tool provides a way to visualize market fluctuations through cyclical wave motion, opening the door to further exploration of Fibonacci’s role in non-linear price behavior.
Traditional Fibonacci tools, such as retracements and extensions, have long been used to identify potential support and resistance levels. While valuable for analyzing price trends, these tools assume linear price movement and rely on static horizontal levels. However, market fluctuations often exhibit cyclical tendencies , where price follows natural wave-like structures rather than strictly adhering to fixed retracement points. Although Fibonacci-based tools such as arcs, fans, and time zones attempt to address these patterns, they primarily apply geometric projections. The Fibonacci Cycle Finder takes a different approach by mapping Fibonacci ratios along structured wave cycles, aligning these relationships with the natural curvature of market movement rather than forcing them onto rigid price levels.
Rather than replacing traditional Fibonacci methods, the Fibonacci Cycle Finder supplements existing Fibonacci theory by introducing an exploratory approach to price structure analysis. It encourages traders to experiment with how Fibonacci ratios interact with cyclical price structures, offering an additional layer of insight beyond static retracements and extensions. This approach allows Fibonacci levels to be examined beyond their traditional static form, providing deeper insights into market fluctuations.
📊 FIBONACCI WAVE IMPLEMENTATION 📊
The Fibonacci Cycle Finder uses two user-defined swing points, A and B, as the foundation for projecting these Fibonacci waves. It first establishes standard horizontal levels that correspond to traditional Fibonacci retracements, ensuring a baseline reference before wave adjustments are applied. By default, the wave is intentionally subtle— Wavelength is set to 1 , Amplitude is set to 1 , and Phase is set to 0 . In other words, the wave starts as “stretched out.” This allows a slow, measured start, encouraging users to refine parameters incrementally rather than producing abrupt oscillations. As these parameters are increased, the wave takes on more distinct sine and cosine characteristics, offering a flexible approach to exploring Fibonacci-based cyclicity within price action.
Three parameters control the shape of the Fibonacci wave:
1️⃣ Wavelength Controls the horizontal spacing of the wave along the time axis, determining the length of one full cycle from peak to peak (or trough to trough). In this indicator, Wavelength acts as a scaling input that adjusts how far the wave extends across time, rather than a strict mathematical “wavelength.” Lower values further stretch the wave, increasing the spacing between oscillations, while higher values compress it into a more frequent cycle. Each full cycle is divided into four quarter-cycle segments, a deliberate design choice to minimize curvature by default. This allows for subtle oscillations and smoother transitions, preventing excessive distortion while maintaining flexibility in wave projections. The wavelength is calculated relative to the A-B swing, ensuring that its scale adapts dynamically to the selected price range.
2️⃣ Amplitude Defines the vertical displacement of the wave relative to the baseline Fibonacci level. Higher values increase the height of oscillations, while lower values reduce the height, Negative values will invert the wave’s initial direction. The amplitude is dynamically applied in relation to the A-B swing direction, ensuring that an upward swing results in upward oscillations and a downward swing results in downward oscillations.
3️⃣ Phase Shifts the wave’s starting position along its cycle, adjusting alignment relative to the swing points. A phase of 0 aligns with a sine wave, where the cycle starts at zero and rises. A phase of 25 aligns with a cosine wave, starting at a peak and descending. A phase of 50 inverts the sine wave, beginning at zero but falling first, while a phase of 75 aligns with an inverted cosine , starting at a trough and rising. Intermediate values between these phases create gradual shifts in wave positioning, allowing for finer alignment with observed market structures.
By fine-tuning these parameters, users can adapt Fibonacci waves to better reflect observed market behaviors. The wave structure integrates with price movements rather than simply overlaying static levels, allowing for a more dynamic representation of cyclical price tendencies. This indicator serves as an exploratory tool for understanding potential market rhythms, encouraging traders to test and visualize how Fibonacci principles extend beyond their traditional applications.
🖼️ CHART EXAMPLES 🖼️
Following this downtrend, price interacts with curved Fibonacci levels, highlighting resistance at the 0.236 and 0.382 levels, where price stalls before pulling back. Support emerges at the 0.5, 0.618, and 0.786 levels, where price finds stability and rebounds
In this Fibonacci retracement, price initially finds support at the 1.0 level, following the natural curvature of the cycle. Resistance forms at 0.786, leading to a pullback before price breaks through and tests 0.618 as resistance. Once 0.618 is breached, price moves upward to test 0.5, illustrating how Fibonacci-based cycles may align with evolving market structure beyond static, horizontal retracements.
Following this uptrend, price retraces downward and interacts with the Fibonacci levels, demonstrating both support and resistance at key levels such as 0.236, 0.382, 0.5, and 0.618.
With only the 0.5 and 1.0 levels enabled, this chart remains uncluttered while still highlighting key price interactions. The short cycle length results in a mild curvature, aligning smoothly with market movement. Price finds resistance at the 0.5 level while showing strong support at 1.0, which follows the natural flow of the market. Keeping the focus on fewer levels helps maintain clarity while still capturing how price reacts within the cycle.
🛠️ CONFIGURATION AND SETTINGS 🛠️
Wave Parameters
Wavelength : Stretches or compresses the wave along the time axis, determining the length of one full cycle. Higher values extend the wave across more bars, while lower values compress it into a shorter time frame.
Amplitude : Expands or contracts the wave along the price axis, determining the height of oscillations relative to Fibonacci levels. Higher values increase the vertical range, while negative values invert the wave’s initial direction.
Phase : Offsets the wave along the time axis, adjusting where the cycle begins. Higher values shift the starting position forward within the wave pattern.
Fibonacci Levels
Levels : Enable or disable specific Fibonacci levels (0.0, 0.236, 0.382, 0.5, 0.618, 0.786, 1.0) to focus on relevant price zones.
Color : Modify level colors for enhanced visual clarity.
Visibility
Trend Line/Color : Toggle and customize the trend line connecting swing points A and B.
Setup Lines : Show or hide lines linking Fibonacci levels to projected waves.
A/B Labels Visibility : Control the visibility of swing point labels.
Left/Right Labels : Manage the display of Fibonacci level labels on both sides of the chart.
Fill % : Adjust shading intensity between Fibonacci levels (0% = no fill, 100% = maximum fill).
A and B Points (Time/Price):
These user-defined anchor points serve as the basis for Fibonacci wave calculations and can be manually set. A and B points can also be adjusted directly on the chart, with automatic synchronization to the settings panel, allowing for seamless modifications without needing to manually input values.
⚠️ DISCLAIMER ⚠️
The Fibonacci Cycle Finder is a visual analysis tool designed to illustrate Fibonacci relationships and serve as a supplement to traditional Fibonacci tools. While the indicator employs mathematical and geometric principles, no guarantee is made that its calculations will align with other Fibonacci tools or proprietary methods. Like all technical and visual indicators, the Fibonacci levels generated by this tool may appear to visually align with key price zones in hindsight. However, these levels are not intended as standalone signals for trading decisions. This indicator is intended for educational and analytical purposes, complementing other tools and methods of market analysis.
🧠 BEYOND THE CODE 🧠
Fibonacci Cycle Finder is the latest indicator in the Fibonacci Geometry Series. Building on the concepts of the Fibonacci Time-Price Zones and the Fibonacci 3-D indicators, this tool introduces a trigonometric approach to market structure analysis.
The Fibonacci Cycle Finder indicator, like other xxattaxx indicators , is designed to encourage both education and community engagement. Your feedback and insights are invaluable to refining and enhancing the Fibonacci Cycle Finder indicator. We look forward to the creative applications, observations, and discussions this tool inspires within the trading community.
