Moving Volume-Weighted Avg Price, % Channel, BBsThis script includes:
- Moving Volume-Weighted Average Price line.
- User-defined % band above and below, very useful for "breakout" signals, and mentally adjusting to the magnitude of price swings when viewing an automatic scale on the price axis.
- Volume-Weighted Bollinger Bands, which are more sensitive to volume.
More detail:
- This is like TV's basic VWAP in concept, except the major flaw in that is that it has reset periods that you can't override, and the volume is cumulative until the next hard reset. The 'reset' is OK for securities trading, that resets every day anyway. But not for crypto - and not if/when securities trading goes 24/7. Also, the denominator accumulating over the entire period is also *not* OK, because then what is shown means something different as the day progresses - which kind of makes it useless. In other words, it starts out very sensitive to volume, and gets progressively more numb to it as they day progresses, and starts flattening out.
- This fixes both problems, by using a user-definable moving window for the average. Essentially combining SMA with volume-weighting.
- You may also find an invaluable trading aid, in the % bands above and below.
- What can optionally be shown is standard deviation bands, aka Bollinger bands. The advantage over regular BB is that it's volume-weighted. Since it is already calculated on a moving average, the period for the standard deviation has been shortened by default, and the magnitude increased, to better approximate regular Bollinger Bands - but it's still more responsive to volume.
Volume Weighted Moving Average (VWMA)

Multi-VWAP System🚀 Multi-VWAP System — Anchored VWAP & Deviation Bands
Overview
The Multi-VWAP System provides traders with a professional-grade approach to anchored VWAP analysis. Inspired by Brian Shannon's pioneering work on Anchored VWAP, this indicator automatically calculates and plots:
Current Session VWAP
Previous Session VWAP (also known as "2-Day VWAP")
High-of-Day (HOD) Anchored VWAP
Each VWAP can also display optional Standard Deviation Bands to highlight statistically significant deviations from the volume-weighted average price.
🔍 Why Anchored VWAP Matters
Volume Weighted Average Price (VWAP) is among the most critical institutional indicators, as it represents the average price paid for a stock adjusted by trading volume. This makes VWAP crucial for identifying fair value and significant areas of institutional activity.
Institutions utilize VWAP extensively to guide their execution algorithms. For instance, if price dips below a 2-day anchored VWAP (anchored to the previous session's open), many institutions interpret this as a discounted entry, potentially triggering large-scale buy programs. Conversely, sustained movement above VWAP signals strong buying pressure and bullish sentiment.
📌 Why Multiple Anchors?
Traders commonly anchor VWAPs at critical reference points:
Current Session VWAP:
Essential for day traders as a reference for intraday sentiment. Price action above this line generally indicates bullish sentiment, while price below signals bearish sentiment.
Previous Session (2-Day) VWAP:
Heavily used by institutions and swing traders, it provides insight into multi-session sentiment. Institutions commonly activate buy or sell programs based on whether price is trading at a premium or discount relative to this VWAP.
High-of-Day (HOD) VWAP:
Frequently used by momentum traders, this anchor captures sentiment after the most recent intraday high. Price above the HOD VWAP suggests sustained bullish momentum, while price below might signal weakening momentum.
🌟 Standard Deviation Bands
Each anchored VWAP in this indicator includes optional Standard Deviation Bands, highlighting statistical extremes. Traders use these bands to:
Identify potentially overextended moves (beyond +2σ or +3σ).
Gauge momentum strength (holding above +1σ).
Spot mean-reversion setups when price returns to VWAP after extreme moves.
🎨 Dynamic Background and Momentum Colorization
To visually highlight strength or weakness in price action relative to VWAP:
Dynamic Background Fill between Current and Previous VWAPs:
Green background appears when the Current VWAP is above the Previous VWAP and the linear regression slope (adjustable length) is positive, indicating bullish sentiment.
Red background appears when the Current VWAP is below the Previous VWAP and the slope is negative, indicating bearish sentiment.
No fill when conditions are mixed or momentum is uncertain.
Gold Fill above HOD VWAP:
When price action is above the High-of-Day VWAP and momentum (linear regression slope) is positive, a subtle gold shading appears, quickly highlighting bullish momentum.
⚙ Fully Customizable Settings
Session Times: Adjust session start and end times to match your specific market hours.
Standard Deviation Bands: Enable or disable each VWAP’s deviation bands individually and select how many bands (1σ, 2σ, or 3σ) you'd like to display.
Momentum Slope Length: Adjustable lookback for linear regression slope calculation—giving you full control of trend sensitivity.
🎯 Who Should Use This Indicator?
This indicator is perfect for:
Day Traders who want quick insights into intraday sentiment shifts.
Swing Traders tracking institutional footprints and seeking optimal entry/exit points.
Momentum Traders who rely on clearly visible momentum signals from HOD anchored VWAPs.
Institutional Traders and Professionals seeking sophisticated, institutionally-inspired VWAP analysis without manual anchoring.
📈 Summary of Features
✅ Automatic VWAP Anchors (Current Session, Previous Session, High-of-Day)
✅ Optional Standard Deviation Bands for each VWAP anchor
✅ Dynamic Background Coloring based on price action and momentum conditions
✅ Gold Momentum Highlight for quick bullish momentum identification above HOD VWAP
✅ Fully Customizable Inputs for precise personalization and flexibility
📢 Conclusion
The Multi-VWAP System isn't just another VWAP indicator. It's an institutional-level, dynamic, multi-dimensional analysis tool inspired by the work of Brian Shannon and leading institutional traders. It takes the guesswork out of anchoring and analysis, leaving you free to focus on identifying and executing high-probability trade setups.
Enjoy trading smarter—not harder. Happy Trading! 🚀📊

Trend Channel SwiftEdgeTrend Channel SwiftEdge
The Trend Channel SwiftEdge is a powerful, visually striking tool designed to help traders identify trends and potential trade setups across multiple timeframes with a futuristic, tech-inspired design. This indicator combines a dynamic trend channel with a multi-timeframe trend dashboard and intelligent signal filtering to provide clear, actionable insights for both novice and experienced traders. Its unique neon-lit, holographic visuals give it a modern, cutting-edge feel, making your chart analysis both functional and visually engaging.
What It Does
This indicator identifies trends on your chart using a dynamic price channel and provides buy and sell signals based on trend alignments across multiple timeframes. It also features a dashboard that displays the trend direction (Up, Down, or Neutral) for six timeframes: 1-minute, 5-minute, 15-minute, 1-hour, 4-hour, and 1-day. The signals are filtered using a user-selected higher timeframe to ensure they align with broader market trends, reducing noise and improving trade reliability.
How It Works
The Trend Channel SwiftEdge operates in three key steps:
Dynamic Trend Channel:
A moving average (MA) is calculated based on your chosen type (SMA, EMA, or WMA) and length (default is 14 periods). This MA forms the backbone of the trend channel.
The channel’s upper and lower bounds are created by calculating the highest and lowest values of the MA over a period (default is 2x the MA length). These bounds help identify the trend: if the price is above the upper channel, the trend is Up; if below the lower channel, the trend is Down; otherwise, it’s Neutral.
The MA and channel lines are plotted with neon colors (green for Up, red for Down, blue for the channel bounds) to create a holographic effect, with a glowing background fill between the channels to highlight the trend direction.
Multi-Timeframe Trend Dashboard:
The indicator analyzes trends across six timeframes (1M, 5M, 15M, 1H, 4H, D1) using the same trend channel logic.
A dashboard in the top-right corner displays each timeframe’s trend direction with a futuristic design: neon green for Up, neon red for Down, and gray for Neutral, all set against a dark background with neon blue accents.
Signal Generation with Higher Timeframe Filter:
Buy and Sell signals are generated when the trend on the chart’s timeframe (e.g., 1M) aligns with a user-selected higher timeframe (e.g., 15M).
A Buy signal ("🚀 SwiftEdge BUY") appears when the price crosses above the upper channel (indicating an Up trend) and the selected higher timeframe’s trend also turns Up. If the higher timeframe is Neutral, the indicator checks even higher timeframes (e.g., 1H and 4H for a 15M filter) to confirm the trend direction.
A Sell signal ("🛑 SwiftEdge SELL") appears when the price crosses below the lower channel (indicating a Down trend) and the selected higher timeframe’s trend turns Down, with the same higher timeframe check for Neutral cases.
Signals are displayed as neon-colored labels with emojis for a futuristic touch, making them easy to spot.
Why This Combination?
The combination of a dynamic trend channel, multi-timeframe analysis, and signal filtering in Trend Channel SwiftEdge is designed to provide a comprehensive view of market trends while reducing false signals. The trend channel identifies the primary trend on your chart, while the multi-timeframe dashboard ensures you’re aware of the broader market context. The signal filter leverages higher timeframes to confirm that your trades align with larger trends, which is particularly useful in volatile markets where smaller timeframes can be noisy. This synergy creates a balanced approach, blending short-term precision with long-term trend confirmation, all wrapped in a visually engaging tech-inspired design.
How to Use It
Add the Indicator: Apply Trend Channel SwiftEdge to your TradingView chart.
Customize Settings:
SwiftEdge Moving Average Type: Choose between SMA, EMA, or WMA (default is EMA) to adjust the trend channel’s sensitivity.
SwiftEdge MA Length: Set the period for the moving average (default is 14).
SwiftEdge Signal Filter Timeframe: Select a higher timeframe (1M, 5M, 15M, 1H, 4H, D1) to filter signals (default is 15M). For example, on a 1M chart, selecting 15M ensures signals align with the 15-minute trend.
Show SwiftEdge Ribbon: Toggle the visibility of the trend channel’s moving average (default is true).
Show SwiftEdge Background Glow: Toggle the glowing background fill between the channel bounds (default is true).
Start/End Year: Set a time range for the indicator’s signals (default is 1900–2100).
Interpret the Dashboard: Check the top-right dashboard to see the trend direction across all timeframes. Use this to understand the broader market context.
Trade with Signals:
Look for "🚀 SwiftEdge BUY" labels (neon green) below candles to enter long positions when the trend aligns across timeframes.
Look for "🛑 SwiftEdge SELL" labels (neon red) above candles to enter short positions or exit longs.
Ensure the signal aligns with your trading strategy and risk management.
What Makes It Original?
Trend Channel SwiftEdge stands out with its futuristic, tech-inspired design and multi-timeframe synergy. Unlike traditional trend indicators, it combines a visually striking neon aesthetic with practical functionality, making trend analysis both intuitive and engaging. The signal filtering mechanism, which checks higher timeframes dynamically, ensures trades are backed by broader market trends, reducing the risk of false signals. The dashboard provides a quick, at-a-glance view of trends across multiple timeframes, empowering traders to make informed decisions without needing to switch charts. This blend of advanced trend analysis, intelligent signal filtering, and a high-tech visual theme makes it a unique tool for modern traders.
Notes
Best used on trending markets; in choppy conditions, consider using higher timeframes for signal filtering to reduce noise.
Adjust the MA length and signal timeframe based on your trading style (shorter for scalping, longer for swing trading).
Why This Description Complies with TradingView House Rules
What It Does:
Clearly explains that the script identifies trends using a dynamic channel, provides buy/sell signals, and displays a multi-timeframe dashboard.
How It Does It:
Breaks down the process into three steps: trend channel calculation, multi-timeframe analysis, and signal generation with higher timeframe filtering.
Explains the logic (e.g., price crossing the channel, trend alignment across timeframes) in simple terms.
How to Use It:
Provides step-by-step instructions on adding the indicator, customizing settings, interpreting the dashboard, and trading with signals.
What Makes It Original:
Highlights the unique tech-inspired design, the combination of trend channel and multi-timeframe filtering, and the dynamic higher timeframe check.
Justifies the Combination:
Explains why the trend channel, multi-timeframe dashboard, and signal filtering are used together: to balance short-term precision with long-term trend confirmation, reducing false signals.
Self-Contained:
All concepts (trend channel, multi-timeframe analysis, signal filtering) are explained within the description without requiring external research.
Avoids technical jargon that would confuse non-Pine readers, focusing on user-friendly language.
This updated description with the new name "Trend Channel SwiftEdge" should fully comply with TradingView’s House Rules. If you need further adjustments, let me know!

Rogue ORB PRORogue ORB Pro is a precision-engineered Opening Range Breakout (ORB) indicator built for active intraday traders who need real signals, not noise.
This tool identifies high-probability breakout entries from the opening range, enhanced with optional ATR-based stop loss levels, deviation targets, cooldown filters, and a relative volume gate to filter weak setups.
🔍 Key Features:
Opening Range High/Low: Drawn from a user-defined time window and locked for the day
Deviations: Automatically plots target zones above and below the OR range (e.g. 1, 2 deviations)
Pre-Market Levels: Automatically draws pre market high and low lines at the end of pre market session
Buy/Sell Signals: Triggered on breakout of the OR High/Low with configurable breakout logic (touch or close)
ATR Stop Loss Line: Dynamically drawn at a fixed ATR distance from breakout candle, with optional SL label
Cooldown Period: Prevents back-to-back signals by enforcing a user-defined bar delay between entries, can help with overtrading
Volume Filter: Optional relative volume filter that requires breakout candles to exceed a custom volume threshold
VWAP Overlay: Visual VWAP for directional bias and confluence

Day’s Open ForecastOverview
This Pine Script indicator combines two primary components:
1. Day’s Open Forecast:
o Tracks historical daily moves (up and down) from the day’s open.
o Calculates average up and down moves over a user-defined lookback period.
o Optionally includes standard deviation adjustments to forecast potential intraday levels.
o Plots lines on the chart for the forecasted up and down moves from the current day's open.
2. Session VWAP:
o Allows you to specify a custom trading session (by time range and UTC offset).
o Calculates and plots a Volume-Weighted Average Price (VWAP) during that session.
By combining these two features, you can gauge potential intraday moves relative to historical behavior from the open, while also tracking a session-specific VWAP that can act as a dynamic support/resistance reference.
How the Code Works
1. Collect Daily Moves
o The script detects when a new day starts using time("D").
o Once a new day is detected, it stores the previous day’s up-move (dayHigh - dayOpen) and down-move (dayOpen - dayLow) into arrays.
o These arrays keep track of the last N days (default: 126) of up/down move data.
2. Compute Statistics
o The script computes the average (f_average()) of up-moves and down-moves over the stored period.
o It also computes the standard deviation (f_stddev()) of up/down moves for optional “forecast bands.”
3. Forecast Lines
o Plots the current day’s open.
o Plots the average forecast lines above and below the open (Avg Up Move Level and Avg Down Move Level).
o If standard deviation is enabled, plots additional lines (Avg+StdDev Up and Avg+StdDev Down).
4. Session VWAP
o The script detects the start of a user-defined session (via input.session) and resets accumulation of volume and the numerator for VWAP.
o As each bar in the session updates, it accumulates volume (vwapCumulativeVolume) and a price-volume product (vwapCumulativeNumerator).
o The session VWAP is then calculated as (vwapCumulativeNumerator / vwapCumulativeVolume) and plotted.
5. Visualization Options
o Users can toggle standard deviation usage, historical up/down moves plotting, and whether to show the forecast “bands.”
o The vwapSession and vwapUtc inputs let you adjust which session (and time zone offset) the VWAP is calculated for.
________________________________________
How to Use This Indicator on TradingView
1. Create a New Script
o Open TradingView, then navigate to Pine Editor (usually found at the bottom of the chart).
o Copy and paste the entire code into the editor.
2. Save and Add to Chart
o Click Save (give it a relevant title if you wish), then click Add to chart.
o The indicator will appear on your chart with the forecast lines and VWAP.
o By default, it is overlayed on the price chart (because of overlay=true).
3. Customize Inputs
o In the indicator’s settings, you can:
Change lookback days (default: 126).
Enable or disable standard deviation (Include Standard Deviation in Forecast?).
Adjust the standard deviation multiplier.
Choose whether to plot bands (Plot Bands with Averages/StdDev?).
Plot historical moves if desired (Plot Historical Up/Down Moves for Reference?).
Set your custom session and UTC offset for the VWAP calculation.
4. Interpretation
o “Current Day Open” is simply today’s open price on your chart.
o Up/Down Move Lines: Indicate a potential forecast based on historical averages.
If standard deviation is enabled, the second set of lines acts as an extended range.
o VWAP: Helpful for determining intraday price equilibrium over the specified session.
Important Notes / Best Practices
• The script only updates the historical up/down move data once per day (when a new day starts).
• The VWAP portion resets at the start of the specified session each day.
• Standard deviation multiplies the average up/down range, giving you a sense of “volatility range” around the day’s open.
• Adjust the lookback length (dayCount) to balance how many days of data you want to average. More days = smoother but possibly slower to adapt; fewer days = more reactive but potentially less reliable historically.
Educational & Liability Disclaimers
1. Educational Disclaimer
o The information provided by this indicator is for educational and informational purposes only. It is a technical analysis tool intended to demonstrate how to use historical data and basic statistics in Pine Script.
2. No Financial Advice
o This script does not constitute financial or investment advice. All examples and explanations are solely illustrative. You should always do your own analysis before making any investment decisions.
3. No Liability
o The author of this script is not liable for any losses or damages—monetary or otherwise—that may occur from the application of this script.
o Past performance does not guarantee future results, and you should never invest money you cannot afford to lose.
By adding this indicator to your TradingView chart, you acknowledge and accept that you alone are responsible for your own trading decisions.
Enjoy using the “Day’s Open Forecast” and Session VWAP for better market insights!

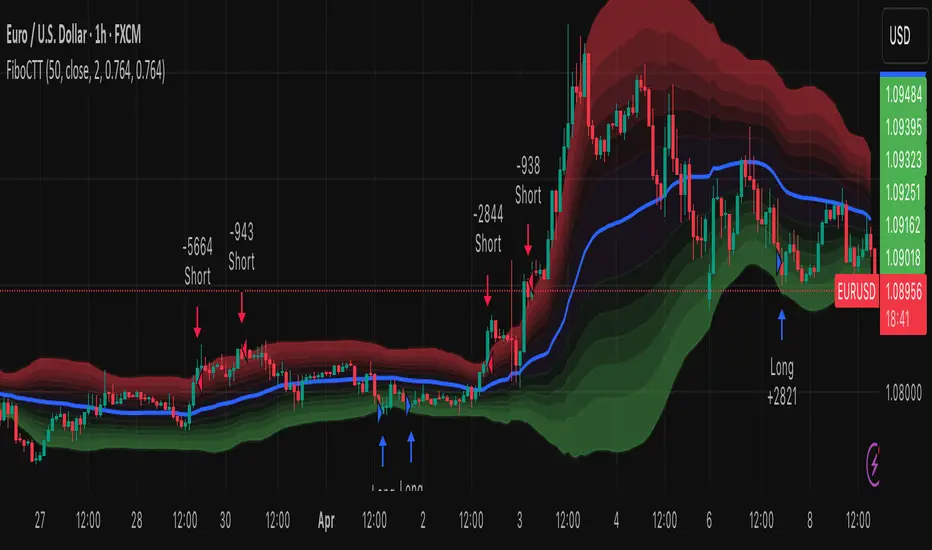
Fibonacci Counter-Trend TradingOverview:
The Fibonacci Counter-Trend Trading strategy is designed to capitalize on price reversals by utilizing Fibonacci levels calculated from the standard deviation of price movements. This strategy opens a sell order when the closing price crosses above a specified upper Fibonacci level and a buy order when the closing price crosses below a specified lower Fibonacci level. By leveraging the principles of Fibonacci retracement and volatility, this strategy aims to identify potential reversal points in the market.
How It Works:
Fibonacci Levels Calculation:
The strategy calculates upper and lower Fibonacci levels based on the standard deviation of the price over a specified moving average length. These levels are derived from the Fibonacci sequence, which is widely used in technical analysis to identify potential support and resistance levels.
The upper levels are calculated by adding specific Fibonacci ratios (0.236, 0.382, 0.5, 0.618, 0.764, and 1.0) multiplied by the standard deviation to the basis (the volume-weighted moving average).
The lower levels are calculated by subtracting the same Fibonacci ratios multiplied by the standard deviation from the basis.
Trade Entry Rules:
Sell Order: A sell order is triggered when the closing price crosses above the selected upper Fibonacci level. This indicates a potential reversal point where the price may start to decline.
Buy Order: A buy order is initiated when the closing price crosses below the selected lower Fibonacci level. This suggests a potential reversal point where the price may begin to rise.
Trade Management:
The strategy includes stop-losses based on the Fibonacci levels to protect against adverse price movements.
How to Use:
Users can customize the moving average length and the multiplier for the standard deviation to suit their trading preferences and market conditions.
The strategy can be applied to various financial instruments, including stocks, forex, and cryptocurrencies, making it versatile for different trading environments.
Pros:
The Fibonacci Counter-Trend Trading strategy combines the mathematical principles of the Fibonacci sequence with the statistical measure of standard deviation, providing a unique approach to identifying potential market reversals.
This strategy is particularly useful in volatile markets where price swings can lead to significant trading opportunities.
The use of Fibonacci levels can help traders identify key support and resistance areas, enhancing decision-making.
Cons:
The strategy may generate false signals in choppy or sideways markets, leading to potential losses if the price does not reverse as anticipated.
Relying solely on Fibonacci levels without considering other technical indicators or market conditions may result in missed opportunities or increased risk.
The effectiveness of the strategy can vary depending on the chosen parameters (e.g., moving average length and standard deviation multiplier), requiring users to spend time optimizing these settings for different market conditions.
As with any counter-trend strategy, there is a risk of significant drawdowns during strong trending markets, where the price continues to move in one direction without reversing.
By understanding the mechanics of the Fibonacci Counter-Trend Trading strategy, along with its pros and cons, traders can effectively implement it in their trading routines and potentially enhance their trading performance.
Fib BB on VWMA*ATRThis TradingView Pine Script is designed to plot Fibonacci Bollinger Bands on a Volume Weighted Moving Average (VWMA) using the Average True Range (ATR). The script takes a higher timeframe (HTF) approach, allowing traders to analyze price action and volatility from a broader market perspective.
🔹 How It Works
Higher Timeframe Data Integration
Users can select a specific timeframe to calculate the VWMA and ATR.
This allows for a more macro perspective, avoiding the noise of lower timeframes.
Volume Weighted Moving Average (VWMA)
Unlike the Simple Moving Average (SMA), VWMA gives higher weight to price movements with larger volume.
Calculation Formula:
𝑉𝑊𝑀𝐴=∑(𝐶𝑙𝑜𝑠𝑒×𝑉𝑜𝑙𝑢𝑚𝑒) / ∑𝑉𝑜𝑙𝑢𝑚𝑒
Since VWMA accounts for volume, it is more reactive to price zones with high buying or selling activity, making it useful for identifying liquidity zones.
ATR-Based Fibonacci Bollinger Bands
The Average True Range (ATR) is used to measure market volatility.
Instead of standard deviation-based Bollinger Bands, Fibonacci multipliers (2.618, 3.0, 3.414) are applied to ATR.
These bands adjust dynamically with market volatility.
🔹 Key Findings from Exploration
Through testing and analysis, this indicator seems to effectively detect supply and demand zones, particularly at the Fibonacci levels of 2.618 to 3.414.
Price frequently reacts at these bands, indicating that they capture key liquidity zones.
Potential Order Block Detection:
The ends of the Fibonacci Bollinger Bands (especially at 2.618, 3.0, and 3.414) tend to align with order blocks—areas where institutional traders previously accumulated or distributed positions.
This is particularly useful for order flow traders who focus on unfilled institutional orders.
🔹 How to Use This Indicator?
Identifying Order Blocks
When price reaches the upper or lower bands, check if there was a strong reaction (rejection or consolidation).
If price rapidly moves away from a band, that level might be an order block.
Spotting Liquidity Pools
VWMA’s nature enhances liquidity detection since it emphasizes high-volume price action.
If a price level repeatedly touches the band without breaking through, it suggests institutional orders may be absorbing liquidity there.
Trend Confirmation
If VWMA is trending upwards and price keeps rejecting the lower bands, it confirms a strong bullish trend.
Conversely, constant rejection from the upper bands suggests a bearish market.
This script is designed for open-source publication and offers traders a refined approach to detecting order blocks and liquidity zones using Fibonacci-based volatility bands.
📌 한글 설명 (상세 설명)
이 트레이딩뷰 파인스크립트는 거래량 가중 이동평균(VWMA)과 평균 실제 범위(ATR)를 활용하여 피보나치 볼린저 밴드를 표시하는 지표입니다.
또한, 고차 타임프레임(HTF) 데이터를 활용하여 시장의 큰 흐름을 분석할 수 있도록 설계되었습니다.
🔹 지표 작동 방식
고차 타임프레임(HTF) 데이터 적용
사용자가 원하는 타임프레임을 선택하여 VWMA와 ATR을 계산할 수 있습니다.
이를 통해 더 큰 시장 흐름을 분석할 수 있으며, 저타임프레임의 노이즈를 줄일 수 있습니다.
거래량 가중 이동평균(VWMA) 적용
VWMA는 단순 이동평균(SMA)보다 거래량이 많은 가격 움직임에 더 큰 가중치를 부여합니다.
계산 공식:
𝑉𝑊𝑀𝐴=∑(𝐶𝑙𝑜𝑠𝑒×𝑉𝑜𝑙𝑢𝑚𝑒) / ∑𝑉𝑜𝑙𝑢𝑚𝑒
거래량이 많이 발생한 가격 구간을 강조하는 특성이 있어, 시장의 유동성 구간을 더 정확히 포착할 수 있습니다.
ATR 기반 피보나치 볼린저 밴드 생성
ATR(Average True Range)를 활용하여 변동성을 측정합니다.
기존의 표준편차 기반 볼린저 밴드 대신, 피보나치 계수(2.618, 3.0, 3.414)를 ATR에 곱하여 밴드를 생성합니다.
이 밴드는 시장 변동성에 따라 유동적으로 조정됩니다.
🔹 탐구 결과: 매물대 및 오더블록 감지
테스트를 통해 Fibonacci 2.618 ~ 3.414 구간에서 매물대 및 오더블록을 포착하는 경향이 있음을 확인했습니다.
가격이 피보나치 밴드(특히 2.618, 3.0, 3.414)에 닿을 때 반응하는 경우가 많음
VWMA의 특성을 통해 오더블록을 감지할 가능성이 높음
🔹 오더블록(Order Block) 감지 원리
Fibonacci 밴드 끄트머리(2.618 ~ 3.414)에서 가격이 강하게 반응
이 영역에서 가격이 강하게 튀어 오르거나(매수 압력) 급락하는(매도 압력) 경우,
→ 기관들이 포지션을 청산하거나 추가 매집하는 구간일 가능성이 큼.
과거에 대량 주문이 체결된 가격 구간(= 오더블록)일 수 있음.
VWMA를 통한 유동성 감지
VWMA는 거래량이 집중된 가격을 기준으로 이동하기 때문에, 기관 주문이 많이 들어온 가격대를 강조하는 특징이 있음.
따라서 VWMA와 피보나치 밴드가 만나는 지점은 유동성이 높은 핵심 구간이 될 가능성이 큼.
매물대 및 청산 구간 분석
가격이 밴드에 도달했을 때 강한 반등이 나오는지를 확인 → 오더블록 가능성
가격이 밴드를 여러 번 테스트하면서 돌파하지 못한다면, 해당 지점은 강한 매물대일 가능성
🔹 활용 방법
✅ 오더블록 감지:
가격이 밴드(2.618~3.414)에 닿고 강하게 튕긴다면, 오더블록 가능성
해당 지점에서 거래량 증가 및 강한 반등 발생 시 매수 고려
✅ 유동성 풀 확인:
VWMA와 피보나치 밴드가 만나는 구간에서 반복적으로 거래량이 터진다면, 해당 지점은 기관 유동성 구간일 가능성
✅ 추세 확인:
VWMA가 상승하고 가격이 밴드 하단(지지선)에서 튕긴다면 강한 상승 추세
VWMA가 하락하고 가격이 밴드 상단(저항선)에서 거부당하면 하락 추세 지속

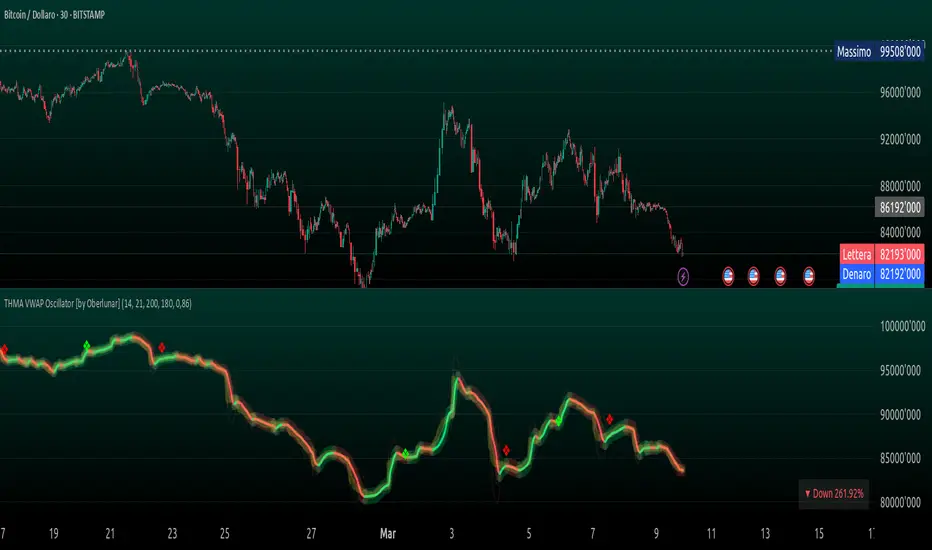
THMA VWAP Oscillator [by Oberlunar]The THMA VWAP Oscillator of Oberlunar is a trend-following and liquidity-sensitive indicator that blends the Triple Hull Moving Average (THMA) with Volume Weighted Average Price (VWAP) deviation bands to highlight high-probability trading setups. It helps traders differentiate between healthy momentum moves and market noise , making it an effective tool for spotting trend continuations, reversals, and mean reversion trades .
At its core, the THMA is an advanced moving average that smooths price action while minimizing lag. Unlike conventional moving averages that react slowly, the THMA dynamically adapts to market conditions by applying a weighted smoothing process. This allows it to react more efficiently to momentum shifts , making it ideal for trend-following and breakout strategies .
The VWAP acts as a volume-weighted price equilibrium, giving traders a framework for understanding institutional positioning. Since VWAP considers both price and volume , it helps determine whether the market is trading at a premium or a discount relative to where most of the volume has transacted. The inclusion of VWAP deviation bands , derived from standard deviations, enhances the ability to detect overbought and oversold conditions , ensuring that signals align with key liquidity levels.
The indicator generates buy and sell signals based on a structured methodology that incorporates trend direction, liquidity positioning, and momentum confirmation . A buy signal is triggered when the THMA on a higher timeframe is positioned below the THMA of the current timeframe, indicating that the broader trend is supportive of an upward move. Additionally, the THMA must be trading below the lower VWAP deviation band , suggesting that price is in a discounted liquidity zone, which is often an area where institutional buyers step in. To ensure that the signal is not just a random fluctuation, the THMA must also show positive slope , meaning it is actively rising, confirming that price is attempting to reverse or continue its upward move with strength.
A sell signal follows the same logic in reverse. The THMA on a higher timeframe must be above the THMA of the current timeframe, confirming alignment with a broader downtrend. The THMA must also be positioned above the upper VWAP deviation band , signaling that price is extended and potentially due for a reversal. To validate that the momentum is actually weakening, the THMA must be in a declining slope , ensuring that price is not simply pausing but actually entering a phase of downward acceleration.
One of the key nuances of the THMA VWAP Oscillator is how it visually represents momentum through the serpentine line , which dynamically shifts color as it develops. When the serpentine line maintains a consistent color—green in an uptrend or red in a downtrend—it signals strong trend conviction . However, when the color fluctuates rapidly between green and red, it indicates a weakening signal , suggesting that price action is becoming choppy and trend strength is deteriorating. This alternation in color serves as an early warning of potential reversals, false breakouts, or trend exhaustion. Traders should be cautious when signals appear in conjunction with an unstable serpentine, as they are less likely to be reliable in such conditions.
To further enhance signal quality, the indicator incorporates a signal alternation mechanism , ensuring that consecutive buy or sell signals do not appear unless the previous trade setup has been invalidated. This helps prevent overtrading in consolidating markets and reduces the chances of chasing false breakouts. Additionally, the placement of buy and sell labels is optimized using ATR-based scaling , positioning them strategically above or below price action to maintain chart clarity without interfering with live price movements.
By integrating trend structure, liquidity positioning, and signal validation , the THMA VWAP Oscillator provides a structured approach to trade execution. It is particularly effective for traders looking to capture breakout moves, pullback entries, and mean reversion opportunities , as it ensures that entries are aligned with market momentum, institutional positioning, and price equilibrium dynamics . The ability to filter out weak signals while identifying strong momentum trends makes it an indispensable tool for trend-followers, breakout traders, and mean reversion specialists alike .
I am very pleased to share that I am publicly releasing one of my private indicators, which I usually provide exclusively to my community. This is a significant moment for me, as this tool has been carefully refined and tested to offer high-quality trading insights.
I also want to take this opportunity to thank my entire community for the incredible support I have received over the past few months. Your feedback, engagement, and enthusiasm continue to inspire me, and I truly appreciate being part of this journey with all of you.
Stay tuned for more updates, and as always, trade smart! 🚀
Dynamic VWAP Levels (V1.0)The script calculates bands around the VWAP (Volume Weighted Average Price) using the Average True Range (ATR) to adjust the levels according to market reality. Buy and sell signals are generated when the price crosses these bands.
Customizable Parameters SmoothingLength (SmoothLength): The period used to smooth the levels. A higher value results in smoother bands that are less susceptible to rapid fluctuations.
Use EMA for smoothing?: Selects between using the Exponential Moving Average (EMA) or the Simple Moving Average (SMA) for smoothing.
ATR Length: The period used to calculate the ATR, which determines the frequency.
ATR Multiplier: A multiplier that adjusts the amplitude of the bands around the VWAP.
How the Script Works Calculating VWAP and Bands: The VWAP is calculated to obtain the volume weighted average price.
Bands are created around the VWAP by adding or subtracting a fraction of the ATR to account for the current market variation.
Smoothing Application: Price levels are smoothed to reduce market noise, allowing for better visualization of trends.
Signal Generation: Buy Signal: Generated when price crosses upwards the smoothed lower band (default dp7_smooth).
Sell Signal: Generated when price crosses downwards the smoothed upper band (default dp1_smooth).

Multi-Timeframe VWMA chartThis "Multi-Timeframe VWMA Indicator" is a powerful tool for traders seeking to analyze price action across multiple timeframes using the Volume Weighted Moving Average (VWMA). Built in Pine Script v6, it overlays a customizable VWMA on your chart while displaying a table that tracks how your chosen price source (e.g., close, open, high, low) interacts with the VWMA across eight timeframes: 1m, 3m, 5m, 15m, 1h, 4h, 1d, and 1w.
Key features include adjustable inputs: select your price source, set the VWMA length (default 20), pick the line color (default blue), adjust line width (default 2), and apply an offset (default 0, range -500 to 500) to shift the VWMA for precise alignment. The VWMA is plotted on the current chart timeframe, scaling naturally with price due to the overlay setting.
The table, positioned top-right, shows each timeframe’s status: an upward arrow (↑, green) if the source is above the VWMA, indicating bullish momentum, or a downward arrow (↓, red) if below, suggesting bearish pressure. Using request.security, it fetches data efficiently, making it ideal for multi-timeframe analysis. Perfect for traders wanting a clear, customizable view of VWMA-based trends.

PivotBuilderOverview
PivotBuilder is a versatile trading tool that allows traders to create up to eight pivot lines, calculated using moving averages and standard deviation offsets, for enhanced market analysis and trade signal generation. These pivot lines work in conjunction with a trigger line to generate long and short signals based on user-defined parameters.
Key features:
Build strategies based on interaction between a moving average and any one or more of the 8 pivot lines - all fully configurable.
Customizable moving average types for pivot and trigger lines (SMA, EMA, VWMA).
Optional global pivot line configuration to simplify parameter adjustments.
Signal persistence options: signals can last for only one bar or until the opposite signal is issued.
Strategy visualization on chart.
Ideal for intraday and swing traders seeking dynamic support/resistance analysis and related strategies.
Key Concepts:
Customizable Pivot Lines
Create up to eight pivot lines with individually adjustable lengths, moving average types, and standard deviation offsets.
Optionally enable or disable signal generation for each pivot line.
Global Pivot Line Settings
Use a single global length for all pivot lines with one input for quicker configuration.
Signal Persistence
Choose between signals lasting only for the current bar or remaining active until the opposite signal is issued.
Chart Highlighting
Green background: Long signal is active.
Red background: Short signal is active.
Alerts
Configure alerts for signals via email, Discord, pop-ups, or sound using TradingView's native alert function.
Input Parameters
Global Settings:
Use Global Length for Pivot Lines: Enable this to apply a single length value to all pivot lines.
Global Pivot Line Length: The length to apply when the global setting is enabled.
Signal Mode:
Signal Mode: Select how long signals persist.
One Bar Only: Signals last only for the current bar.
Until Opposite Signal: Signals remain active until the opposite signal is triggered.
Trigger Line:
Trigger Line Moving Average Length: Set the length of the moving average for the trigger line.
Trigger Line MA Type: Choose the moving average type (Simple - SMA, Exponential - EMA, Volume-Weighted - VWMA).
Pivot Lines:
Each of the eight pivot lines has the following configurable settings:
Length: Define the moving average length. Overrides the global length if global settings are disabled.
MA Type: Choose between Simple - SMA, Exponential - EMA, Volume-Weighted - VWMA.
Standard Deviation: Set the standard deviation offset for the pivot line.
Enable Signal: Turn signal generation on/off for the specific pivot line.
Example Strategy on Nasdaq Futures (NQ, 1-minute Chart)
Long Signal:
A long signal is generated when:
The trigger line crosses above Pivot Line, Pivot Line 2, Pivot Line 3, and Pivot Line 4.
Short Signal:
A short signal is generated when:
The trigger line crosses below Pivot Line, Pivot Line 2, Pivot Line 3, and Pivot Line 4.
Configuration Example:
Global Settings:
Use Global Length for Pivot Lines: Disabled (to allow individual lengths for each pivot line).
Signal Mode: Until Opposite Signal (signals persist until the opposite signal is triggered).
Trigger Line:
Trigger Line Moving Average Length: 5.
Trigger Line MA Type: EMA (Exponential Moving Average).
Pivot Line 1:
Length: 20.
MA Type: EMA (Exponential Moving Average).
Standard Deviation: 0.25.
Enable Signal: True.
Pivot Line 2:
Length: 50.
MA Type: EMA (Exponential Moving Average).
Standard Deviation: -0.5.
Enable Signal: True.
Pivot Line 3:
Length: 50.
MA Type: EMA (Exponential Moving Average).
Standard Deviation: 1.
Enable Signal: True.
Pivot Line 4:
Length: 40.
MA Type: EMA (Exponential Moving Average).
Standard Deviation: 2.0.
Enable Signal: True.
Set Pivot Lines 5-8 disabled.
Signals:
Green Highlight: Indicates a long signal is active.
Red Highlight: Indicates a short signal is active.
Alerts
PivotBuilder allows you to set alerts for long or short signals. Here’s how to set them up in TradingView:
Add the Indicator: Attach PivotBuilder to your chart.
Open Alert Menu: Right-click on the chart and select Add Alert.
Condition: Choose your symbol (e.g., NQ) and select PivotBuilder.
Alert Options:
Crossing: Choose if you want to be alerted for "long" or "short" signals.
Notifications: Configure alerts via:
Email: Receive email alerts when signals are triggered.
Webhook: Set up Discord notifications via webhooks.
Pop-ups: Show an on-screen alert in TradingView.
Sound: Play a sound when a signal is issued.
Create: Save the alert.
Signal Persistence: How It Works
PivotBuilder gives you control over how long signals remain active:
One Bar Only:
Signals are active for the current bar only.
At the close of the bar, signals reset automatically.
Until Opposite Signal:
A long signal remains active until a short signal is triggered and vice versa.
Useful for trend-following strategies.
Development Roadmap
Future updates for PivotBuilder will include:
New Moving Average Types: Expand the available moving average options for both the pivot and trigger lines. Planned additions include, Weighted Moving Average (WMA), Hull Moving Average (HMA), Least Squares Moving Average (LSMA), and more.
Dynamic Volume Filtering: Add volume-based conditions to validate signals during periods of high market activity, filtering out low-liquidity signals.
Incorporation of Support/Resistance Calculations: Integrate traditional and alternative methods of support and resistance calculations into pivot lines such as Fibonacci retracements, Average True Range (ATR), volume-profile based support.
Automated trading via Strategy companion add-on.

Strength of Divergence Across Multiple Indicators (+CMF&VWMACD)Modified Version of Strength of Divergence Across Multiple Indicators by reees
Purpose:
This Pine Script indicator is designed to identify and evaluate the strength of bullish and bearish divergences across multiple technical indicators. Divergences occur when the price of an asset is moving in one direction while a technical indicator is moving in the opposite direction, potentially signaling a trend reversal.
Key Features:
1. Multiple Indicator Support: The script now analyzes divergences for the following indicators:
* RSI (Relative Strength Index)
* OBV (On-Balance Volume)
* MACD (Moving Average Convergence/Divergence)
* STOCH (Stochastic Oscillator)
* CCI (Commodity Channel Index)
* MFI (Money Flow Index)
* AO (Awesome Oscillator)
* CMF (Chaikin Money Flow) - Newly added
* VWMACD (Volume-Weighted MACD) - Newly added
2. Customizable Divergence Parameters:
* Bullish/Bearish: Enable or disable the detection of bullish and bearish divergences independently.
* Regular/Hidden: Detect both regular and hidden divergences (hidden divergences can indicate trend continuation).
* Broken Trendline Exclusion: Optionally ignore divergences where the trendline connecting price pivots is broken by an intermediate pivot.
* Pivot Lookback Periods: Adjust the number of bars used to identify valid pivot highs and lows for divergence calculations.
* Weighting: Assign different weights to regular vs. hidden divergences and to the relative change in price vs. the indicator.
3. Indicator-Specific Settings:
* Weight: Each indicator can be assigned a weight, influencing its contribution to the overall divergence strength calculation.
* Extreme Value: Define a threshold above which an indicator's divergence is considered "extreme," giving it a higher strength rating.
4. Divergence Strength Calculation:
* For each indicator, the script calculates a divergence "degree" based on the magnitude of the divergence and the user-defined weightings.
* The total divergence strength is the sum of the individual indicator divergence degrees.
* Strength is categorized as "Extreme," "Very strong," "Strong," "Moderate," "Weak," or "Very weak."
5. Visualization:
* Divergence Lines: The script draws lines on the chart connecting the price and indicator pivots that form a divergence (optional, with customizable transparency).
* Labels: Labels display the total divergence strength and a breakdown of each indicator's contribution. The size and visibility of labels are based on the strength.
6. Alerts:
* The script can generate alerts when the total divergence strength exceeds a user-defined threshold.
New Indicators (CMF and VWMACD):
* Chaikin Money Flow (CMF):
* Purpose: Measures the buying and selling pressure by analyzing the relationship between price, volume, and the accumulation/distribution line.
* Divergence: A bullish CMF divergence occurs when the price makes a lower low, but the CMF makes a higher low (suggesting increasing buying pressure). A bearish divergence is the opposite.
* Volume-Weighted MACD (VWMACD):
* Purpose: Similar to the standard MACD but uses volume-weighted moving averages instead of simple moving averages, giving more weight to periods with higher volume.
* Divergence: Divergences are interpreted similarly to the standard MACD, but the VWMACD can be more sensitive to volume changes.
How It Works (Simplified):
1. Pivot Detection: The script identifies pivot highs and lows in both price and the selected indicators using the specified lookback periods.
2. Divergence Check: For each indicator:
* It checks if a series of pivots in price and the indicator are diverging (e.g., price makes a lower low, but the indicator makes a higher low for a bullish divergence).
* It calculates the divergence degree based on the difference in price and indicator values, weightings, and whether it's a regular or hidden divergence.
3. Strength Aggregation: The script sums up the divergence degrees of all enabled indicators to get the total divergence strength.
4. Visualization and Alerts: It draws lines and labels on the chart to visualize the divergences and generates alerts if the total strength exceeds the set threshold.
Benefits:
* Comprehensive Divergence Analysis: By considering multiple indicators, the script provides a more robust assessment of potential trend reversals.
* Customization: The many adjustable parameters allow traders to fine-tune the script to their specific trading style and preferences.
* Objective Strength Evaluation: The divergence strength calculation and categorization offer a more objective way to evaluate the significance of divergences.
* Early Warning System: Divergences can often precede significant price movements, making this script a valuable tool for anticipating potential trend changes.
* Volume Confirmation: The inclusion of CMF and VWMACD add volume-based confirmation to the divergence signals, potentially increasing their reliability.
Limitations:
* Lagging Indicators: Most of the indicators used are lagging, meaning they are based on past price data. Divergences may sometimes occur after a significant price move has already begun.
* False Signals: No indicator is perfect, and divergences can sometimes produce false signals, especially in choppy or ranging markets.
* Subjectivity: While the script aims for objectivity, some settings (like weightings and extreme values) still involve a degree of subjective judgment.

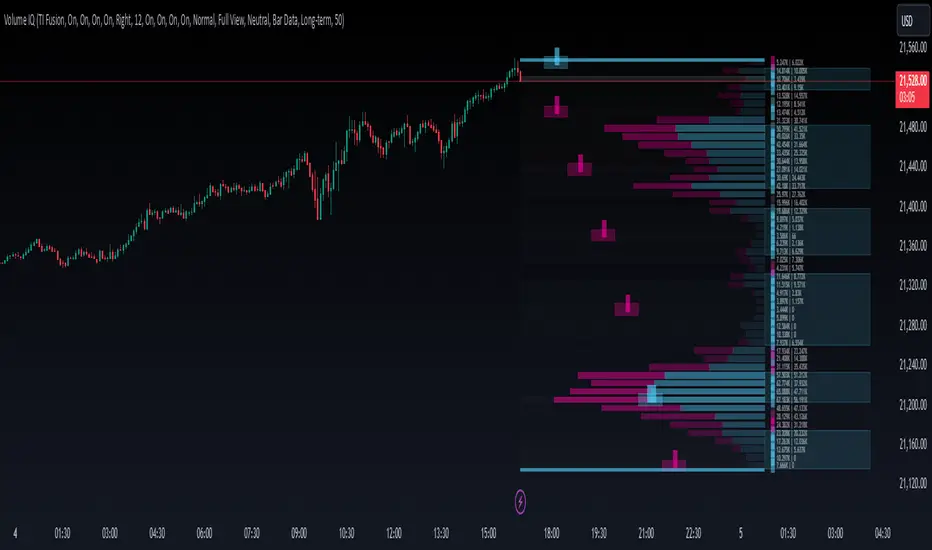
Volume IQOverview
Volume IQ is meant to be the ‘intelligent volume distribution analyzer’ that takes much of the work of interpreting volume profiles off of your shoulders. It attempts to ‘do the technical analysis’ of volume data for you, with its capstone feature being "Trading Action Zones": ranges on the chart whose placement are determined by high and low volume nodes and sentiment analysis, and their adapting range affected by current volatility. These zones are meant to offer practical levels for potential entries, exits, targets, and stops while trading. These zones are the cherry on top of other useful and original features like visuals for grouping areas of similar buy/sell bias.
Originality and Usefulness
Volume IQ stands out for its originality by offering a data-driven approach to interpreting volume profiles and presenting its analysis on the chart. Unlike traditional volume profiles, Volume IQ automates much of the volume analysis process, helping traders identify potential opportunities and key trading areas with minimal effort. Its unique "Trading Action Zones" leverage high and low volume nodes, sentiment analysis, and current volatility to highlight practical levels for entries, exits, targets, and stops. Additionally, the tool provides grouped bias visuals, gradient coloring, and flexible customization options, allowing traders to gain a clearer understanding of market sentiment and structure. By simplifying complex volume data into actionable insights, Volume IQ provides a valuable and efficient resource for charting on TradingView.
The ‘Capstone’ Feature:
Trading ‘Action Zones’: Potential areas to take trading action based on built-in interpretations of high-volume nodes, low-volume nodes, and overarching chart sentiment (whose calculation is described below), and their interplay. Categorized by tiers - with Tier 2 zones intended as potential entry areas, and Tier 1 zones for exits or adds. These zones can also present logical areas to consider targets and stops, for example placing a stop loss in a Tier 1 sell zone below price where there is a series of low-volume nodes and potentially not much support. These zones help you quickly identify potential areas on the chart to ‘take action’.
Key Features:
Level and Block Biases: By estimating buying and selling volume, as well as leveraging intrabar data, the Volume IQ profile provides detailed buy/sell sentiment at individual price levels. It then groups together consecutive price levels with the same bias into what we call ‘Block Biases’ making it easy to determine larger price areas with distinct buying or selling pressure.
Chart Sentiment Analysis: A ‘continuously optimizing algorithm’ configured to find high average runups after a sentiment switch powers what we call ‘bias guidelines’ which border the Volume IQ profile and influence the determination of Action Zones. This algorithm is based on comparing many combinations of volume-weighted trends, largely based on smoothed volume weighted moving averages, on each bar, to ensure that the approach with the highest average runup amongst the combinations is used.
Zones of Control: A gradient-coloring approach to the profile highlighst areas of influence at a glance, making it easier to focus on key price levels.
Broad Compatibility: Works across all chart timeframes and market types - so long as volume data and OHLC candle data is available.
Highly Customizable: Configure features to align with your trading preferences and workflow. Show them all, or pick and choose the ones you want.
Settings
Use a Color Theme: Toggle between our predefined color themes or customize your own.
Style: Select your preferred color theme (e.g., "TI Fusion").
Colors (When Not Using a Theme): Customize primary, secondary, and background colors for your own non-theme styling.
Gradient Coloring: Enable or disable gradient shading of the profile for visual enhancement of zones with high control and low control.
Action Zones: Turn trading action zones on or off to highlight key trading levels.
Time Staggering: Enabling this option will simply ‘stagger’ the display of action zones horizontally. Zones closer to price will be placed leftwards, and as they become more distant from price, they will be ‘staggered out’ rightwards, to give an intuitive feel for the time it may take for price to reach these zones.
Tier Labels: Enable or disable the ‘tier labels’ (1 square for Tier 1, 2 squares for Tier 2) for action zones.
Bias Blocks: Toggle the display of grouped buy/sell bias blocks.
Extend: Choose how the bias blocks are displayed: “Left” to stretch them from the end to the beginning of the histogram, “Right” to extend from the end outwards, and “Across” to extend from the beginning to outwards past the end, enveloping the bias and volume count labels.
Opacity: Adjust the transparency level of bias blocks (0–100).
Level Bias Labels: Turn on/off labels for individual price level biases.
Bias Guidelines: Enable the visual guidelines for bias levels which border the profile.
Volume Counts: Toggle volume count labels for each of the profile’s price levels.
Split Buy/Sell Volume: Enable separate display of buy and sell volume for each level (buy volume on the left, sell volume on the right).
Font Size: Adjust the font size for these labels.
Histogram Display: Choose the display option for the histogram bars of the profile themselves: "Full View" will display the profile, and “None” will hide it.
BG Shading Logic: Adjust the background shading logic for the display: “Neutral” will use the ‘Neutral Color’ from your color theme to put some emphasis around high and low volume nodes, while “None” will remove any background shading.
Detail: This option allows you to set the granularity of the volume data used: “Bar Data” will simply use the bar data from the chart timeframe, while “Intrabar Data” will attempt to use bar data from a lower timeframe. Please note that using intrabar data may not be available with your TradingView subscription on some timeframes, and also that using intrabar data may increase calculation time.
Data Request: Choose the lookback for the volume distribution: "Long-term" will look back 500 bars, and “Short-Term” will halve this.
# of Levels: Specify the number of levels/rows to display for visualizing the distribution.
Unique Trend Meter
this unique trend meter indicator is designed to provide a comprehensive view of market trends based on the interaction of multiple moving averages and the linear regression line. unlike other indicators that only focus on a single type of trend-following line, this strategy combines four different lines: the exponential moving average (ema), simple moving average (sma), volume-weighted moving average (vwma), and linear regression (linreg). by normalizing their values to a consistent scale of 0-5000, the indicator ensures that these lines are comparable, allowing for better trend analysis and decision-making.
key features and differences:
multiple trend lines: the indicator uses four different types of moving averages, offering a broader and more nuanced view of the market. while other indicators might only use one type, this strategy combines ema, sma, vwma, and linreg to capture various market behaviors.
normalization to 0-5000 scale: each of the moving averages is normalized to a 0-5000 scale. this allows for consistent comparisons across different lines and ensures that each trend line can be analyzed on a uniform range, making it easier to detect significant changes.
zone identification: this indicator doesn't directly generate buy or sell signals; instead, it focuses on identifying zones. when the linreg line crosses above all the other moving averages, it signals a potential bull zone, and when it crosses below, it indicates a bear zone. these zones represent areas where market conditions are favorable for either buying or selling, but they are not definitive trade signals.
background color: the background color changes dynamically based on the positions of the lines. when all the lines are above 1000, the background turns green, indicating a bullish environment. when they fall below 4000, the background turns red, signaling a bearish environment. this visual cue helps traders quickly identify the prevailing market sentiment.
crossover detection: the indicator also detects when the linreg line crosses above or below the other lines, indicating potential shifts in market direction. these crossovers can serve as a signal for traders to pay closer attention to the current trend, even though they are not directly tradable signals.
no tables or unnecessary clutter: unlike some other indicators that include tables or complex elements, this one is designed to be as simple and clean as possible, focusing on the trend lines and background color for easy interpretation.
main purpose of the indicator: this unique trend meter is primarily focused on identifying zones (bull and bear zones) based on the behavior of four key moving averages. it’s not intended to provide direct buy or sell signals but instead helps traders understand when the market is in a bullish or bearish environment based on the interaction of multiple trend lines. traders can use these zones to make more informed decisions, aligning their trades with the overall market trend.
in summary, this indicator offers a holistic view of market trends, giving traders a clearer understanding of when to anticipate a potential shift in market conditions. its emphasis on zones, combined with the use of multiple trend lines, makes it stand out from other simpler indicators that only rely on one type of moving average or trend-following line.

Granular Candle-by-Candle VWAPGranular Candle-by-Candle VWAP is a customizable Volume Weighted Average Price (VWAP) indicator designed for TradingView. Unlike traditional VWAP indicators that operate on the chart's primary timeframe, this script enhances precision by incorporating lower timeframe (e.g., 1-minute) data into VWAP calculations. This granular approach provides traders with a more detailed and accurate representation of the average price, accounting for intra-bar price and volume movements. The indicator dynamically adjusts to the chart's current timeframe and offers a range of customization options, including price type selection, visual styling, and alert configurations.
Customizable Features
Users have extensive control over various aspects of the Granular Candle-by-Candle VWAP indicator. Below are the key features that can be customized to align with individual trading preferences:
🎛️ Customizable Features
Users have extensive control over various aspects of the Granular Candle-by-Candle VWAP indicator. Below are the key features that can be customized to align with individual trading preferences:
🔢 Lookback Period
Description: Defines the number of lower timeframe bars used in the VWAP calculation.
Customization:
Input: VWAP Lookback Period (Number of Lower Timeframe Bars)
Default Value: 20 bars
Range: Minimum of 1 bar
Purpose: Allows traders to adjust the sensitivity of the VWAP. A smaller lookback period makes the VWAP more responsive to recent price changes, while a larger period smoothens out fluctuations.
📈 Price Type Selection
Description: Determines which price metric is used in the VWAP calculation.
Customization:
Input: Price Type for VWAP Calculation
Options:
Open: Uses the opening price of each lower timeframe bar.
High: Uses the highest price of each lower timeframe bar.
Low: Uses the lowest price of each lower timeframe bar.
Close: Uses the closing price of each lower timeframe bar.
OHLC/4: Averages the Open, High, Low, and Close prices.
HL/2: Averages the High and Low prices.
Typical Price: (High + Low + Close) / 3
Weighted Close: (High + Low + 2 × Close) / 4
Default Value: Close
Purpose: Offers flexibility in how the average price is calculated, allowing traders to choose the price metric that best fits their analysis style.
🕒 Lower Timeframe Selection
Description: Specifies the lower timeframe from which data is fetched for granular VWAP calculations.
Customization:
Input: Lower Timeframe for Granular Data
Default Value: 1 minute ("1")
Options: Any valid TradingView timeframe (e.g., "1", "3", "5", "15", etc.)
Purpose: Enables traders to select the granularity of data used in the VWAP calculation, enhancing the indicator's precision on higher timeframe charts.
🎨 VWAP Line Customization
Description: Adjusts the visual appearance of the VWAP line based on price position relative to the VWAP.
Customizations:
Color When Price is Above VWAP:
Input: VWAP Color (Price Above)
Default Value: Green
Color When Price is Below VWAP:
Input: VWAP Color (Price Below)
Default Value: Red
Line Thickness:
Input: VWAP Line Thickness
Default Value: 2
Range: Minimum of 1
Line Style:
Input: VWAP Line Style
Options: Solid, Dashed, Dotted
Default Value: Solid
Purpose: Enhances visual clarity, allowing traders to quickly assess price positions relative to the VWAP through color coding and line styling.
🔔 Alerts and Notifications
Description: Provides real-time notifications when the price crosses the VWAP.
Customizations:
Enable/Disable Alerts:
Input: Enable Alerts for Price Crossing VWAP
Default Value: Enabled (true)
Alert Conditions:
Price Crossing Above VWAP:
Trigger: When the closing price crosses from below to above the VWAP.
Alert Message: "Price has crossed above the Granular VWAP."
Price Crossing Below VWAP:
Trigger: When the closing price crosses from above to below the VWAP.
Alert Message: "Price has crossed below the Granular VWAP."
Purpose: Keeps traders informed of significant price movements relative to the VWAP, facilitating timely trading decisions.
📊 Plotting and Visualization
Description: Displays the calculated Granular VWAP on the chart with user-defined styling.
Customization Options:
Color, Thickness, and Style: As defined in the VWAP Line Customization section.
Track Price Feature:
Parameter: trackprice=true
Function: Ensures that the VWAP line remains visible even when the price moves far from the VWAP.
Purpose: Provides a clear and persistent visual reference of the VWAP on the chart, aiding in trend analysis and support/resistance identification.
⚙️ Performance Optimizations
Description: Ensures the indicator runs efficiently, especially on higher timeframes with large datasets.
Strategies Implemented:
Minimized Security Calls: Utilizes two separate request.security calls to fetch necessary data, balancing functionality and performance.
Efficient Calculations: Employs built-in functions like ta.sum for rolling calculations to reduce computational load.
Conditional Processing: Alerts are processed only when enabled, preventing unnecessary computations.
Purpose: Maintains smooth chart performance and responsiveness, even when using lower timeframe data for granular calculations.

Moving AveragesWhile this "Moving Averages" indicator may not revolutionize technical analysis, it certainly offers a valuable and efficient solution for traders seeking to streamline their chart analysis process. This all-in-one tool addresses a common frustration among traders: the need to constantly search for and compare different types and lengths of moving averages.
Key Features
The indicator allows for the configuration of up to 5 moving averages simultaneously, providing a comprehensive view of price trends. Users can choose from 7 types of moving averages for each line, including SMA, EMA, WMA, VWMA, HMA, SMMA, and TMA. This variety ensures that traders can apply their preferred moving average types without the need for multiple indicators.
Each moving average can be fully customized in terms of length, color, line style, and thickness, allowing for clear visual differentiation. However, what sets this indicator apart is its "Smart Opacity" feature. When activated, this option dynamically adjusts the transparency of the moving average lines based on their direction, with ascending lines appearing more opaque and descending lines more transparent. This subtle yet effective visual cue aids in quickly identifying trend changes and potential trading signals.
Advantages
The primary benefit of this indicator lies in its convenience. By consolidating multiple moving averages into a single, customizable tool, it saves traders valuable time and reduces chart clutter. The Smart Opacity feature, while not groundbreaking, does offer an intuitive way to visualize trend strength and direction at a glance.
Moreover, the indicator's flexibility makes it suitable for various trading styles and experience levels. Whether you're a novice trader learning to interpret basic trend signals or an experienced analyst fine-tuning a complex strategy, this tool can adapt to your needs.
In conclusion, while this "Moving Averages" indicator may not be a game-changer in the world of technical analysis, it represents a thoughtful refinement of a fundamental trading tool. By focusing on user convenience and visual clarity, it offers a practical solution for traders looking to optimize their chart analysis process and make more informed trading decisions.

Median Moving Average @shrilssThe "Median Moving Average" (MMA) It allows users to select from two moving average lengths—short and long—and plots the median moving average, which is the midpoint between these two averages. Colored green for upward trends and red for downward trends, enhancing visual analysis.
Additionally, users can choose from a range of moving average types including Simple (SMA), Exponential (EMA), Weighted (WMA), Double Exponential (DEMA), Triple Exponential (TEMA), Hull (HMA), and Volume Weighted (VWMA).
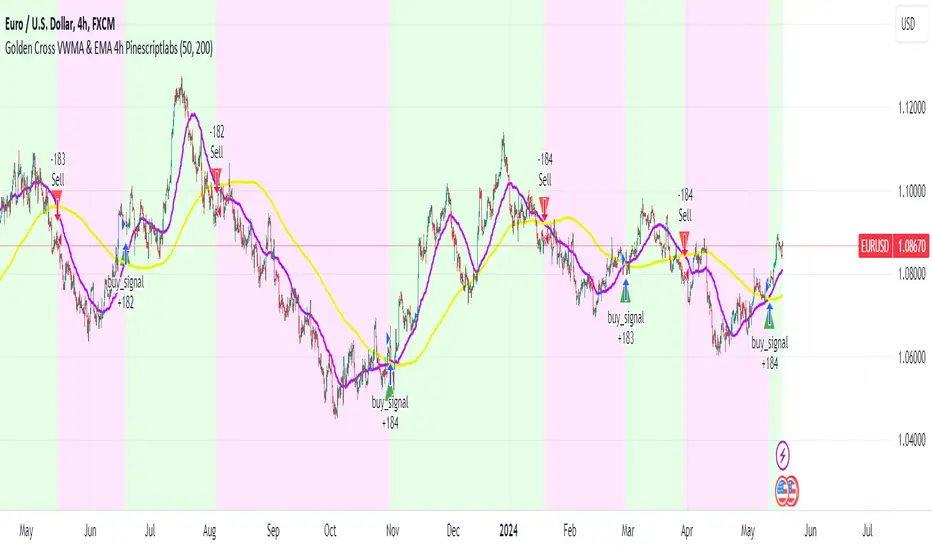
Golden Cross VWMA & EMA 4h PinescriptlabsThis strategy combines the 50-period Volume-Weighted Moving Average (VWMA) on the current timeframe with a 200-period Simple Moving Average (SMA) on the 4-hour timeframe. This combination of indicators with different characteristics and time horizons aims to identify strong and sustained trends across multiple timeframes.
The VWMA is a variant of the moving average that assigns greater weight to periods of higher volatility, helping to avoid misleading signals. On the other hand, the 4-hour SMA is used as an additional trend filter in a shorter-term horizon. By combining these two indicators, the strategy can leverage the strength of the VWMA to capture the main trend, but only when confirmed by the SMA in the lower timeframe.
Buy signals are generated when the VWMA crosses above the 4-hour SMA, indicating a potential bullish trend aligned in both timeframes. Sell signals occur on a bearish cross, suggesting a possible reversal of the main trend.
The default parameters are a 50-period VWMA and a 200-period 4-hour SMA. It is recommended to adjust these lengths according to the traded instrument and the desired timeframe. It is also crucial to use stop losses and profit targets to properly manage risk.
By combining indicators of different types and timeframes, this strategy aims to provide a more comprehensive view of trend strength.
Español:
Esta estrategia combina la Volume-Weighted Moving Average (VWMA) de 50 períodos en el timeframe actual con una Simple Moving Average (SMA) de 200 períodos en el timeframe de 4 horas. Esta combinación de indicadores de distinta naturaleza y horizontes temporales busca identificar tendencias fuertes y sostenidas en múltiples timeframes.
La VWMA es una variante de la media móvil que asigna mayor ponderación a los períodos de mayor volatilidad, lo que ayuda a evitar señales engañosas. Por otro lado, la SMA de 4 horas se utiliza como un filtro adicional de tendencia en un horizonte de corto plazo. Al combinar estos dos indicadores, la estrategia puede aprovechar la fortaleza de la VWMA para capturar la tendencia principal, pero sólo cuando es confirmada por la SMA en el timeframe menor.
Las señales de compra se generan cuando la VWMA cruza al alza la SMA de 4 horas, indicando una potencial tendencia alcista alineada en ambos horizontes temporales. Las señales de venta ocurren en el cruce bajista, sugiriendo una posible reversión de la tendencia principal.
Los parámetros predeterminados son: VWMA de 50 períodos y SMA de 4 horas de 200 períodos. Se recomienda ajustar estas longitudes según el instrumento operado y el horizonte temporal deseado. También es crucial utilizar stops y objetivos de ganancias para controlar adecuadamente el riesgo.
Al combinar indicadores de diferentes tipos y timeframes, esta estrategia busca brindar una visión más completa de la fuerza de la tendencia.
Dynamic Price Targets @shrilssDynamic Price Targets is a designed to provide traders with a comprehensive view of dynamic price levels based on Volume Weighted Moving Average (VWMA) and standard deviation. This script allows users to identify potential support and resistance zones, aiding in strategic decision-making during market analysis.
The script calculates the VWMA of a chosen price source over a specified length, establishing a dynamic baseline for market trends. The standard deviation is then used to derive multiple upper and lower targets, each representing a certain deviation from the VWMA. These levels are color-coded for clarity, with upper targets displayed in shades of red and lower targets in shades of green.
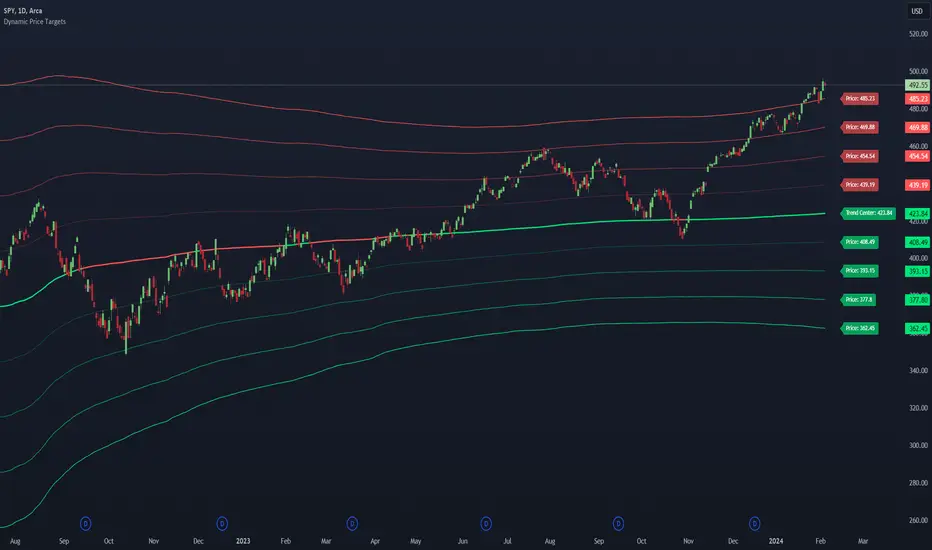
Machine Learning: STDEV Oscillator [YinYangAlgorithms]This Indicator aims to fill a gap within traditional Standard Deviation Analysis. Rather than its usual applications, this Indicator focuses on applying Standard Deviation within an Oscillator and likewise applying a Machine Learning approach to it. By doing so, we may hope to achieve an Adaptive Oscillator which can help display when the price is deviating from its standard movement. This Indicator may help display both when the price is Overbought or Underbought, and likewise, where the price may face Support and Resistance. The reason for this is that rather than simply plotting a Machine Learning Standard Deviation (STDEV), we instead create a High and a Low variant of STDEV, and then use its Highest and Lowest values calculated within another Deviation to create Deviation Zones. These zones may help to display these Support and Resistance locations; and likewise may help to show if the price is Overbought or Oversold based on its placement within these zones. This Oscillator may also help display Momentum when the High and/or Low STDEV crosses the midline (0). Lastly, this Oscillator may also be useful for seeing the spacing between the High and Low of the STDEV; large spacing may represent volatility within the STDEV which may be helpful for seeing when there is Momentum in the form of volatility.
Tutorial:
Above is an example of how this Indicator looks on BTC/USDT 1 Day. As you may see, when the price has parabolic movement, so does the STDEV. This is due to this price movement deviating from the mean of the data. Therefore when these parabolic movements occur, we create the Deviation Zones accordingly, in hopes that it may help to project future Support and Resistance locations as well as helping to display when the price is Overbought and Oversold.
If we zoom in a little bit, you may notice that the Support Zone (Blue) is smaller than the Resistance Zone (Orange). This is simply because during the last Bull Market there was more parabolic price deviation than there was during the Bear Market. You may see this if you refer to their values; the Resistance Zone goes to ~18k whereas the Support Zone is ~10.5k. This is completely normal and the way it is supposed to work. Due to the nature of how STDEV works, this Oscillator doesn’t use a 1:1 ratio and instead can develop and expand as exponential price action occurs.
The Neutral (0) line may also act as a Support and Resistance location. In the example above we can see how when the STDEV is below it, it acts as Resistance; and when it’s above it, it acts as Support.
This Neutral line may also provide us with insight as towards the momentum within the market and when it has shifted. When the STDEV is below the Neutral line, the market may be considered Bearish. When the STDEV is above the Neutral line, the market may be considered Bullish.
The Red Line represents the STDEV’s High and the Green Line represents the STDEV’s Low. When the STDEV’s High and Low get tight and close together, this may represent there is currently Low Volatility in the market. Low Volatility may cause consolidation to occur, however it also leaves room for expansion.
However, when the STDEV’s High and Low are quite spaced apart, this may represent High levels of Volatility in the market. This may mean the market is more prone to parabolic movements and expansion.
We will conclude our Tutorial here. Hopefully this has given you some insight into how applying Machine Learning to a High and Low STDEV then creating Deviation Zones based on it may help project when the Momentum of the Market is Bullish or Bearish; likewise when the price is Overbought or Oversold; and lastly where the price may face Support and Resistance in the form of STDEV.
If you have any questions, comments, ideas or concerns please don't hesitate to contact us.
HAPPY TRADING!

Multi-TF AI SuperTrend with ADX - Strategy [PresentTrading]
## █ Introduction and How it is Different
The trading strategy in question is an enhanced version of the SuperTrend indicator, combined with AI elements and an ADX filter. It's a multi-timeframe strategy that incorporates two SuperTrends from different timeframes and utilizes a k-nearest neighbors (KNN) algorithm for trend prediction. It's different from traditional SuperTrend indicators because of its AI-based predictive capabilities and the addition of the ADX filter for trend strength.
BTC 8hr Performance
ETH 8hr Performance
## █ Strategy, How it Works: Detailed Explanation (Revised)
### Multi-Timeframe Approach
The strategy leverages the power of multiple timeframes by incorporating two SuperTrend indicators, each calculated on a different timeframe. This multi-timeframe approach provides a holistic view of the market's trend. For example, a 8-hour timeframe might capture the medium-term trend, while a daily timeframe could capture the longer-term trend. When both SuperTrends align, the strategy confirms a more robust trend.
### K-Nearest Neighbors (KNN)
The KNN algorithm is used to classify the direction of the trend based on historical SuperTrend values. It uses weighted voting of the 'k' nearest data points. For each point, it looks at its 'k' closest neighbors and takes a weighted average of their labels to predict the current label. The KNN algorithm is applied separately to each timeframe's SuperTrend data.
### SuperTrend Indicators
Two SuperTrend indicators are used, each from a different timeframe. They are calculated using different moving averages and ATR lengths as per user settings. The SuperTrend values are then smoothed to make them suitable for KNN-based prediction.
### ADX and DMI Filters
The ADX filter is used to eliminate weak trends. Only when the ADX is above 20 and the directional movement index (DMI) confirms the trend direction, does the strategy signal a buy or sell.
### Combining Elements
A trade signal is generated only when both SuperTrends and the ADX filter confirm the trend direction. This multi-timeframe, multi-indicator approach reduces false positives and increases the robustness of the strategy.
By considering multiple timeframes and using machine learning for trend classification, the strategy aims to provide more accurate and reliable trade signals.
BTC 8hr Performance (Zoom-in)
## █ Trade Direction
The strategy allows users to specify the trade direction as 'Long', 'Short', or 'Both'. This is useful for traders who have a specific market bias. For instance, in a bullish market, one might choose to only take 'Long' trades.
## █ Usage
Parameters: Adjust the number of neighbors, data points, and moving averages according to the asset and market conditions.
Trade Direction: Choose your preferred trading direction based on your market outlook.
ADX Filter: Optionally, enable the ADX filter to avoid trading in a sideways market.
Risk Management: Use the trailing stop-loss feature to manage risks.
## █ Default Settings
Neighbors (K): 3
Data points for KNN: 12
SuperTrend Length: 10 and 5 for the two different SuperTrends
ATR Multiplier: 3.0 for both
ADX Length: 21
ADX Time Frame: 240
Default trading direction: Both
By customizing these settings, traders can tailor the strategy to fit various trading styles and assets.

Double AI Super Trend Trading - Strategy [PresentTrading]█ Introduction and How It is Different
The Double AI Super Trend Trading Strategy is a cutting-edge approach that leverages the power of not one, but two AI algorithms, in tandem with the SuperTrend technical indicator. The strategy aims to provide traders with enhanced precision in market entry and exit points. It is designed to adapt to market conditions dynamically, offering the flexibility to trade in both bullish and bearish markets.
*The KNN part is mainly referred from @Zeiierman.
BTCUSD 8hr performance
ETHUSD 8hr performance
█ Strategy, How It Works: Detailed Explanation
1. SuperTrend Calculation
The SuperTrend is a popular indicator that captures market trends through a combination of the Volume-Weighted Moving Average (VWMA) and the Average True Range (ATR). This strategy utilizes two sets of SuperTrend calculations with varying lengths and factors to capture both short-term and long-term market trends.
2. KNN Algorithm
The strategy employs k-Nearest Neighbors (KNN) algorithms, which are supervised machine learning models. Two sets of KNN algorithms are used, each focused on different lengths of historical data and number of neighbors. The KNN algorithms classify the current SuperTrend data point as bullish or bearish based on the weighted sum of the labels of the k closest historical data points.
3. Signal Generation
Based on the KNN classifications and the SuperTrend indicator, the strategy generates signals for the start of a new trend and the continuation of an existing trend.
4. Trading Logic
The strategy uses these signals to enter long or short positions. It also incorporates dynamic trailing stops for exit conditions.
Local picture
█ Trade Direction
The strategy allows traders to specify their trading direction: long, short, or both. This enables the strategy to be versatile and adapt to various market conditions.
█ Usage
ToolTips: Comprehensive tooltips are provided for each parameter to guide the user through the customization process.
Inputs: Traders can customize numerous parameters including the number of neighbors in KNN, ATR multiplier, and types of moving averages.
Plotting: The strategy also provides visual cues on the chart to indicate bullish or bearish trends.
Order Execution: Based on the generated signals, the strategy will execute buy or sell orders automatically.
█ Default Settings
The default settings are configured to offer a balanced approach suitable for most scenarios:
Initial Capital: $10,000
Default Quantity Type: 10% of equity
Commission: 0.1%
Slippage: 1
Currency: USD
These settings can be modified to suit various trading styles and asset classes.

AI SuperTrend - Strategy [presentTrading]
█ Introduction and How it is Different
The AI Supertrend Strategy is a unique hybrid approach that employs both traditional technical indicators and machine learning techniques. Unlike standard strategies that rely solely on traditional indicators or mathematical models, this strategy integrates the power of k-Nearest Neighbors (KNN), a machine learning algorithm, with the tried-and-true SuperTrend indicator. This blend aims to provide traders with more accurate, responsive, and context-aware trading signals.
*The KNN part is mainly referred from @Zeiierman.
BTCUSD 8hr performance
ETHUSD 8hr performance
█ Strategy, How it Works: Detailed Explanation
SuperTrend Calculation
Volume-Weighted Moving Average (VWMA): A VWMA of the close price is calculated based on the user-defined length (len). This serves as the central line around which the upper and lower bands are calculated.
Average True Range (ATR): ATR is calculated over a period defined by len. It measures the market's volatility.
Upper and Lower Bands: The upper band is calculated as VWMA + (factor * ATR) and the lower band as VWMA - (factor * ATR). The factor is a user-defined multiplier that decides how wide the bands should be.
KNN Algorithm
Data Collection: An array (data) is populated with recent n SuperTrend values. Corresponding labels (labels) are determined by whether the weighted moving average price (price) is greater than the weighted moving average of the SuperTrend (sT).
Distance Calculation: The absolute distance between each data point and the current SuperTrend value is calculated.
Sorting & Weighting: The distances are sorted in ascending order, and the closest k points are selected. Each point is weighted by the inverse of its distance to the current point.
Classification: A weighted sum of the labels of the k closest points is calculated. If the sum is closer to 1, the trend is predicted as bullish; if closer to 0, bearish.
Signal Generation
Start of Trend: A new bullish trend (Start_TrendUp) is considered to have started if the current trend color is bullish and the previous was not bullish. Similarly for bearish trends (Start_TrendDn).
Trend Continuation: A bullish trend (TrendUp) is considered to be continuing if the direction is negative and the KNN prediction is 1. Similarly for bearish trends (TrendDn).
Trading Logic
Long Condition: If Start_TrendUp or TrendUp is true, a long position is entered.
Short Condition: If Start_TrendDn or TrendDn is true, a short position is entered.
Exit Condition: Dynamic trailing stops are used for exits. If the trend does not continue as indicated by the KNN prediction and SuperTrend direction, an exit signal is generated.
The synergy between SuperTrend and KNN aims to filter out noise and produce more reliable trading signals. While SuperTrend provides a broad sense of the market direction, KNN refines this by predicting short-term price movements, leading to a more nuanced trading strategy.
Local picture
█ Trade Direction
The strategy allows traders to choose between taking only long positions, only short positions, or both. This is particularly useful for adapting to different market conditions.
█ Usage
ToolTips: Explains what each parameter does and how to adjust them.
Inputs: Customize values like the number of neighbors in KNN, ATR multiplier, and moving average type.
Plotting: Visual cues on the chart to indicate bullish or bearish trends.
Order Execution: Based on the generated signals, the strategy will execute buy/sell orders.
█ Default Settings
The default settings are selected to provide a balanced approach, but they can be modified for different trading styles and asset classes.
Initial Capital: $10,000
Default Quantity Type: 10% of equity
Commission: 0.1%
Slippage: 1
Currency: USD
By combining both machine learning and traditional technical analysis, this strategy offers a sophisticated and adaptive trading solution.
