Rolling VWAP Indicator🧭 Rolling VWAP Indicator
Overview
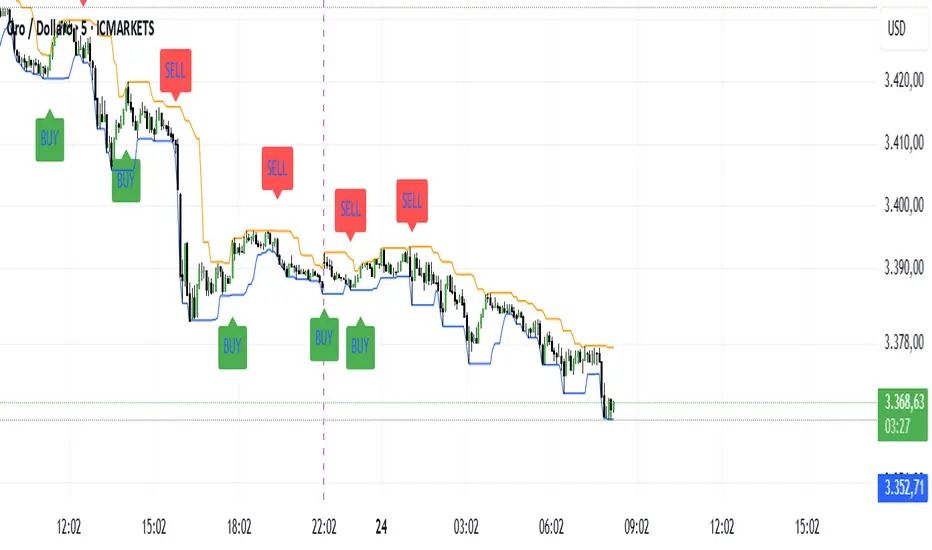
The Rolling VWAP Signals indicator offers a clean, real-time view of price behavior relative to its volume-weighted fair value.
It extends the traditional VWAP concept by introducing a Rolling VWAP that continuously adapts over a dynamic window of recent bars, allowing traders to visualize evolving equilibrium zones without being limited to daily or session resets.
Additionally, it includes a Multi-Timeframe (MTF) Trend Bias Filter — designed not to recalculate VWAP across timeframes, but to confirm directional alignment with higher-timeframe momentum. This ensures that short-term signals are traded only when the broader bias agrees, reducing false reversals and improving signal quality.
VWAP vs Rolling VWAP
The Volume-Weighted Average Price (VWAP) is one of the most widely used institutional benchmarks.
It represents the average traded price weighted by volume — effectively the market’s “fair value.”
However, standard VWAP resets each day or session, losing continuity across time and ignoring cumulative order flow beyond that session.
The Rolling VWAP used here continuously recalculates over a moving window of the most recent bars:
• It adapts naturally to 24×7 markets such as crypto and indices.
• It reflects the current consensus of price and volume rather than starting from zero each morning.
• It acts as a dynamic fair-value magnet, showing when price deviates too far from equilibrium.
In short:
• Standard VWAP → resets daily, suited for intraday benchmarks.
• Rolling VWAP → continuous measure of short-term market balance and sentiment.
How It Works
1. Rolling VWAP Calculation
Uses the last N bars (auto-adjusted by timeframe: e.g., 288 for 5-min, 96 for 15-min, 24 for 1-hour) to compute the continuously weighted mean price:
RVWAP = \frac{\sum(Price \times Volume)}{\sum(Volume)}
2. VWAP Bands
Three deviation envelopes are plotted above and below RVWAP at user-defined percentages — visual zones of overbought/oversold or expansion/compression.
3. Signal Logic
• Buy Signal: price closes above the Rolling VWAP after being below (bullish reclaim).
• Sell Signal: price closes below the Rolling VWAP after being above (bearish rejection).
• Cooldown Period: blocks repeated signals within a set bar interval to avoid whipsaws.
4. MTF Trend Bias
• Pulls higher-timeframe trend direction (e.g., from 1-hour while trading 5-min).
• Signals are confirmed only when short-term cross aligns with higher-timeframe bias.
• This filter does not modify or recalculate the VWAP — it purely acts as a directional validator.
5. Session Filter
Restrict signal generation to defined trading hours and timezone (e.g., 09:30–13:00 NY). Its for US market positional traders.
6. Dashboard Panel
Displays system states: data sufficiency, session activity, VWAP bias, cooldown status, and Buy/Sell signal triggers.
Why It’s Useful
• Provides a real-time adaptive fair-value anchor instead of static daily VWAP.
• Highlights both trend continuation and mean-reversion zones.
• Integrates MTF bias confirmation to trade only in line with higher-timeframe flow.
• Eliminates clutter — no oscillators or complex models, just price vs volume behavior.
How to Use
1. Apply on any timeframe (5M–4H).
2. Observe Buy (green) and Sell (red) signals relative to the blue Rolling VWAP line.
3. Enable MTF Trend Bias to confirm signals with higher-timeframe direction.
4. Use deviation bands for identifying overextended conditions or pullback opportunities.
5. Monitor the dashboard for live system feedback.
Customization
• Auto or manual Rolling VWAP window.
• Adjustable band multipliers.
• MTF bias confirmation toggle.
• Session and timezone settings.
• Dashboard size and placement.
Conceptual Takeaway
The Rolling VWAP Simple Signals indicator combines the strength of volume-weighted mean reversion with higher-timeframe directional filtering, producing clear, context-aware entries and exits.
It answers two critical trader questions:
“Where is the real, volume-based fair value right now?”
“Does my signal align with the larger trend?”
⚠️ Disclaimer
This indicator is designed s olely for educational and analytical purposes . It does not constitute financial advice, investment recommendation, or trading signal service. Trading involves substantial risk and may not be suitable for all investors. Always perform your own analysis and use proper risk management before taking any trade. The author assumes no liability for financial losses resulting from the use or interpretation of this tool.
Vwapbreakout

CloudfareCloudfare - Advanced Market Sentiment Visualization System
What It Does:
Cloudfare is a proprietary market sentiment analysis tool that visualizes real-time money flow and order flow through a dynamic cloud system. Unlike traditional indicators that lag price action, Cloudfare provides forward-looking market sentiment analysis by combining multiple proprietary algorithms.
Core Innovation - Dynamic Cloud Technology:
The cloud system is the primary innovation, not a simple mashup of existing indicators. It uses a proprietary algorithm that:
Analyzes money flow velocity through volume-weighted price action
Calculates institutional order flow patterns using proprietary OBV modifications
Implements a unique "breathing" algorithm that expands/contracts based on market volatility
Uses color-coded transparency to indicate sentiment strength (0-100 scale)
Proprietary Signal Generation:
Higher High/Lower Low Pattern Recognition: Custom algorithm that identifies price breakouts with 3-bar confirmation and volume divergence analysis
Signal Strength Scoring: Proprietary 0-100 scoring system that combines price action, volume surge detection, RSI momentum shifts, and money flow velocity
Dynamic Glow System: Signal brightness adapts to market conditions - brighter signals indicate higher probability setups
Technical Methodology:
Money Flow Analysis: Custom MFI implementation with volume weighting and momentum calculations
Order Flow Tracking: Proprietary OBV modifications that detect institutional accumulation/distribution
Volume Divergence Detection: Unique algorithm that identifies volume patterns not visible in standard indicators
Multi-Factor Confirmation: Combines 5 different confirmation methods to filter false signals
Why This Justifies Closed-Source Protection:
The core algorithms for cloud generation, signal strength calculation, and dynamic glow adaptation are proprietary mathematical models developed over 3 months of testing. These are not simple combinations of existing indicators but original mathematical approaches to market sentiment visualization.
Unique Value Proposition:
Real-time sentiment visualization through the breathing cloud system
Forward-looking signals that anticipate trend changes before price confirmation
Adaptive transparency that changes based on market conditions
Multi-timeframe VWAP integration with proprietary anchoring methodology
How to Use:
Cloud Analysis: Green cloud indicates bullish money flow, red indicates bearish pressure
Diamond Signals: Green diamonds below price for bullish reversals, red diamonds above for bearish
Signal Strength: Brighter diamonds represent higher probability setups
Trend Confirmation: 5-day confirmation system filters noise and false signals
Best Practices:
Works optimally on daily and 4-hour timeframes
Combine with price action analysis for maximum effectiveness
Monitor cloud color changes for early trend shift warnings
Use diamond signals for entry/exit timing
Author's Instructions:
To request access to this invite-only script, please contact me directly through TradingView messaging with your trading experience and intended use case. Access is granted on a case-by-case basis to ensure proper usage and support.

Frozen 4H VWAP – Precision AnchoredFrozen 4H VWAP – Precision Anchored Like Ice
The Frozen 4H VWAP – Precision Anchored delivers a clean, stable, and reliable view of the 4-hour Volume Weighted Average Price, designed for traders who want higher timeframe insights without intrabar noise or repainting.
🔹 Key Features:
Non-Repainting: VWAP value is “frozen” at the close of each 4H candle — no mid-bar updates or flickering.
4H Timeframe Anchoring: Seamlessly pulls 4-hour VWAP values into any timeframe you’re trading on.
Clear Trend Reference: Updates only when a new 4H candle begins, acting as a trustworthy anchor for support/resistance.
Custom Source Option: Choose from different price sources (default: HLC3) to fit your strategy.
Whether you're scalping, day trading, or swing trading, this indicator gives you a powerful edge by grounding your decisions in higher timeframe VWAP data — clear, calm, and frozen in time.

VWAP RIBBONVWAP Ribbon Indicator
The VWAP Ribbon Indicator is a comprehensive technical analysis tool designed for TradingView, utilizing multiple Volume-Weighted Average Price (VWAP) calculations across different timeframes (Daily, Weekly, Monthly, Yearly, and Custom) to identify potential trading opportunities. It generates buy/sell signals, detects institutional bias, compression zones, breakouts, false breakouts, and reversions, providing traders with a robust framework for decision-making. The indicator is highly customizable, allowing users to tailor its settings to their trading style and timeframe.
Features
Multi-Timeframe VWAPs: Plots VWAPs for Daily, Weekly, Monthly, Yearly, and a user-defined Custom timeframe, each with configurable deviation bands.
Buy/Sell Signals: Generates signals based on price interactions with VWAPs, rebounds, and crosses, with adjustable sensitivity and minimum conditions.
Institutional Bias: Identifies bullish or bearish institutional bias based on VWAP alignments and slopes.
Compression Zones: Detects areas where VWAPs converge, indicating potential accumulation or distribution phases.
Breakout and False Breakout Detection: Identifies confirmed breakouts and false breakouts after compression zones, with volume and price confirmation.
Reversion Signals: Detects reversions after price excesses beyond VWAP deviation bands, anchored to pivot points.
Custom VWAP: Allows users to define a custom VWAP timeframe (e.g., specific hours, days, weeks) for tailored analysis.
Tactical Panel: Displays real-time signal and market data in a customizable panel (compact or detailed).
Advanced Filters: Incorporates volume, RSI, EMA, and candlestick patterns to enhance signal accuracy.
How to Use
Adding the Indicator:
In TradingView, go to the Pine Editor, paste the provided code, and click "Add to Chart."
The indicator will overlay VWAP lines and deviation bands on your chart, with optional labels and a tactical panel.
Configuration: The indicator is divided into several input groups for easy customization:
⚙️ Activate VWAPs in Signals: Enable or disable Daily, Weekly, Monthly, Yearly, or Custom VWAPs for signal generation.
Visual VWAP Ribbon Settings: Toggle visibility and adjust colors for VWAP lines and deviation bands. Customize the Custom VWAP timeframe (e.g., 4 hours, 2 days).
Buy/Sell Signals: Enable labels for basic signals ("B" for Buy, "S" for Sell), set minimum conditions (1–10), and adjust signal sensitivity (0.1–1.0).
Institutional Bias Conditions: Enable background coloring for bias, set minimum VWAP spacing (%), and optionally require price alignment with VWAPs.
Statistical Signals: Enable reversion labels, adjust lookback periods, and set volume gates for reversions.
VWAP Compression: Enable detection of VWAP convergence zones and breakout/false breakout signals.
Custom Signals: Enable labels for Custom VWAP rebounds with configurable cooldowns.
Pro Filters: Apply advanced filters like minimum VWAP slope, relative price confirmation, volume thresholds, RSI, and EMA weights.
Signal Weight Configuration: Assign weights to various conditions (e.g., price crosses, rebounds) to fine-tune signal scoring.
Tactical Panel: Enable the panel, choose its position (e.g., top-right), and select compact or detailed mode.
Interpreting Signals:
Buy/Sell Signals: Appear as "B" (Buy) or "S" (Sell) labels with detailed tooltips listing triggered conditions (e.g., price crossing Daily VWAP, rebound from lower band). Signals require a minimum number of conditions (default: 3) and a normalized score above the sensitivity threshold (default: 0.5).
Institutional Bias: Background coloring (green for bullish, red for bearish) indicates VWAP alignment (e.g., Daily > Weekly > Monthly) and slope conditions. Neutral bias has no coloring.
Compression Zones: Gray background highlights areas where VWAPs are within a user-defined threshold (default: 0.5%), signaling potential accumulation/distribution.
Breakout Signals: Labeled as "BREAK ▲" or "BREAK ▼" after exiting a compression zone with strong candlestick confirmation and volume.
False Breakout Signals: Labeled as "FALSE ▲" or "FALSE ▼" when price crosses a Daily VWAP band but reverses back, indicating a failed breakout.
Reversion Signals: Labeled as "▲ R ▬ BUY" or "▼ R ▬ SELL" at pivot points after price excesses beyond VWAP bands, confirmed by volume (if enabled).
Custom VWAP Signals: Labeled as "C-BUY" or "C-SELL" for rebounds off the Custom VWAP’s deviation bands, with configurable volume and candlestick filters.
Tactical Panel: Displays the latest signal, price, date, bias, compression status, trend direction, VWAP distances, volume state, and technical summary (slopes, band distances).
Best Practices:
Timeframe Selection: The indicator auto-scales parameters for different timeframes (Daily+, Intraday ≥1h, Sub-hour). Adjust settings like lookbackBars or devThreshold for specific timeframes if autoScaleReversion is disabled.
Signal Sensitivity: Increase signalSensitivity (e.g., 0.7) for stricter signals or decrease (e.g., 0.3) for more frequent signals. Adjust minConditions to balance signal frequency and reliability.
Volume Filters: Enable useVolumeGate or useLiquidityFilter for high-liquidity assets to reduce false signals in low-volume conditions.
Compression and Breakouts: Use compression zones to anticipate breakouts. Enable showBreakoutLabels and showfalseBreakoutLabels to monitor confirmed and failed breakouts.
Custom VWAP: Set a specific timeframe (e.g., 4 hours) for intraday trading or longer periods (e.g., 2 weeks) for swing trading. Enable showCustomSignalLabels for tailored signals.
Reversion Trading: Use reversion signals for mean-reversion strategies, especially in range-bound markets. Adjust devThreshold and pivotLength for sensitivity.
Tactical Panel: Use the detailed panel for a quick overview of market conditions. Compact mode is ideal for minimal screen clutter.
Alerts:
Set up alerts for:
Institutional Bias (Buy/Sell)
VWAP Compression (Start/End)
Basic Buy/Sell Signals
Reversion Signals (Buy/Sell)
Breakout Signals (Bullish/Bearish)
False Breakout Signals (Bullish/Bearish)
Custom VWAP Rebound Signals (Buy/Sell)
Weekly/Monthly/Yearly VWAP Rebound Signals
In TradingView, go to the Alerts tab, select the indicator, and choose the desired condition. Customize alert messages as needed.
Notes
Performance: The indicator uses max_bars_back=5000 and max_labels_count=500 to ensure compatibility with most assets. For low-liquidity assets, consider enabling useLiquidityFilter to avoid noisy signals.
Customization: Experiment with weights in the "Signal Weight Configuration" group to prioritize specific conditions (e.g., increase wReboundD for Daily VWAP rebounds).
Limitations: Signals are based on historical data and VWAP interactions. Always combine with other analysis tools and risk management strategies.
License: This indicator is released under the Mozilla Public License 2.0.

The Scalper System XAUUnlock powerful breakout opportunities with this precision tool designed for professional traders.
This indicator combines breakout logic with a smart VWAP filter anchored to the New York session, ensuring only high-quality, directional trades are highlighted, I suggest to use only on GOLD timeframe 5 min.
📈 Features:
Breakout Signals: Detects price breakouts above/below key range levels based on a customizable lookback period.
Session-Aware VWAP Filter: Filters out low-probability trades by validating signal direction against the anchored VWAP starting from the New York open (9:30 AM EST).
Smart Signal Management: Prevents repeated signals in the same direction until a reversal is detected.
Visual Alerts: Clear BUY and SELL labels on the chart, no repainting, no ambiguity.
Multi-Timeframe Friendly: Optimized for scalping and intraday strategies (ideal on 3m or 5m timeframes).
🎯 Why use it?
This indicator is designed to keep you aligned with the institutional flow by using the VWAP as a dynamic support/resistance filter. It eliminates noise and focuses only on breakout setups that occur in the direction of session momentum, increasing your probability of success.
🛠 Settings:
Lookback Period: Define how many candles to scan for the range breakout.
VWAP Session Start: Fixed to New York session open to track real institutional volume-weighted average price.
💡 Ideal for:
Futures Traders (GC, NQ, ES)
Forex & Metals (XAUUSD)
Scalpers and Day Traders
Breakout and VWAP Strategy Followers
----------------------------------------------------------------------------
Sblocca opportunità di breakout ad alta precisione con questo strumento pensato per trader professionisti.
L’indicatore combina la logica di breakout con un intelligente filtro VWAP ancorato all’apertura della sessione di New York, mostrando solo segnali di trading di alta qualità e direzionali, il mio consiglio è di usarlo solo sul GOLD indicativamente sui 5 minuti.
📈 Caratteristiche principali:
Segnali di Breakout: Rileva rotture al rialzo/ribasso sopra o sotto i livelli chiave, calcolati su un periodo di analisi personalizzabile.
Filtro VWAP basato sulla sessione: Esclude i trade a bassa probabilità, validando i segnali solo se in linea con la direzione del VWAP della sessione di New York (apertura 15:30 ora italiana).
Gestione Intelligente dei Segnali: Evita segnali ripetuti nella stessa direzione finché non si verifica un’inversione.
Avvisi Visivi: Etichette chiare di BUY e SELL sul grafico, senza repaint, zero ambiguità.
Ottimizzato per Multi-Timeframe: Funziona perfettamente per scalping e intraday (ideale su timeframe 3m o 5m).
🎯 Perché usarlo?
Questo indicatore ti mantiene allineato con il flusso istituzionale utilizzando il VWAP come supporto/resistenza dinamico. Elimina il rumore di fondo e si concentra solo su configurazioni di breakout che avvengono nella direzione della forza della sessione, aumentando la probabilità di successo.
🛠 Impostazioni personalizzabili:
Periodo di analisi: Imposta il numero di candele da analizzare per calcolare i livelli di breakout.
Inizio sessione VWAP: Fissato all'apertura della sessione di New York per tracciare il vero prezzo medio ponderato per volume istituzionale.
💡 Ideale per:
Trader su Futures (GC, NQ, ES)
Forex & Metalli (es. XAUUSD)
Scalper e Day Trader
Strategie basate su Breakout e VWAP
ZenAlgo - LevelsThis script combines multiple anchored Volume-Weighted Average Price (VWAP) calculations into a single tool, providing a continuous record of past VWAP levels and highlighting when price has tested them. Typically, VWAP indicators show only the current VWAP for a single anchor period, requiring you to either keep re-anchoring manually or juggle multiple instances of different VWAP tools for each timeframe. By contrast, this script automatically tracks both the ongoing VWAP and previously completed VWAP values, along with real-time detection of “tests” (when price crosses a particular VWAP level). It’s especially valuable for traders who want to see how price has interacted with VWAP over several sessions, weeks, or months—without switching between separate indicators or manually setting anchors.
Below is a comprehensive explanation of each component, why multiple VWAP lines working together can be more informative than a single line, and how to adjust the script for various markets and trading styles:
Primary VWAP vs. Historical VWAP Lines - Standard VWAP indicators typically focus on the current line only. This script also calculates a primary VWAP, but it “locks in” each completed VWAP value when a new time anchor is detected (e.g., new weekly bar, new monthly bar, new session). As a result, you retain an ongoing history of VWAP lines for every completed anchored period. This is more powerful than manually setting up multiple VWAP tools—one for each desired timeframe—because everything is handled in a single script. You avoid chart clutter and the risk of forgetting to reset your manual VWAP at the correct bar.
Why Combine Multiple Anchored VWAP Lines in One Script? - Viewing several anchored VWAP lines together offers synergy . You see not only the current VWAP but also previous ones from different sessions or months, all within the same chart pane. This synergy becomes apparent if multiple historical VWAP lines cluster near the same price level, indicating a potentially significant zone of volume-based support or resistance. Handling this manually would involve repeatedly setting separate VWAP indicators, each reset at specific points, which is time-consuming and prone to error. In this script, the process is automated: as soon as the anchor changes, a completed VWAP line is stored so you can observe how price eventually reacts to it, repeatedly or not at all.
Automated “Test” Detection - Once a historical VWAP line is set, the script tracks when price crosses it in subsequent bars. If the high and low of a bar span that line, the script marks it in red (both the line and its label). It also keeps a counter of how many times each line has been tested. This method goes beyond a simple visual approach by quantifying the retests. Because all these lines are created and managed in one place, you don’t have to manually label the lines or check them one by one.
Advantages Over Manually Setting Multiple VWAPs
You save screen space: Instead of layering several VWAP indicators, each with unique settings, this single script plots them all on one overlay.
Automation: When a new anchor period begins, the script “closes out” the old VWAP and starts a new one. You never need to remember to reset it manually.
Retest Visualization: The script not only draws each line but also changes color and updates the label automatically if a line gets tested. Doing this by hand would be labor-intensive.
Unified Parameters: All settings (e.g., array size, max distance, test count limit) apply uniformly. You can manage them from one place, instead of configuring multiple separate tools.
Extended Insight with Multiple VWAP Lines
Since VWAP reflects the volume-weighted average price for each chosen period, historical lines can show zones where the market had a fair-value consensus in previous intervals. When the script preserves these lines, you see potential support/resistance areas more distinctly. If, for instance, price continually pivots around an old VWAP line, that may reveal a strong volume-based level. With several older VWAP lines on the chart, you gain an immediate sense of where these volume-derived averages have appeared and how price reacted over time. This wider perspective often proves more revealing than a single “current” VWAP line that does not reflect previous anchor sessions.
Handling of Illiquid Markets and Volume Limitations
VWAP is inherently tied to volume data, so its reliability decreases if volume reporting is missing or if the asset trades with very low liquidity. In such cases, a single large trade might momentarily skew the VWAP, resulting in “false” test signals when the high/low range intersects an abnormal price swing. If you suspect the data is incomplete or the market is unusually thin, it’s wise to confirm the validity of these VWAP lines before using them for any decision-making. Additionally, unusual market conditions—like after-hours trading or sudden high-volatility events—may cause VWAP to shift quickly, setting up multiple lines in a short time.
Key User-Configurable Settings
Hide VWAP on Day timeframe and above : Lets you disable the primary VWAP plot on daily or higher timeframes for a cleaner view.
Anchor Period : Select from Session, Week, Month, Quarter, Year, Decade or Century. Controls how frequently the script resets and preserves the VWAP line.
Offset : Moves the current VWAP line by a specified number of bars if you need a shifted perspective.
Max Array Size : Caps how many past VWAP lines the script will remember. Prevents clutter if you’re charting very long histories.
Max Distance : Defines how far back (in bar index units) a line is kept. If a line’s start bar is older than this threshold, it’s removed, keeping the chart uncluttered.
Max Red Labels : Limits the number of tested (red) VWAP lines that appear. If price tests a large number of old lines, only the newest red labels remain once you hit the set limit.
Workflow Overview
As soon as a new anchor period begins (e.g., a new weekly candle if “Week” is chosen), the script ends the current VWAP and stores that final value in its internal arrays.
It creates a dotted line and label representing the completed VWAP, and keeps track of whether it has been tested or not.
Subsequent bars may then cross that line. If a bar’s high/low includes the line’s value, it’s flagged as tested, labeled red, and a test counter increases.
As new anchored periods come, old lines remain visible—unless they fall outside your maxDistance or you exceed the maximum stored line count.
Real-World Benefits
Combining multiple VWAP lines—ranging, for example, from session-based lines for intraday perspectives to monthly or quarterly lines for broader context—provides a layered view of the volume-based fair price. This can help you quickly spot zones where price repeatedly intersects old VWAPs, potentially highlighting where bulls or bears took action historically. Because this script automates the management of all these lines and flags their retests, it removes a great deal of repetitive manual work that would typically accompany multiple, separate VWAP indicators set to different anchors.
Limitations & Practical Use
As with any volume-related tool, the script depends on reliable volume data. Assets trading on smaller venues or during illiquid periods may produce spurious signals. The script does not signal buy or sell decisions; rather, it helps visually map out where volume-weighted averages from previous periods might still be relevant to market behavior. Always combine the insight from these historical VWAP lines with your existing analytical approach or other technical and fundamental tools you use.
Conclusion
This script unifies past and present VWAP lines into one overlay, automatically detecting new anchor resets, storing the final VWAP values, and indicating whenever old lines are retested by price. It offers synergy through the simultaneous display of multiple historical VWAP lines, making it quicker and easier to detect potential support/resistance zones and better reflect changing market volumes over time. You no longer need to manually create, configure, or reset multiple VWAP indicators. Instead, the script handles all aspects of line creation, retest detection, and clutter management, giving you a robust framework to observe how historical VWAP data aligns with current price action.
By understanding the significance of multiple anchored VWAP lines, you can assess market structure from multiple angles in a single view. As always, ensure you confirm the reliability of the volume data for your particular asset and use these lines in conjunction with other analyses to form a well-rounded perspective on current market behavior.

VWAP Fibonacci Bands (Zeiierman)█ Overview
The VWAP Fibonacci Bands is a sophisticated yet user-friendly indicator designed to assist traders in visualizing market trends, volatility, and potential support/resistance levels. Developed by Zeiierman, this tool integrates the MIDAS (Market Interpretation Data Analysis System) methodology with Standard Deviation Bands and user-defined Fibonacci levels to provide a comprehensive market analysis framework.
This indicator is built for traders who want a dynamic and customizable approach to understanding market movements, offering features that adapt to varying market conditions. Whether you're a scalper, swing trader, or long-term investor.
█ How It Works
⚪ Anchor Point System
The indicator begins its calculations based on an anchor point, which can be set to:
A specific date for historical analysis or alignment with significant market events.
A timeframe-based reset, dynamically restarting calculations at the beginning of each selected period (e.g., daily, weekly, or monthly).
This dual-anchor method ensures flexibility, allowing the indicator to align with various trading strategies.
⚪ MIDAS Calculation
The MIDAS calculation is central to this indicator. It uses cumulative price and volume data to compute a volume-weighted average price (VWAP), offering a trendline that reflects the true value weighted by trading activity.
⚪ Standard Deviation Bands
The upper and lower bands are calculated using the standard deviation of price movements around the MIDAS line.
⚪ Fibonacci Levels
User-defined Fibonacci ratios are used to plot additional support and resistance levels between the bands. These levels provide visual cues for potential price reversals or trend continuations.
█ How to Use
⚪ Trend Identification
Uptrend: The price remains above the MIDAS line.
Downtrend: The price stays below the MIDAS line and aligns with the lower bands.
⚪ Support and Resistance
The upper and lower bands act as support and resistance levels.
Fibonacci levels provide intermediate zones for potential price reversals.
⚪ Volatility Analysis
Wider bands indicate periods of high volatility.
Narrower bands suggest low-volatility conditions, often preceding breakouts.
⚪ Overbought/Oversold Conditions
Look for the price beyond the upper or lower bands to identify extreme conditions.
█ Settings
Set Anchor Method
Anchor Method: Choose between Timeframe or Date to define the starting point of calculations.
Anchor Timeframe: For Timeframe mode, specify the interval (e.g., Daily, Weekly).
Anchor Date: For Date mode, set the exact starting date for historical alignment.
Set Std Dev Multiplier
Controls the width of the bands:
Higher values widen the bands, filtering out minor fluctuations.
Lower values tighten the bands for more responsive analysis.
Set Fibonacci Levels
Define custom Fibonacci ratios (e.g., 0.236, 0.382) to plot intermediate levels between the bands.
█ Tips for Fine-Tuning
⚪ For Trend Trading:
Use higher Std Dev Multipliers to focus on long-term trends and avoid noise. Adjust Anchor Timeframe to Weekly or Monthly for broader trend analysis.
⚪ For Reversal Trading:
Tighten the bands with a lower Std Dev Multiplier.
Use shorter anchor timeframes for intraday reversals (e.g., Hourly).
⚪ For Volatile Markets:
Increase the Std Dev Multiplier to accommodate wider price swings.
⚪ For Quiet Markets:
Decrease the Std Dev Multiplier to highlight smaller fluctuations.
-----------------
Disclaimer
The information contained in my Scripts/Indicators/Ideas/Algos/Systems does not constitute financial advice or a solicitation to buy or sell any securities of any type. I will not accept liability for any loss or damage, including without limitation any loss of profit, which may arise directly or indirectly from the use of or reliance on such information.
All investments involve risk, and the past performance of a security, industry, sector, market, financial product, trading strategy, backtest, or individual's trading does not guarantee future results or returns. Investors are fully responsible for any investment decisions they make. Such decisions should be based solely on an evaluation of their financial circumstances, investment objectives, risk tolerance, and liquidity needs.
My Scripts/Indicators/Ideas/Algos/Systems are only for educational purposes!

VWAP with Trend Alerts [CrossTrade]The VWAP with Trend Alerts indicator is designed to provide a comprehensive visual and analytical tool for traders using the Volume Weighted Average Price (VWAP) along with additional features like custom bar coloring and trend-based signal alerts.
Key Components and Functionalities:
1. VWAP Calculation: The core of this indicator is the VWAP, which represents the average price of an asset, weighted by volume. It's a popular tool among traders to identify the general direction and strength of a trend, and for assessing entry and exit points.
2. Standard Deviation Bands: Surrounding the VWAP are multiple bands calculated based on standard deviation values. These bands serve as dynamic support and resistance levels. The script allows up to three bands, each with customizable multipliers, giving insights into price volatility and potential breakout or reversal points.
3. Bar Coloring Options:
- Color All Bars: When enabled, all bars on the chart are colored based on whether they close above (green) or below (red) the VWAP.
- Trend Bars Only: This option, when selected, colors only the bars that close beyond the second standard deviation band. It helps in identifying stronger trends and significant market movements.
4. Buy and Sell Signal Conditions: The script includes conditions for buy and sell signals specifically tailored for trend bars. A buy signal is generated when a bar closes above both the VWAP and the upper second standard deviation band, indicating a potential strong uptrend. Conversely, a sell signal is triggered when a bar closes below both the VWAP and the lower second standard deviation band, suggesting a strong downtrend.
5. Alert Conditions: To aid in timely decision-making, the script features alert conditions corresponding to the buy and sell signals.
Usage and Application:
- For Trend Identification: The VWAP and its bands can help identify the prevailing market trend. Bars closing consistently above the VWAP suggest an uptrend, while those closing below indicate a downtrend.
- Volatility Assessment: The standard deviation bands provide a visual representation of market volatility. Narrower bands suggest low volatility, while wider bands indicate high volatility.
- Signal Alerts for Trading: The buy and sell signals, especially those filtered by the trend bars condition, can be valuable for traders looking for strong movement confirmations.
Flexibility and Customization:
This indicator is highly customizable and builds off of the core logic found in standard VWAP indicators. By allowing traders to adjust the standard deviation multipliers and choose their preferred bar coloring strategy. It caters to various trading styles, whether focusing on the broader market trend or pinpointing significant trend-based movements.
Session VWAPS [QuantVue]The Session VWAPS indicator is a designed for traders to enhance their trading analysis by incorporating Volume Weighted Average Price (VWAP) anchored to custom-defined trading sessions.
This indicator automatically plots VWAPs at three critical points of a user defined session:
🔹session start
🔹session high
🔹session low
Additionally, it provides the option to display the VWAPs from previous sessions, offering a look at potential areas of support and resistance.
Anchored VWAP, or Anchored Volume-Weighted Average Price, is a technical analysis tool used to determine the average price of a stock weighted by volume, starting from a specific point in time chosen by the analyst.
Unlike traditional VWAP, which starts at the beginning of the trading session, the anchored VWAP allows traders to select any point on the chart, such as a significant event, price low, high, or a breakout, to begin the calculation.
VWAP incorporates price and volume in a weighted average and can be used to identify areas of support and resistance on the chart.
Indicator Features:
Custom Session Definition:
Users can define their own trading sessions by specifying start and end times, allowing for tailored analysis according to individual trading strategies or market hours.
Anchored VWAP at Three Key Points:
🔹Session Start VWAP: This VWAP is anchored at the start of the defined session.
🔹Session High VWAP: Anchored at the highest price point within the session.
🔹Session Low VWAP: Anchored at the lowest price point within the session.
Previous Session VWAPs:
The indicator can display VWAPs from the previous session, allowing traders to spot potential areas of support and resistance.
Give this indicator a BOOST and COMMENT your thoughts below!
We hope you enjoy.
Cheers!

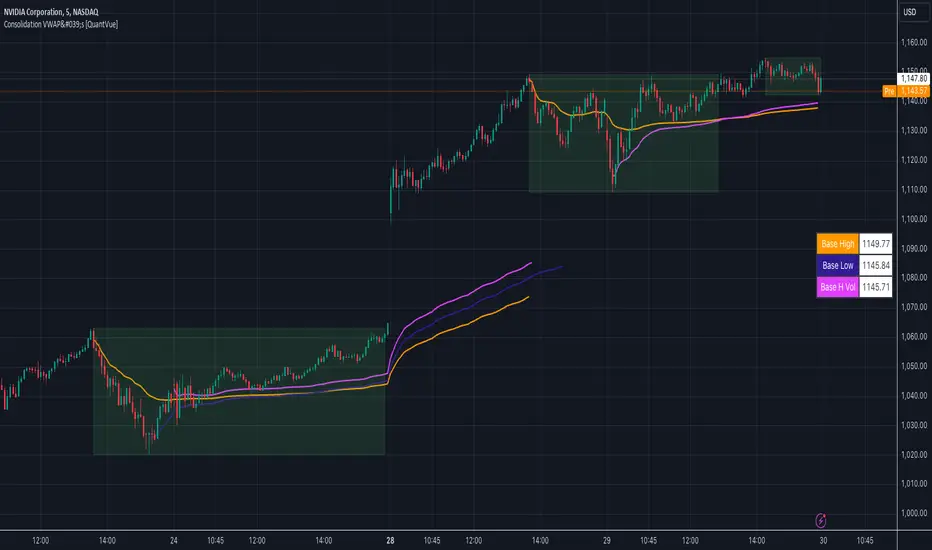
Consolidation VWAP's [QuantVue]Introducing the Consolidation VWAP's Indicator , a powerful tool designed to identify consolidation periods in stock advance and automatically anchor three distinct VWAPs to key points within the consolidation.
Consolidation Period Identification:
The indicator automatically detects periods of consolidation or areas on the chart where a stock's price moves sideways within a defined range. This period can be seen as the market taking a "breather" as it digests the previous gains. Consolidations are important because they often act as a base for the next move, either continuing the previous uptrend or reversing direction.
Consolidation requirements can be customized by the user to match your instrument and timeframe.
Maximum Consolidation Depth
Minimum Consolidation Length
Maximum Consolidation Length
Prior Uptrend Amount
Anchored VWAP, or Anchored Volume-Weighted Average Price, is a technical analysis tool used to determine the average price of a stock weighted by volume, starting from a specific point in time chosen by the analyst.
Unlike traditional VWAP, which starts at the beginning of the trading session, the anchored VWAP allows traders to select any point on the chart, such as a significant event, price low, high, or a breakout, to begin the calculation.
VWAP incorporates price and volume in a weighted average and can be used to identify areas of support and resistance on the chart.
VWAP Anchored to Consolidation High: This VWAP is anchored at the highest price point within the identified consolidation period. It helps traders understand the
average price paid by buyers who entered at the peak of the consolidation.
VWAP Anchored to Consolidation Low: This VWAP is anchored at the lowest price point within the consolidation. It provides insights into the average price paid by
buyers who entered at the lowest point of the consolidation.
VWAP Anchored to Highest Volume in the Consolidation: This VWAP is anchored at the price level with the highest trading volume during the consolidation. It reflects the average price at
which the most trading activity occurred, often indicating a key support or resistance level.
The indicator also allows the trader to see past consolidation areas and previous anchored VWAP's.
Give this indicator a BOOST and COMMENT your thoughts!
We hope you enjoy.
Cheers!
Crypto Spot/Futures Dominance Indicator with AlertsFutures/Spot Dominance Indicator:
Overview:
The futures/spot dominance indicator is a versatile tool used by traders and analysts to assess the relative strength or dominance of the futures market in relation to the spot (or cash) market for a specific asset. It offers insights into market sentiment, potential arbitrage opportunities, and risk management while incorporating the VWAP indicator for added context.
How It Works:
This indicator automatically detects and adapts to the futures symbol applied to the chart, simplifying the setup for traders. However, it still necessitates manual input of the corresponding spot pair to ensure accuracy.
Automatic Futures Symbol Detection: The indicator starts by automatically detecting the futures symbol on the trading chart, eliminating the need for manual configuration. This ensures that the indicator is applied to the correct futures contract.
Manual Spot Pair Entry: To provide a reliable reference point for the comparison, traders must manually input the corresponding spot symbol via the indicator's inputs. For instance, if the indicator detects the BTCUSDT.P futures symbol, traders would manually enter the BTCUSDT spot symbol.
Gathering Data: The indicator collects historical price data for both the detected futures contract and the manually specified spot symbol. This data includes open, high, low, and close prices, as well as trading volume.
VWAP Calculation: To gain a deeper understanding of price trends and market dynamics, the indicator calculates the VWAP (Volume Weighted Average Price) for both the futures and spot markets. The VWAP places more weight on prices with higher trading volume, offering a weighted average that reflects market consensus.
Premium/Discount Calculation: By subtracting the VWAP of the spot market from the VWAP of the futures market, the indicator quantifies the premium or discount of the futures price concerning the spot price. A positive value indicates a premium, while a negative value suggests a discount.
Plotting: The premium/discount value is displayed as a line on the chart, often alongside moving averages or other smoothing techniques for improved trend analysis.
Alerts: In addition to its analysis capabilities, this indicator now includes alerts to enhance your trading experience. It alerts you in the following scenarios:
Premium Above Average: Notifies you when the premium crosses above the average line.
Premium Below Average: Alerts you when the premium crosses below the average line.
Premium Above Zero: Provides an alert when the premium crosses above the zero line.
Premium Below Zero: Generates an alert when the premium crosses below the zero line.
Benefits of the Futures/Spot Dominance Indicator:
Sentiment Analysis: Traders use the indicator to assess market sentiment. A futures premium might signify bullish sentiment, while a discount could indicate bearish sentiment.
Arbitrage Opportunities: Identifying price discrepancies between futures and spot markets can help traders spot arbitrage opportunities, where they can profit from price differentials.
Risk Management: The indicator assists in evaluating risks associated with futures positions, helping traders manage their exposure effectively.
Trend Confirmation: When used in conjunction with other technical indicators, futures/spot dominance, along with VWAP, can provide additional confirmation of price trends.
Hedging: Investors and corporations use this tool to gauge the effectiveness of hedging strategies based on futures contracts.
Speculative Trading: Traders and investors use the indicator to inform speculative positions, aligning their trades with perceived market strength or weakness.
Insightful Analysis: Futures/spot dominance analysis, enriched by VWAP data, offers insights into market behavior during specific events or changes in economic conditions.
In summary, the futures/spot dominance indicator, with its integration of VWAP and automatic futures symbol detection, provides traders and investors with a comprehensive tool to assess market dynamics. It aids in sentiment analysis, risk management, and trend confirmation while offering potential arbitrage opportunities. The newly added alerts enhance the indicator's functionality, providing timely notifications of key market events. However, it relies on manual input of the corresponding spot pair to ensure precise comparisons between futures and spot markets. It should be used alongside other analysis techniques for a well-rounded view of the market.

Premium VWAP Trendfollow Strategy [wbburgin]This is a strongly-revised version of my VWAP Trendfollow Strategy, which follows a substantial reworking to address various structural inefficiencies with the script, such as the narrowing of the standard deviation band upon anchor reset. I will continue updating the original script with planned adjustments, this is a different proof-of-concept that builds off of the original script thesis with a different calculation method and execution.
This strategy is not built for any specific asset or timeframe, and has been backtested on crypto and equities from 1 min-1 day. The previous experimental strategy was heavily-correlated with the actual movement of the asset, which added unpalatable risk to the strategy and increased drawdown. This revised form has a more stable backtesting curve, but I want to heavily emphasize that I cannot guarantee that the strategy will be profitable for your circumstances. Backtesting only goes so far and every exchange has a different fee schedule, which can substantially eat into your profits. At the bottom I will explain the parameters behind the strategy results.
**********
The VWAP Trendfollow Strategy begins with a simple premise: to enter long when the price breaks above the upper standard deviation of a VWAP, and to close the position when the price breaks below the lower standard deviation of the VWAP. This is more effective than initiating the same strategy for a VWMA because the VWAP resets its anchor depending on your chosen anchor period, and the act of resetting its anchor also resets its standard deviation value. As a consequence, in sustained uptrends, the standard deviation is pulled upward to meet the price when the anchor resets, instead of requiring the price to fall all the way back down, as in the lower standard deviation band of the VWMA. This essentially acts as the VWAP itself raising the stop loss at each anchor period, which works well for the overall trend-following strategy.
However, this narrowing can still have consequences for a simple breakout strategy; as the price gradually oscillates towards above or below its standard deviation band, it may cross over the other and produce false signals. This oscillation is worrisome especially when fees are taken into account.
Thus, the premium VWAP Trendfollow strategy has a variable width which detects abnormal narrowing of the band, and adjusts it until it is reasonable to close the variability period. Additionally, a filter is added to the open/close signals to soften the frequency of signals without impacting performance significantly.
This script contains an ATR stop loss and an ATR take profit (which is also a difference between it and the original experimental script), with customizable inputs. The strategy results shown below are with initial capital of $1000, qty entry of 10%, and commissions of 0.06%. It works best on 24/7 instruments, like crypto, but I have found it also works with FAANG stocks or other high volatility / high volume assets. The issue with stocks, however, is that the price can jump/plummet because of abnormal events after-hours, which the strategy cannot pick up on until pre-trading begins the next morning. For that reason I suggest it be used on crypto and, because of its low % profitable (but high average winning trade in relation to its average losing trade), be used on an exchange that has minimal fees or volume-based discounts. In the unfortunate case that you cannot find a minimal fee or volume-discounted fee exchange (such as fellow Americans following the liquidity-retreat on Binance.US), I encourage you to test out the higher anchor periods for the higher timeframes, which will reduce the number of trades and increase the average % per trade.
Additionally, this is a long-term strategy used best for accumulation. It is currently long-only; that may change based off of user input.
**********
Disclaimer
Copyright by wbburgin.
The information contained in my Scripts/Indicators/Algorithms does not constitute financial advice or a solicitation to buy or sell any securities of any type. I will not accept liability for any loss or damage, including without limitation any loss of profit, which may arise directly or indirectly from the use of or reliance on such information.
All investments involve risk, and the past performance of a security, industry, sector, market, financial product, trading strategy, backtest, or individual's trading does not guarantee future results or returns. Investors are fully responsible for any investment decisions they make. Such decisions should be based solely on an evaluation of their financial circumstances, investment objectives, risk tolerance, and liquidity needs.

VWAP Breakout Strategy (Momentum, Vol, VWAP, RSI, TrSL)General Description and Unique Features of this Script
Introducing the VWAP Breakout Trading Algorithm for TradingView – the timeless strategy designed to identify the highest probability entries and trades for all financial securities and timeframes.
Unlike other strategies, the VWAP Breakout Strategy considers the buying/selling pressure in the market and supply/demand balance to generate real-time trading signals. The Relative Strength Index (RSI) is used as a technical measure to capture typical breakouts from consolidation periods and pullback entries.
With flexible backtesting options, traders can improve parameter settings depending on their time horizon and the type of financial securities being used. Plus, this pro-version of the VWAP Breakout Strategy offers stop-loss, take-profit, and trailing stop-loss exit strategies for better risk management.
The VWAP Breakout Strategy combines a number of technical indicators, the Moving Average (MA), the Volume Weighted Average Price (VWAP) and the RSI-qualifier to identify potential trend reversals and entry/exit points in the market. The VWAP Breakout Strategy can be used in conjunction with other technical indicators and fundamental analysis to make more informed trading decisions.
To further optimize trading results, this strategy generates trading signals based on real-time price action, rather than relying on the close / open of candles.
The VWAP Breakout Strategy
One important qualifier for generating buy signals is that the stock or other financial security is not in a short-term overbought status (for long-positions), or in a short-term oversold status (for short-positions), respectively.
Additionally, the stock or other financial security needs to go through a consolidation period before buy signals are being generated.
The RSI-indicator is being used as a technical measure in this strategy for that.
• Using moderate parameters for the RSI-qualifier (oversold-level 40 or higher, overbought level 60 or lower) will capture more typical breakouts from consolidation periods.
• Using more extreme parameters for the RSI-qualifier (oversold-level 35 or lower, overbought level 65 or higher) will capture the so-called pullback entries.
Long Entries
When the selling pressure is over and the continuation of the uptrend can be confirmed by the MA / VWAP crossover after reaching a price low, a buy signal is issued by this strategy.
Short Entries
When the byuing pressure is over and the continuation of the downtrend can be confirmed by the MA / VWAP crossover after reaching a price high, a sell signal is issued by this strategy.
Timeless Strategy
The underlying principles of this strategy are based on the buying- / selling pressure in the market as well as the supply and demand balance. The buying / selling volumes are being considered for the generation of trading signals. These sophisticated market principles make this strategy timeless which means it can be applied to 1min-charts, weekly charts as well as anything between those.
Generation of Trading Signals
Real-time process are considered for this pro-version of the VWAP Breakout Strategy. This is another benefit versus many other strategies which only consider the close or open of the canldes for trading signals:
Exit Strategies
This pro-version offers the following exit strategies:
• Stop-Loss
• Take-Profit
• Trailing Stop-Loss
The trailing SL functionality provides another benefit versus most other trading strategies resulting in significantly backtesting- and real-time trading results.
Trades will also be closed when an opposite trading signal is being generated (only applicable for combined long/short strategies).
Flexible Backtesting Option
The strategy offers fully flexible backtesting options to improve the parameter setting strategy, depending on time horizon and type of financial securities being used.
Relative Strength Index (RSI)
The Relative Strength Index (RSI) is a technical indicator developed by Welles Wilder in 1978. The RSI is used to perform a market value analysis and identify the strength of a trend as well as overbought and oversold conditions. The indicator is calculated on a scale from 0 to 100 and shows how much an asset has risen or fallen relative to its own price in recent periods.
The RSI is calculated as the ratio of average profits to average losses over a certain period of time. A high value of the RSI indicates an overbought situation, while a low value indicates an oversold situation. Typically, a value > 70 is considered an overbought threshold and a value < 30 is considered an oversold threshold. A value above 70 signals that a single value may be overvalued and a decrease in price is likely , while a value below 30 signals that a single value may be undervalued and an increase in price is likely.
For example, let's say you're watching a stock XYZ. After a prolonged falling movement, the RSI value of this stock has fallen to 26. This means that the stock is oversold and that it is time for a potential recovery. Therefore, a trader might decide to buy this stock in the hope that it will rise again soon.
The MA / VWAP Crossover Trading Strategy
This strategy combines two popular technical indicators: the Moving Average (MA) and the Volume Weighted Average Price (VWAP). The MA VWAP crossover strategy is used to identify potential trend reversals and entry/exit points in the market.
The VWAP is calculated by taking the average price of an asset for a given period, weighted by the volume traded at each price level. The MA, on the other hand, is calculated by taking the average price of an asset over a specified number of periods. When the MA crosses above the VWAP, it suggests that buying pressure is increasing, and it may be a good time to enter a long position. When the MA crosses below the VWAP, it suggests that selling pressure is increasing, and it may be a good time to exit a long position or enter a short position.
Traders typically use the MA VWAP crossover strategy in conjunction with other technical indicators and fundamental analysis to make more informed trading decisions. As with any trading strategy, it is important to carefully consider the risks and potential rewards before making any trades.
This strategy is applicable to all timeframes and the relevant parameters for the underlying indicators (RSI and MA/VWAP) can be adjusted and optimized as needed.
Backtesting Results
Backtesting gives outstanding results on all timeframes and drawdowns can be reduced to a minimum level. In this example, the hourly chart for MCFT has been used.
Settings for backtesting are:
- Period from April 2020 until April 2021 (1 yr)
- Starting capital 100k USD
- Position size = 25% of equity
- 0.01% commission = USD 2.50.- per Trade
- Slippage = 2 ticks
Other comments
• This strategy has been designed to identify the most promising, highest probability entries and trades for each stock or other financial security.
• The RSI qualifier is highly selective and filters out the most promising swing-trading entries. As a result, you will normally only find a low number of trades for each stock or other financial security per year in case you apply this strategy for the daily charts. Shorter timeframes will result in a higher number of trades / year.
• As a result, traders need to apply this strategy for a full watchlist rather than just one financial security.

Advanced VWAP_Pullback Strategy_Trend-Template QualifierGeneral Description and Unique Features of this Script
Introducing the Advanced VWAP Momentum-Pullback Strategy (long-only) that offers several unique features:
1. Our script/strategy utilizes Mark Minervini's Trend-Template as a qualifier for identifying stocks and other financial securities in confirmed uptrends. Mark Minervini, a 2x US Investment Champion, developed the Trend-Template, which covers eight different and independent characteristics that can be adjusted and optimized in this trend-following strategy to ensure the best results. The strategy will only trigger buy-signals in case the optimized qualifiers are being met.
2. Our strategy is based on the supply/demand balance in the market, making it timeless and effective across all timeframes. Whether you are day trading using 1- or 5-min charts or swing-trading using daily charts, this strategy can be applied and works very well.
3. We have also integrated technical indicators such as the RSI and the MA / VWAP crossover into this strategy to identify low-risk pullback entries in the context of confirmed uptrends. By doing so, the risk profile of this strategy and drawdowns are being reduced to an absolute minimum.
Minervini’s Trend-Template and the ‘Stage-Analysis’ of the Markets
This strategy is a so-called 'long-only' strategy. This means that we only take long positions, short positions are not considered.
The best market environment for such strategies are periods of stable upward trends in the so-called stage 2 - uptrend.
In stable upward trends, we increase our market exposure and risk.
In sideways markets and downward trends or bear markets, we reduce our exposure very quickly or go 100% to cash and wait for the markets to recover and improve. This allows us to avoid major losses and drawdowns.
This simple rule gives us a significant advantage over most undisciplined traders and amateurs!
'The Trend is your Friend'. This is a very old but true quote.
What's behind it???
• 98% of stocks made their biggest gains in a Phase 2 upward trend.
• If a stock is in a stable uptrend, this is evidence that larger institutions are buying the stock sustainably.
• By focusing on stocks that are in a stable uptrend, the chances of profit are significantly increased.
• In a stable uptrend, investors know exactly what to expect from further price developments. This makes it possible to locate low-risk entry points.
The goal is not to buy at the lowest price – the goal is to buy at the right price!
Each stock goes through the same maturity cycle – it starts at stage 1 and ends at stage 4
Stage 1 – Neglect Phase – Consolidation
Stage 2 – Progressive Phase – Accumulation
Stage 3 – Topping Phase – Distribution
Stage 4 – Downtrend – Capitulation
This strategy focuses on identifying stocks in confirmed stage 2 uptrends. This in itself gives us an advantage over long-term investors and less professional traders.
By focusing on stocks in a stage 2 uptrend, we avoid losses in downtrends (stage 4) or less profitable consolidation phases (stages 1 and 3). We are fully invested and put our money to work for us, and we are fully invested when stocks are in their stage 2 uptrends.
But how can we use technical chart analysis to find stocks that are in a stable stage 2 uptrend?
Mark Minervini has developed the so-called 'trend template' for this purpose. This is an essential part of our JS-TechTrading pullback strategy. For our watchlists, only those individual values that meet the tough requirements of Minervini's trend template are eligible.
The Trend Template
• 200d MA increasing over a period of at least 1 month, better 4-5 months or longer
• 150d MA above 200d MA
• 50d MA above 150d MA and 200d MA
• Course above 50d MA, 150d MA and 200d MA
• Ideally, the 50d MA is increasing over at least 1 month
• Price at least 25% above the 52w low
• Price within 25% of 52w high
• High relative strength according to IBD.
NOTE: In this basic version of the script, the Trend-Template has to be used as a separate indicator on TradingView (Public Trend-Template indicators are available in TradingView – community scripts). It is recommended to only execute buy signals in case the stock or financial security is in a stage 2 uptrend, which means that the criteria of the trend-template are fulfilled.
This strategy can be applied to all timeframes from 5 min to daily.
The VWAP Momentum-Pullback Strategy
For the JS-TechTrading VWAP Momentum-Pullback Strategy, only stocks and other financial instruments that meet the selected criteria of Mark Minervini's trend template are recommended for algorithmic trading with this startegy.
A further prerequisite for generating a buy signals is that the individual value is in a short-term oversold state (RSI).
When the selling pressure is over and the continuation of the uptrend can be confirmed by the MA / VWAP crossover after reaching a price low, a buy signal is issued by this strategy.
Stop-loss limits and profit targets can be set variably. You also have the option to make use of the trailing stop exit strategy.
Relative Strength Index (RSI)
The Relative Strength Index (RSI) is a technical indicator developed by Welles Wilder in 1978. The RSI is used to perform a market value analysis and identify the strength of a trend as well as overbought and oversold conditions. The indicator is calculated on a scale from 0 to 100 and shows how much an asset has risen or fallen relative to its own price in recent periods.
The RSI is calculated as the ratio of average profits to average losses over a certain period of time. A high value of the RSI indicates an overbought situation, while a low value indicates an oversold situation. Typically, a value > 70 is considered an overbought threshold and a value < 30 is considered an oversold threshold. A value above 70 signals that a single value may be overvalued and a decrease in price is likely , while a value below 30 signals that a single value may be undervalued and an increase in price is likely.
For example, let's say you're watching a stock XYZ. After a prolonged falling movement, the RSI value of this stock has fallen to 26. This means that the stock is oversold and that it is time for a potential recovery. Therefore, a trader might decide to buy this stock in the hope that it will rise again soon.
The MA / VWAP Crossover Trading Strategy
This strategy combines two popular technical indicators: the Moving Average (MA) and the Volume Weighted Average Price (VWAP). The MA VWAP crossover strategy is used to identify potential trend reversals and entry/exit points in the market.
The VWAP is calculated by taking the average price of an asset for a given period, weighted by the volume traded at each price level. The MA, on the other hand, is calculated by taking the average price of an asset over a specified number of periods. When the MA crosses above the VWAP, it suggests that buying pressure is increasing, and it may be a good time to enter a long position. When the MA crosses below the VWAP, it suggests that selling pressure is increasing, and it may be a good time to exit a long position or enter a short position.
Traders typically use the MA VWAP crossover strategy in conjunction with other technical indicators and fundamental analysis to make more informed trading decisions. As with any trading strategy, it is important to carefully consider the risks and potential rewards before making any trades.
This strategy is applicable to all timeframes and the relevant parameters for the underlying indicators (RSI and MA/VWAP) can be adjusted and optimized as needed.
Backtesting
Backtesting gives outstanding results on all timeframes and drawdowns can be reduced to a minimum level. In this example, the hourly chart for MCFT has been used.
Settings for backtesting are:
- Period from Jan 2020 until March 2023
- Starting capital 100k USD
- Position size = 25% of equity
- 0.01% commission = USD 2.50.- per Trade
- Slippage = 2 ticks
Other comments
- This strategy has been designed to identify the most promising, highest probability entries and trades for each stock or other financial security.
- The combination of the Trend-Template and the RSI qualifiers results in a highly selective strategy which only considers the most promising swing-trading entries. As a result, you will normally only find a low number of trades for each stock or other financial security per year in case you apply this strategy for the daily charts. Shorter timeframes will result in a higher number of trades / year.
- Consequently, traders need to apply this strategy for a full watchlist rather than just one financial security.

JS-TechTrading: VWAP Momentum_Pullback StrategyGeneral Description and Unique Features of this Script
Introducing the VWAP Momentum-Pullback Strategy (long-only) that offers several unique features:
1. Our script/strategy utilizes Mark Minervini's Trend-Template as a qualifier for identifying stocks and other financial securities in confirmed uptrends.
NOTE: In this basic version of the script, the Trend-Template has to be used as a separate indicator on TradingView (Public Trend-Template indicators are available on TradingView – community scripts). It is recommended to only execute buy signals in case the stock or financial security is in a stage 2 uptrend, which means that the criteria of the trend-template are fulfilled.
2. Our strategy is based on the supply/demand balance in the market, making it timeless and effective across all timeframes. Whether you are day trading using 1- or 5-min charts or swing-trading using daily charts, this strategy can be applied and works very well.
3. We have also integrated technical indicators such as the RSI and the MA / VWAP crossover into this strategy to identify low-risk pullback entries in the context of confirmed uptrends. By doing so, the risk profile of this strategy and drawdowns are being reduced to an absolute minimum.
Minervini’s Trend-Template and the ‘Stage-Analysis’ of the Markets
This strategy is a so-called 'long-only' strategy. This means that we only take long positions, short positions are not considered.
The best market environment for such strategies are periods of stable upward trends in the so-called stage 2 - uptrend.
In stable upward trends, we increase our market exposure and risk.
In sideways markets and downward trends or bear markets, we reduce our exposure very quickly or go 100% to cash and wait for the markets to recover and improve. This allows us to avoid major losses and drawdowns.
This simple rule gives us a significant advantage over most undisciplined traders and amateurs!
'The Trend is your Friend'. This is a very old but true quote.
What's behind it???
• 98% of stocks made their biggest gains in a Phase 2 upward trend.
• If a stock is in a stable uptrend, this is evidence that larger institutions are buying the stock sustainably.
• By focusing on stocks that are in a stable uptrend, the chances of profit are significantly increased.
• In a stable uptrend, investors know exactly what to expect from further price developments. This makes it possible to locate low-risk entry points.
The goal is not to buy at the lowest price – the goal is to buy at the right price!
Each stock goes through the same maturity cycle – it starts at stage 1 and ends at stage 4
Stage 1 – Neglect Phase – Consolidation
Stage 2 – Progressive Phase – Accumulation
Stage 3 – Topping Phase – Distribution
Stage 4 – Downtrend – Capitulation
This strategy focuses on identifying stocks in confirmed stage 2 uptrends. This in itself gives us an advantage over long-term investors and less professional traders.
By focusing on stocks in a stage 2 uptrend, we avoid losses in downtrends (stage 4) or less profitable consolidation phases (stages 1 and 3). We are fully invested and put our money to work for us, and we are fully invested when stocks are in their stage 2 uptrends.
But how can we use technical chart analysis to find stocks that are in a stable stage 2 uptrend?
Mark Minervini has developed the so-called 'trend template' for this purpose. This is an essential part of our JS-TechTrading pullback strategy. For our watchlists, only those individual values that meet the tough requirements of Minervini's trend template are eligible.
The Trend Template
• 200d MA increasing over a period of at least 1 month, better 4-5 months or longer
• 150d MA above 200d MA
• 50d MA above 150d MA and 200d MA
• Course above 50d MA, 150d MA and 200d MA
• Ideally, the 50d MA is increasing over at least 1 month
• Price at least 25% above the 52w low
• Price within 25% of 52w high
• High relative strength according to IBD.
NOTE: In this basic version of the script, the Trend-Template has to be used as a separate indicator on TradingView (Public Trend-Template indicators are available in TradingView – community scripts). It is recommended to only execute buy signals in case the stock or financial security is in a stage 2 uptrend, which means that the criteria of the trend-template are fulfilled.
This strategy can be applied to all timeframes from 5 min to daily.
The VWAP Momentum-Pullback Strateg y
For the JS-TechTrading VWAP Momentum-Pullback Strategy, only stocks and other financial instruments that meet the selected criteria of Mark Minervini's trend template are recommended for algorithmic trading with this startegy.
A further prerequisite for generating a buy signals is that the individual value is in a short-term oversold state (RSI).
When the selling pressure is over and the continuation of the uptrend can be confirmed by the MA / VWAP crossover after reaching a price low, a buy signal is issued by this strategy.
Stop-loss limits and profit targets can be set variably.
Relative Strength Index (RSI)
The Relative Strength Index (RSI) is a technical indicator developed by Welles Wilder in 1978. The RSI is used to perform a market value analysis and identify the strength of a trend as well as overbought and oversold conditions. The indicator is calculated on a scale from 0 to 100 and shows how much an asset has risen or fallen relative to its own price in recent periods.
The RSI is calculated as the ratio of average profits to average losses over a certain period of time. A high value of the RSI indicates an overbought situation, while a low value indicates an oversold situation. Typically, a value > 70 is considered an overbought threshold and a value < 30 is considered an oversold threshold. A value above 70 signals that a single value may be overvalued and a decrease in price is likely , while a value below 30 signals that a single value may be undervalued and an increase in price is likely.
For example, let's say you're watching a stock XYZ. After a prolonged falling movement, the RSI value of this stock has fallen to 26. This means that the stock is oversold and that it is time for a potential recovery. Therefore, a trader might decide to buy this stock in the hope that it will rise again soon.
The MA / VWAP Crossover Trading Strategy
This strategy combines two popular technical indicators: the Moving Average (MA) and the Volume Weighted Average Price (VWAP). The MA VWAP crossover strategy is used to identify potential trend reversals and entry/exit points in the market.
The VWAP is calculated by taking the average price of an asset for a given period, weighted by the volume traded at each price level. The MA, on the other hand, is calculated by taking the average price of an asset over a specified number of periods. When the MA crosses above the VWAP, it suggests that buying pressure is increasing, and it may be a good time to enter a long position. When the MA crosses below the VWAP, it suggests that selling pressure is increasing, and it may be a good time to exit a long position or enter a short position.
Traders typically use the MA VWAP crossover strategy in conjunction with other technical indicators and fundamental analysis to make more informed trading decisions. As with any trading strategy, it is important to carefully consider the risks and potential rewards before making any trades.
This strategy is applicable to all timeframes and the relevant parameters for the underlying indicators (RSI and MA/VWAP) can be adjusted and optimized as needed.
Backtesting
Backtesting gives outstanding results on all timeframes and drawdowns can be reduced to a minimum level. In this example, the hourly chart for MCFT has been used.
Settings for backtesting are:
- Period from April 2020 until April 2021 (1 yr)
- Starting capital 100k USD
- Position size = 25% of equity
- 0.01% commission = USD 2.50.- per Trade
- Slippage = 2 ticks
Other comments
• This strategy has been designed to identify the most promising, highest probability entries and trades for each stock or other financial security.
• The RSI qualifier is highly selective and filters out the most promising swing-trading entries. As a result, you will normally only find a low number of trades for each stock or other financial security per year in case you apply this strategy for the daily charts. Shorter timeframes will result in a higher number of trades / year.
• As a result, traders need to apply this strategy for a full watchlist rather than just one financial security.

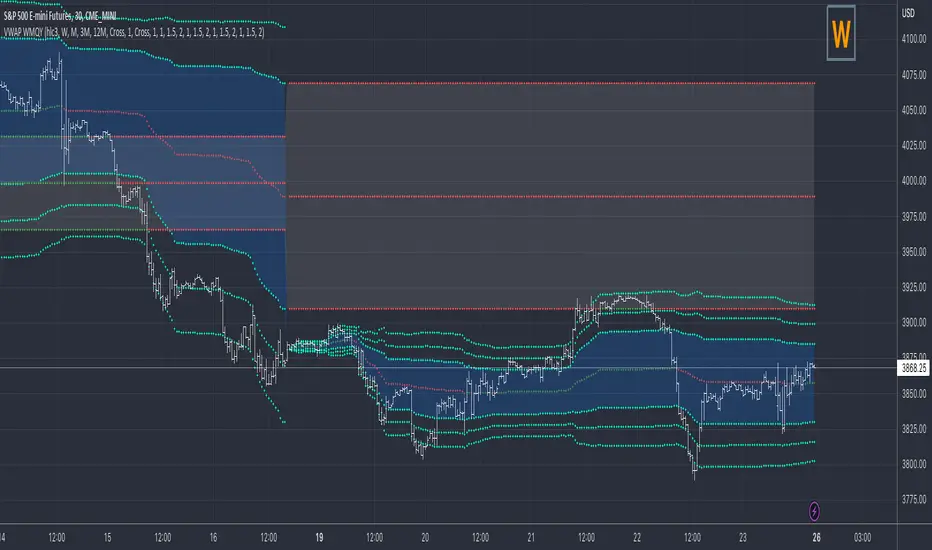
VWAP Previous VWAP WMQY StdDev Extensions Nadro StyleDisplays Multi-TF VWAP with Std Dev Bands.
Developing VWAP and Std Dev Bands
Previous VWAP and Std Dev Bands
Previous VWAP Extensions
Some Examples
VWAP PredatorUsing VWAP as a start point, the VWAP Predator uses proprietary Fibonacci bands to help determine signal criteria. Most traders use VWAP in a simple way to determine whether an instrument is in a bearish or bullish state, but that doesn't help choosing the correct time to go long or short.
The xBat VWAP Predator uses behavioural analysis with volume, price action with open and close proximities to the Fibonacci bands/zones (Fib Zones). The following describes how the xBrat VWAP Predator is different to any standard use of Volume Weighted Average Price and uses xBrat Proprietary Behavioural logic to determine high probability long and Short signals. All of this heavy lifting and logic is done behind the scenes, keeping traders charts clean.
Long Trading Signals - Candle Coloured in Blue - There are many states with the logic to produce these signals, which are briefly described below:
1. The only standard criteria here - The price action must be above the VWAP Line
2. The Price must open below the boundary of one Fib Zone and close into the next Fib Zone
3. That Same Candle has to be an Accumulation Candle (more volume than the preceding candle and More Buyers) - This is determined with our proprietary logic coding
4. The Same signal candle also has to be higher than average volume. Again, our proprietary xBrat Logic just doesn't look back over a set number of bars, it looks at times of day and day of week, plus more to determine a true valuation of higher, lower or equal to average volume.
5. Only when these states are met, plus two more ema proximity logic, Does the xBrat VWAP predator give a Long Signal.
6. Trade Management is either set targets or indeed a simple ema cross which we provide as a ribbon on the chart to help traders. These ema's are different to entry logic. When the Ribbon turns from green to red, the trader should consider exiting the trade
Short Trading Signals - Candle Coloured in Pink - There are many states with the logic to produce these signals, which are briefly described below:
1. The only standard criteria here - The price action must be below the VWAP Line
2. The Price must open above the boundary of one Fib Zone and close into the next Fib Zone
3. That Same Candle has to be a Distribution Candle (more volume than the preceding candle and More Sellers) - This is determined with our proprietary logic coding
4. The Same signal candle also has to be higher than average volume. Again, our proprietary xBrat Logic just doesn't look back over a set number of bars, it looks at times of day and day of week, plus more to determine a true valuation of higher, lower or equal to average volume.
5. Only when these states are met, plus two more ema proximity logic, Does the xBrat VWAP predator give a Short Signal.
6. Trade Management is either set targets or indeed a simple ema cross which we provide as a ribbon on the chart to help traders. These ema's are different to entry logic. When the Ribbon turns from red to green, the trader should consider exiting the trade.
VWAP Predator is a day trading and scalping signals trading indicator.
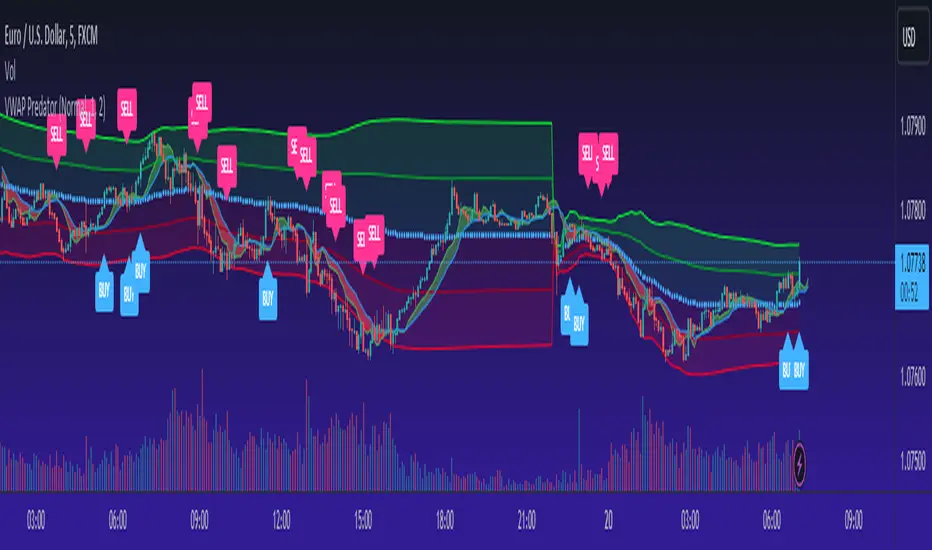
JMF MTF historical Vwap map and static levels. What is a vwap map?
This is a Multi time frame Historical vwap heatmap. The study plots lines and maps out historical vwap zones based on closing vwap value of the time frame selected and the time frames high range. Show casing high volume concentration areas and low volume area's from each time frame chosen on chart.
Static Vwap Lines can be turned off in settings, as well as the map, you can use each individually or paired together for a more complete overview of the levels. You can also refine the search by using the "Gap %" input. This will filter out and search for average price's that have gapped up or down "X" percent from the previous days average price. Leaving you with Static vwaps and map zones from the most important "Gap Day's". This helps clean up the over all visual, but be careful choosing a higher gap percentage, that you don't lose too much granularity the map offers.
What will a "Static vwap and Map look like"
The look will vary greatly depending on where the stock is in its historical range. If the name is in a consolidation range with a lot of recent average prices directly above and below, you will have a heavy, crowded, Darker/intense heat signature from the map, You will also see levels in map mode over lapping and lines bundled together. These high traffic area's can act as great support or resistance since they are showing a congregation of historical average prices where participants have previously interacted. On the contrary, if you see "open air" in the map, or large areas of blank chart where no heat signature is mapping, this is an area of LOW volume and average prices. Current price will or can move quickly through these areas IF price accepts inside the open air range. If price does NOT accept inside the open air range, Then the blank low volume zone can and will act as support or resistance given the situation.
Capture the gaps.
I look to capture these "Gaps" created by the map and static levels both long or short. I have noticed over time that the higher time frame maps zones are WELL respected intraday, Daily, Weekly, Monthly etc. I look for areas where we are clearing a high volume zone, we break above, hold and accept into open air, and start to move through the open air zones up or down.
I also use the more granular smaller levels as support and resistance intraday while in plays.
Time frames and settings .
User has 3 inputs for seperate time frames to show. You can show a combo of all 3 timeframes, or you can show only a single time frame of your choosing, or two. Mix and match with the string input time frames.
Acceptable inputs are - 5,10,15,30,60,90,240,D,W,M,2D,4W,3M and so on. Any combination of string input timeframe should work, that means numbers (5,10,15,etc) or letters (D,W,M,etc) or combination of the two.
Look and feel
Each time frame has its own color input, transparency input, line style input, and line weight input. User can customize any of the lines or maps to their liking with a wide variety of styles, widths, and colors.
Any or all of the time frames can be enabled or disabled as well, to make the map as busy, or as calm as you would like.
Enjoy !
In the end I encourage any who tries the Heatmap to really sit down and spend some time playing around with the settings in order to find out how they like the map set up. I usually run the default settings on a intraday 5min chart, and then another instance of the study on a 15min chart with W,M,3M. plotted. That way I can see granular intraday levels, and macro long term levels in the same view. See what fit's you the best, and how you like to trade. Most of all ENJOY!
Good luck -
JMF.
IMPORTANT INFO -
As always, the creator of this code is NOT a licensed investment advisor. No output of this tool is to be taken as investment advice or a recommendation to buy or sell any security.
Trading is risky, any one using this tool acknowledges they CAN LOSE some if not all of their initial investment even with this tool enabled.
User assumes ALL RESPONSIBILITY when using this tool in their technical analysis .
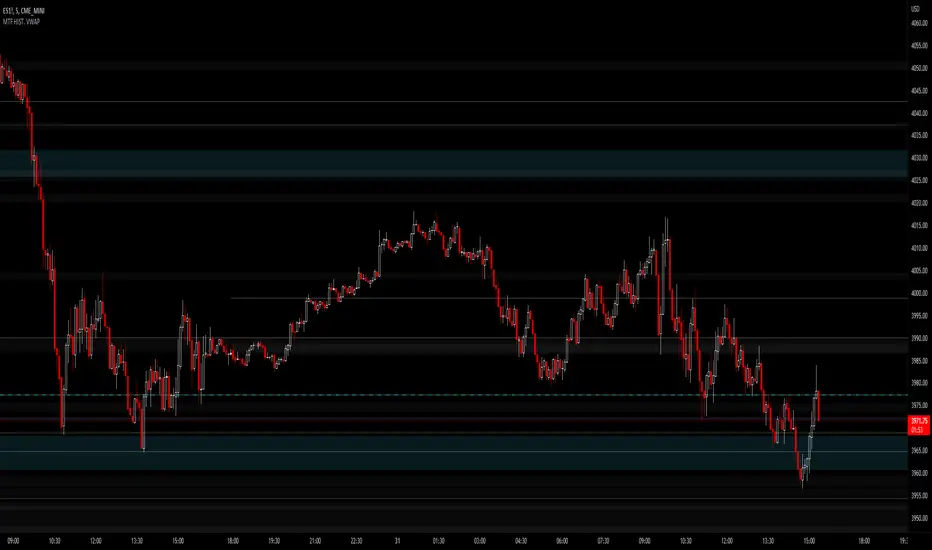
Candle Level of VWAP [By MUQWISHI]The " Price of Volume Weighted Average Price " (PVWAP) indicator calculates the VWAP standard deviation of bar price.
Features:
1. Ability to smooth the "Price of Volume Weighted Average Price" line.
2. Ability to choose the anchor period (timeframes).
Let me know if you have any questions.
Thanks.
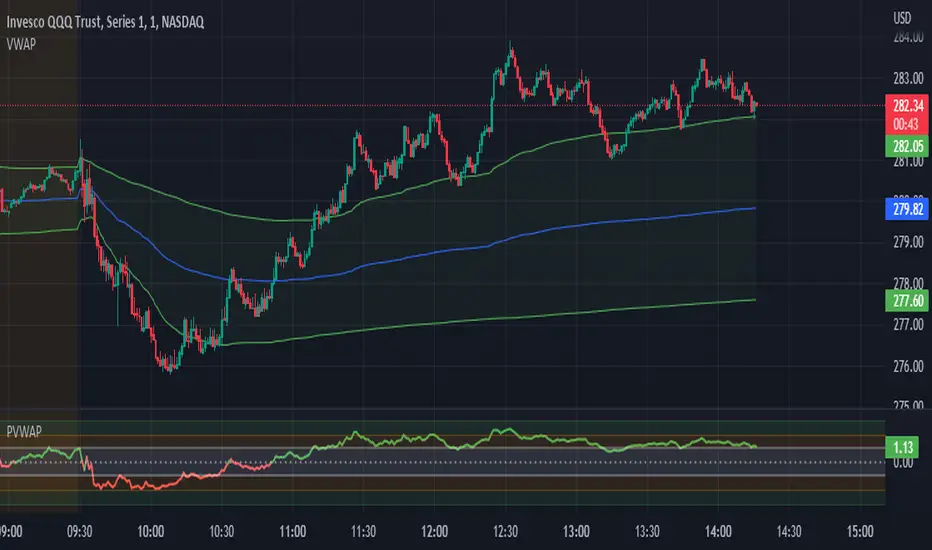
VXD SupercycleVXD is a brand new indicator and still developing. to minimize stop losses and overcome sideways market conditions, Higher Timeframe are recommended
Trend lines
-using Rolling VWAP as trend line to determined if Volume related to a certain price.
-you can switch RVWAP to EMA in the setting
ATR
-trailing 12*ATR and 2.4 Mutiplier
Pivot point and Rejected Block
Pivot show last High and low of a price in past bars
Rejected Block show when that High or Low price are important level to determined if it's Hidden Divergence or Divergence
Symbols on chart show Premium and Discount Prices
X-Cross - show potential reversal trend with weak volume .
O-circle - show potential reversal trend with strong volume .
Setting
Momentum: RSI = 25 , RSI MA = 14
Trend: Rolling VWAP and ATR and Subhag
Trailing STOP: ATR 12 x 2.4
Highlight Bars color when volume is above SMA 6
SMA200 act as TP Line
Risk:Reward Calculation
if Buy your Stoploss will be previous Pivot low
if Sell your Stoploss will be previous Pivot high and will be calculated form there, then show TP in Orange color line
VXD เป็นระบบเทรดที่ผมทดลองเอาหลาย ๆ ไอเดีย ทั้งจาก Youtube facebook และกลุ่มคนต่าง ๆ มารวบรวมไว้ แล้วตกผลึกขึ้นมาเป็นระบบนี้ ใน Timeframe ใหญ่ ๆ สามารถลากได้ทั้ง Cycle กันเลย
Trend lines
-ใช้ Rolling VWAP ของแอพ Tradingview (สามารถตั้งแค่าเป็น EMA ได้)
ATR
-ใช้ค่า ATR 12 Mutiplier 2.4
Pivot point and Rejected Block
Pivot โชว์เส้น High low และมีผลกับออเดอร์ หากแท่งเทียนปิดทะลุเส้นนี้
Rejected Block วาดแนวรับ-ต้าน อัตโนมัติ ใช้ประกอบ RSI ว่ามี Divergence หรือไม่
สัญลักษณ์ต่าง ๆ
X-Cross - แท่งกลืนกิน วอลุ่มน้อย
O-circle - แท่งกลืนกิน มีวอลุ่ม
Setting
Momentum: RSI = 25 , RSI MA = 14
Trend: Rolling VWAP and ATR and Subhag
Trailing STOP: ATR 12 x 2.4
Highlight Bars color when volume is above SMA 6
SMA200 act as TP Line
Risk:Reward Calculation
หาก Buy จุด SL จะอยู่ที่ Pivot low
หาก Sell จุด SL จะอยู่ที่ Pivot high และระบบจะคำนวณจากตรงนั้น จากนั้นแสดงเป็นเส้น TP สีส้ม
This Strategy Combined the following indicators and conditioning by me
ATR , RSI , EMA , SMA
Rolling VWAP - /script/ZU2UUu9T-Rolling-VWAP/
Regression Lines - Subhag form Subhag Ghosh /script/LHHBVpQu-Subhag-Ghosh-Algo-Version-for-banknifty/
Rejection Block , Pivots , High Volume Bars and PPDD form Super OrderBlock / FVG / BoS Tools by makuchaku & eFe /script/aZACDmTC-Super-OrderBlock-FVG-BoS-Tools-by-makuchaku-eFe/
ขอให้รวยครับ.


VWAP From Multiple Sources With Cloud & Percentage GapVWAP CLOUD FROM CLOSE, OPEN, HIGH & LOW SOURCES WITH CLOUD & PERCENTAGE GAP
VWAP stands for volume weighted average price and shows the average price of buys/sells based on volume traded across the current session. This VWAP is based off of the Daily session.
***HOW TO USE***
Use the purple cloud between the VWAPs as your entry points as price will typically bounce from that cloud area.
The Yellow Line is the VWAP using the close price as a source.
The Green Line is the VWAP using the open price as a source.
The Blue Line is the VWAP using the high price as a source.
The Purple Line is the VWAP using the low price as a source.
When price is above the VWAP cloud, the background will paint green because the trend is bullish.
When price is below the VWAP cloud, the background will paint red because the trend is bearish.
In the bottom right hand corner, three is a table that will show you the current percentage gap between current price and the VWAP using close as the source.
All sources and colors can be easily switched in the settings menu.
***MARKETS***
This indicator can be used as a signal on all markets, including stocks, crypto, futures and forex.
***TIMEFRAMES***
This vwap indicator can be used on all timeframes but is calculated using the daily session.
***TIPS***
Try using numerous indicators of ours on your chart so you can instantly see the bullish or bearish trend of multiple indicators in real time without having to analyze the data. Some of our favorites are our Auto Fibonacci, Volume Profile, Directional Movement Index, Momentum, Auto Support And Resistance and Money Flow Index in combination with this VWAP Cloud. The other indicators all have real time Bullish and Bearish labels as well so you can immediately understand each indicator's trend.
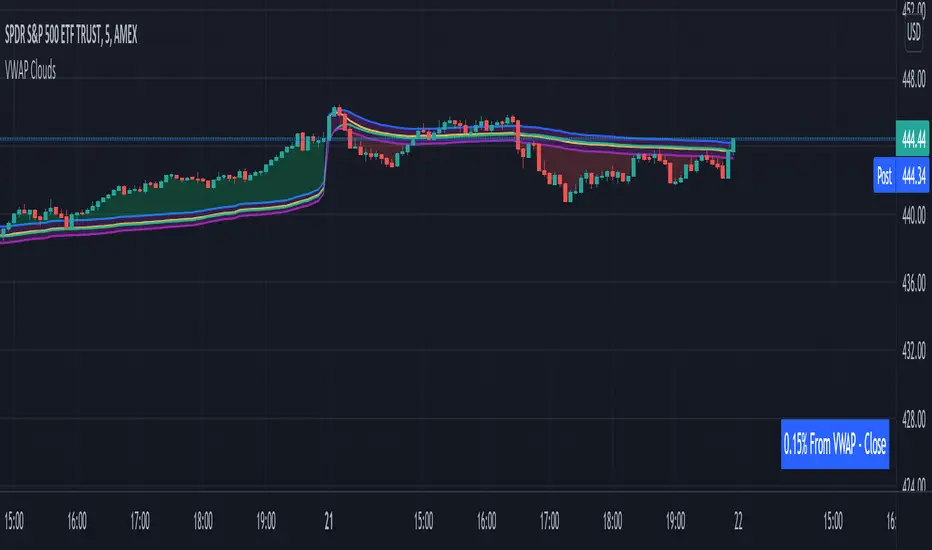
Fishing The Trend - Setup Classic v7.5.5FTT Classic v7.5.5
HOW Does it work ?
It is the classic version of Fishing The Trend-Setup for ease of trading & for getting the most from the market.
i.e. Combining the most useful indicators and making a whole setup under one roof...
FTT Classic comprises of following --
* IntraDay Range.
* Fishing The Trend.
* Custom VWAP.
* Baseband for Trend.
* Trendlines.
* Support & Resistance Lines.
* BreakOut Area.
* Technical Analysis table.
* Custom alerts.
1) HOW Does Intraday Range work ?
# For calculating the average most probable range for any symbol, it plots two areas - higher range and a lower range.
# This indicator is on - as default.
# Upper and Lower areas act as support and resistance, user may see a reversal in trend from these areas.
# If the price breaks these bands, breakout be considered.
# These bands are calculated by averaging the previous x number of days' high and low of the security.
3) HOW Does Fishing The Trend work ?
# When the market trend may try to reverse, the first signal/label will come showing Stop loss figure, and then if the trend reversal is confirmed, the supporting triangle in the next opening price will be placed at upper or lower side. along with these
there is a trailing stop-loss line, which will help user to trail their profits in-live.
# The CE-PE can be seen through the table with date and time.
# 2nd table also can be placed below the first one, showing the CE-PE Values for different symbol.
# Signals can be controlled by more or less as optioned in the settings.
# CE-PE strike price can be selected from ATM - ITM - OTM.
4) HOW Does Custom VWAP work ?
# VWAP will be placed having a line and current price of VWAP.
# One can have vwap in index chart also, the colour changes as the market goes above or below vwap or at vwap.
5) HOW Does Baseband for Trend work ?
# Baseband will be plotted for least 2 days on 3 min and gradually increases on increase of timeframe.
# If the market is above band, we may consider it a positive side and if market is below it, we may consider a negative side.
# Type 1 band is for trending market and type 2 is for rangebound market.
# Colour intensity also changes as market picks-up momentum or leaves momentum.
6) HOW Does Trendlines work ?
# Most nearest to most touching trendlines are placed for better understanding the trend.
# Easy to understand with the help of colour combinations.
7) HOW Does Support & Resistance Lines work ?
# The support & resistance lines will be drawn when market movement slows down or momentum decrease.
# The Support lines becomes resistance when market falls below it, and vice-versa for other conditions.
# Range development can be easily detected and can be used as range breakout for better understanding the market.
8) HOW Does BreakOut Area work ?
# Market Consolidates at most of the time, where the bulls and bears fight becomes more aggressive, at this point
of time the area will be formed or area will be formed when market trend reverses suddenly, leaving behind the previous
breakout area.
# Ease of trend reversal, previous supports / resistances can be seen easily.
9) HOW Does Technical Analysis table work ?
# There will be RSI displayed and for the better range detection, range area with price can be seen.
# The GAP of the opening market is seen with gap points (Down or Up)
10) HOW Does Custom alerts work ?
# Alerts can enabled for the CE-PE Strike Price through alerts management from Tradingview.
# Alerts can also be set when the Traffic Signal Comes.
Where to use?
# If the chart is of Index or equity, extended trading hours to be selected, time shall be exchange.
# Indicator wont work on timeframes lower than minutes or higher than or equal to day.
# can be used in every type of market.
# Extended to be selected for Index or Equities/Stocks, Regular be selected for futures, etc.
# At every part / portion the tooltip is placed showing the quick reference for that option.
# The main use of this indicator is quick scalping and Intra-day trading.
# Colour Theme can be selected if the chart theme is dark or light.
# The indicator shows a very useful option for early detection of the ongoing trend whether there will be reversal of trend or not ? Stop Loss - That should be done by following ones risk appetite, Ideally the High of the Previous Candle should be the stop loss for the Long / Short but everyone has their own Risk Management Strategies based on the capital deployed.
How to Take entry ?
# Time Frame shall be more than 2 min and less than day for better outcome.
# If buy signal comes and the market is below the baseband then wait for the market to cross and close above the baseband, also look for the immediate support or resistances which are seen in chart and those nearby the current signal.
# The data for the indicator will be very restricted, most of the parts in indicator wont work when the market closes.
# Pre-Opening or Post -Market data is tried to be ignored.
# Utmost Care is taken to implement the suggestions of users and also tried to keep the chart neat and clean.
** N.B.:- There may be cases where warning may come during setting the alert, this because
of alert conditions are taken ONLY when the current candle is CLOSED, real-time alerts are
considered as not feasible to get it.
Disclaimer
# The indicator to be used for understanding / learning the markets.
# User is responsible for his / her profits/losses, that may occur during the markets.
