Ultimate Institutional Order Flow Pro [Pointalgo]Ultimate Institutional Order Flow (UIOF Pro)
Ultimate Institutional Order Flow (UIOF Pro) is a multi-component market analysis indicator designed to study order flow behavior, liquidity interaction, volatility structure, and session-based participation.
It integrates several commonly used market structure and order-flow concepts into a single visual framework.
This script focuses on context and alignment, not on isolated signals.
Core Objective
The indicator aims to identify areas where price, volume, liquidity, and structure appear aligned in the same direction.
It does this by combining:
VWAP behavior
Volume participation
Cumulative delta analysis
Liquidity pool interaction
Order blocks and fair value gaps
Market structure shifts
Session and higher-timeframe confirmation
VWAP & Volatility Framework
Calculates VWAP using session, weekly, or monthly anchors.
Optional VWAP standard-deviation bands visualize price dispersion.
VWAP slope and price position are used to classify directional bias.
VWAP is treated as a dynamic equilibrium reference rather than a signal.
Cumulative Volume Delta (CVD)
Estimates buy and sell pressure based on intrabar price movement.
Tracks cumulative delta and a smoothed delta average.
Uses delta change normalization to highlight abnormal activity.
Detects potential delta divergences when price and participation differ.
CVD is used to assess whether participation supports or contradicts price movement.
Liquidity Zones & Sweeps
Identifies recent swing highs and lows as potential liquidity pools.
Tracks buy-side and sell-side liquidity areas.
Flags conditions where price sweeps liquidity beyond recent extremes.
Liquidity interaction is treated as context, not prediction.
Order Blocks
1. Detects potential bullish and bearish order blocks using:
Candle structure
Volatility thresholds
Volume confirmation
2.Highlights areas where strong participation followed opposing price movement.
Order blocks are visual reference zones and do not imply guaranteed reactions.
Fair Value Gaps (FVG)
Identifies imbalance zones where price moves without overlapping structure.
Filters gaps using ATR-based size conditions.
Visual shading is used to highlight imbalance areas.
These zones may represent inefficient price movement requiring further interaction.
Volume Profile & Point of Control (POC)
Builds a simplified volume profile over a configurable lookback window.
Determines the price level with the highest traded volume (POC).
POC is used as a reference for acceptance or rejection behavior.
Market Structure
Evaluates recent highs and lows to identify structure breaks.
Classifies directional structure as bullish, bearish, or neutral.
Structure is used as a directional filter rather than a trigger.
Multi-Timeframe Confirmation
Optional higher-timeframe confirmation aligns lower-timeframe behavior with broader context.
Prevents analysis from relying on isolated timeframe conditions.
Session Filtering
1. Allows analysis to be limited to specific trading sessions.
2. Helps reduce signals during low-participation periods.
3. Session logic affects signal eligibility, not calculations.
Signal Logic
Signals are generated only when multiple independent conditions align, including:
Liquidity interaction
Order block presence
VWAP bias
Delta confirmation
Structure alignment
Volume participation
Optional higher-timeframe confirmation
Active trading session
Strong continuation conditions are also highlighted when price, volume, and participation remain aligned.
Signals represent confluence states, not trade instructions.
Dashboard Summary
A real-time dashboard summarizes:
VWAP bias and slope
CVD strength and direction
Delta behavior
Market structure state
Higher-timeframe context
Volume conditions
Liquidity pool counts
Session activity
This provides a high-level snapshot of market conditions without manual calculation.
Alerts are available for:
Institutional alignment conditions
Strong continuation pressure
Liquidity sweeps
Delta divergences
Alerts are informational and reflect internal indicator states only.
Usage Notes
Designed for analytical interpretation and market study.
Best used alongside price action and risk management methods.
Performance depends on instrument liquidity and volume quality.
All visual elements can be individually enabled or disabled.
Disclaimer
This script is provided for educational and analytical purposes only.
It does not provide financial, investment, or trading advice.
All outputs should be independently verified before making trading decisions.
Volume Weighted Average Price (VWAP)

QUANT TRADING ENGINE [PointAlgo]Quant Trading Engine is a quantitative market-analysis indicator that combines multiple statistical factors to study trend behavior, mean reversion, volatility, execution efficiency, and market stability.
The indicator converts raw price behavior into standardized signals to help evaluate directional bias and risk conditions in a systematic way.
This script focuses on factor alignment and regime awareness, not prediction certainty.
Design Philosophy
Markets move through different regimes such as trending, ranging, volatile expansion, and instability.
This indicator attempts to model these regimes by blending:
Momentum strength
Mean-reversion pressure
Volatility risk
Trend filtering
Execution context (VWAP)
Correlation structure
Each component is normalized and combined into a single Quant Alpha framework.
Factor Construction
1. Momentum Factor
Measures directional strength using percentage price change over a rolling window.
Standardized using mean and standard deviation.
Represents trend continuation pressure.
2. Mean Reversion Factor
Measures deviation from a longer moving average.
Standardized to identify stretched conditions.
Designed to capture counter-trend behavior.
Directional Clamping
Mean-reversion signals are dynamically restricted:
No counter-trend buying during downtrends.
No counter-trend selling during uptrends.
Allows both sides only in neutral regimes.
This prevents conflicting signals in strong trends.
3. Volatility Factor
Uses realized volatility derived from price changes.
Penalizes environments where volatility deviates significantly from its norm.
Acts as a risk adjustment rather than a directional driver.
4. Composite Quant Alpha
The final Quant Alpha is a weighted blend of:
Momentum
Mean reversion (trend-clamped)
Volatility risk
The composite is standardized into a Z-score, allowing consistent interpretation across instruments and timeframes.
Signal Logic
Buy signal occurs when Quant Alpha crosses above zero.
Sell signal occurs when Quant Alpha crosses below zero.
Zero-cross logic is used to represent shifts from negative to positive statistical bias and vice versa.
Signals reflect statistical regime change, not trade instructions.
Volatility Smile Context
Measures price deviation from its statistical distribution.
Identifies skewed conditions where upside or downside volatility becomes dominant.
Highlights extreme deviations that may imply elevated derivative risk.
Exotic Risk Conditions
Detects sudden price expansion combined with volatility spikes.
Highlights environments where execution and risk become unstable.
Visual background cues are used for awareness only.
Execution Context (VWAP)
Measures price distance from VWAP.
Used to assess execution efficiency rather than direction.
Helps identify stretched conditions relative to average traded price.
Correlation Structure
Evaluates short-term return correlations.
Detects when price behavior becomes less predictable.
Flags structural instability rather than trend direction.
Visualization
The indicator plots:
Quant Alpha (scaled) with directional coloring
Volatility smile deviation
Price vs VWAP distance
Correlation structure
Signal markers indicate Quant Alpha zero-cross events and risk conditions.
Dashboard
A compact dashboard summarizes:
Trend filter state
Quant Alpha polarity and value
Individual factor readings
Current action state (Buy / Sell / Wait / Risk)
The dashboard provides a real-time snapshot of internal model conditions.
Usage Notes
Designed for analytical interpretation and research.
Best used alongside price action and risk management tools.
Factor behavior depends on instrument liquidity and volatility.
Not optimized for illiquid or irregular markets.
Disclaimer
This script is provided for educational and analytical purposes only.
It does not provide financial, investment, or trading advice.
All outputs should be independently validated before making any trading decisions.

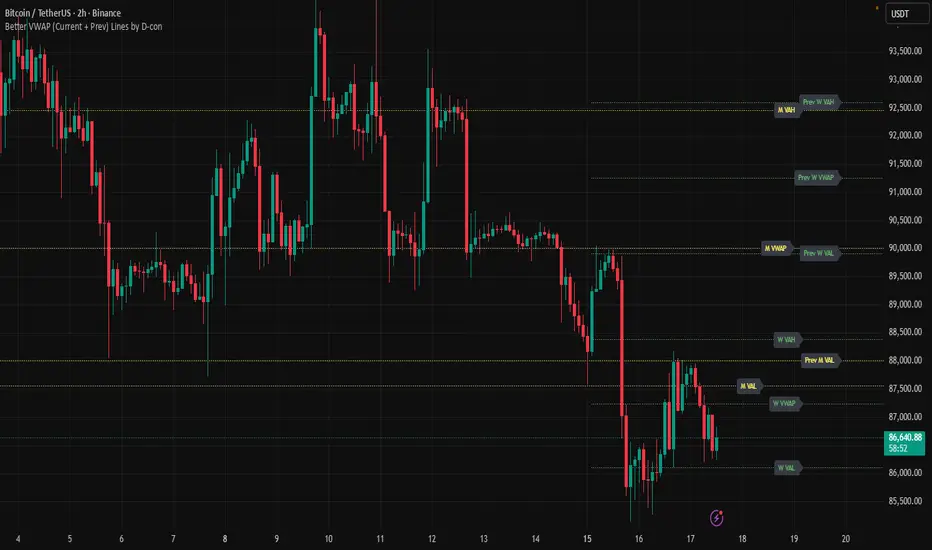
Better VWAP (Current + Prev) Lines by D-conTired of the basic single VWAP? This indicator gives you multi-timeframe VWAPs (Yearly, Quarterly, Monthly, Weekly) with VAH/VAL bands for both current AND previous periods - all fully customizable with individual colors, styles, and label positioning.
Perfect for traders who need reference levels across different timeframes without cluttering their chart, with smart label management and historical data warnings.
Liquidity Levels Pro Tool - thewallranka
Liquidity Levels Pro Tool is a market-structure and liquidity-mapping indicator designed to help discretionary futures and index traders identify statistically relevant price levels where reactions, continuations, or liquidity sweeps are more likely to occur.
This script is a decision-support tool, not a signal generator. It does not issue buy/sell alerts or predict future price movement. Instead, it organizes and scores liquidity information so traders can make their own contextual decisions.
What this indicator does
The script continuously detects and maintains liquidity zones derived from price pivots, then evaluates those zones using multiple structural and contextual factors:
Repeated price interaction (touches)
Freshness (time since last interaction)
Confluence with key reference levels
Reaction behavior after contact
Session relevance (RTH vs overnight)
Market regime (trend vs mean reversion)
Time-of-day effects (open, midday, power hour)
Only the most relevant zones—based on a dynamic scoring system—are displayed to reduce chart clutter and focus attention on levels that have historically mattered.
Core components
1. Liquidity Zones
Zones are built from pivot highs and lows and expanded into areas using a configurable tick-based padding. Nearby zones are merged to avoid redundancy.
Each zone is continuously evaluated and assigned a score (0–100) reflecting its relative importance.
2. Zone Scoring (No Lookahead)
Zone scores are based on:
Number of confirmed interactions
Recency of the last touch
Confluence with prior day/week levels, VWAP, and Opening Range
Reaction quality after touches (speed and follow-through)
Session alignment (zones that “work” in the current session are favored)
Penalties after liquidity sweeps
Zones are not forward-looking and do not rely on future data.
3. Context Engine
The script classifies the current environment using VWAP slope and distance:
Trend (up or down)
Mean reversion
Mixed/transition
Time-of-day context (Open, Midday, Power Hour) is also tracked internally and influences zone scoring.
This context is displayed in the HUD to support situational awareness, not automated decisions.
4. Liquidity Sweeps
Optional sweep detection highlights situations where price trades beyond a zone and closes back inside, indicating potential stop runs or failed breakouts.
Sweeps are rate-limited and applied conservatively to avoid visual noise.
5. Trade Planning Levels (Optional)
When enabled, the script highlights the nearest high-quality liquidity level above and below price based on score thresholds.
These are intended as reference targets, not trade entries or exits.
HUD (Heads-Up Display)
The on-chart HUD summarizes:
Key reference levels (prior day/week, Opening Range)
Nearest strong liquidity above/below price
Market regime and time-of-day context
Distance to levels (ticks or points)
The HUD is fully optional, positionable, and includes resizable modes (Small / Medium / Large) to fit different chart layouts.
How to use this tool
This indicator is best used as part of a discretionary trading process, for example:
Identifying areas where price is more likely to react or pause
Framing trades around higher-quality structure instead of arbitrary levels
Filtering setups based on session and regime context
Managing expectations near known liquidity rather than chasing price
It is intentionally designed not to provide trade signals.
Limitations and important notes
This script does not predict outcomes or guarantee reactions
High-scoring zones can still fail
Liquidity behavior is context-dependent and probabilistic
No performance claims or backtested results are provided
The indicator should not be used in isolation
Past behavior does not imply future results.
Chart and usage notes
The script is intended for standard time-based charts
Recommended for liquid futures and index products
Use a clean chart for clarity when publishing or sharing
No external indicators are required
Final note
Liquidity Levels Pro (Tool) — v6 is designed to organize complex market structure into a clear, readable framework, allowing traders to focus on execution and risk management rather than raw level detection.
This script reflects an analytical approach to intraday liquidity and structure, not an automated trading system.

BTC ETF Average Inflow Cost BasisConcept
Since the historic launch of Bitcoin Spot ETFs on January 11, 2024, institutional flows have become a major driver of price action. This indicator aims to visualize the aggregate Cost Basis (average entry price) of the major Bitcoin ETFs relative to the underlying asset.
It serves as an on-chain proxy for institutional positioning, helping traders identify critical support levels where ETF inflows have historically concentrated.
How it Works
The script aggregates daily volume data from the top Bitcoin ETFs (IBIT, FBTC, ARKB, GBTC, BITB) and compares it against the Bitcoin price (BTCUSDT).
ETF Cost Basis (Pink Line):
This is calculated as a Cumulative Volume-Weighted Average Price (VWAP), anchored specifically to the ETF launch date (Jan 11, 2024).
Formula: It accumulates (BTC Price * Total ETF Volume) and divides it by the Cumulative Total ETF Volume.
This creates a dynamic level representing the "breakeven" price for the aggregate volume traded through these funds.
True Market Mean (Gray Line):
This represents the simple cumulative average of the Bitcoin price since the ETF launch date. It acts as a neutral baseline for the post-ETF market era.
How to Use
Institutional Support: The Cost Basis line often acts as a strong dynamic support level during corrections. When price revisits this level, it suggests the market is returning to the average institutional entry price.
Trend Filter:
Price > Cost Basis: The market is in a net profit state relative to ETF flows (Bullish/Trend continuation).
Price < Cost Basis: The market is in a net loss state (Bearish/Capitulation risk).
Confluence: The intersection of the Cost Basis and the True Market Mean can signal pivotal moments of trend reset.
Features
Data Aggregation: Pulls data from 5 major ETFs via request.security without repainting (using closed bars).
Dashboard: Includes a table in the top-right corner displaying real-time values for Price, Cost Basis, and Market Mean.
Customization: You can toggle individual ETF Moving Averages in the settings (disabled by default due to price scale differences between BTC and ETF shares).
Disclaimer
This tool is for educational purposes only and attempts to estimate institutional cost basis using volume proxies. It does not represent financial advice.

Current and Previous Period Anchored VWAPanchored VVWAPS and previous month VWAP extend out into the following month. Includes 1SD for both

Colby Cheese VWAP Setup [v2.0]🔧 Core Refactors
• Imbalance function fixed:
• Removed invalid usage.
• Now uses for past bar references.
• Bias checks are handled outside the function with proper series indexing.
• Bias alignment:
• Added and so CHoCH signals only fire when price change agrees with EMA bias.
• Swing reset:
• After a valid CHoCH, and reset to so stale levels don’t keep firing.
• Line/label management:
• CHoCH lines and labels now reuse persistent IDs (, ) instead of spamming new objects every trigger.
✨ New Features
• Anticipation mode:
• Blue “Anticipate” lines/labels drawn when delta + bias align before CHoCH confirmation.
• Helps you see potential setups earlier.
• Entry zone lines:
• Solid green/red lines drawn at entry levels when is enabled.
• Separate from FRVP dashed zones.
• Stop‑loss lines:
• Orange dotted lines drawn opposite the entry zone when is enabled.
• Gives a visual risk marker.
🎨 Visual Consistency
• Candle coloring simplified: white candles only when CHoCH triggers.
• FRVP zones remain dashed lines with “Enter” labels.
• Anticipation zones are blue solid lines.
• Entry zones are solid green/red.
• Stop‑loss lines are orange dotted.

WOLFGATEWOLFGATE is a clean, session-aware market structure and regime framework designed to help traders contextualize price action using widely accepted institutional references. The indicator focuses on structure, momentum alignment, and mean interaction, without generating trade signals or predictions.
This script is built for clarity and decision support. It provides a consistent way to evaluate market conditions across different environments while remaining flexible to individual trading styles.
What This Indicator Displays
Momentum & Structure Averages
9 EMA — Short-term momentum driver
21 EMA — Structural control and trend confirmation
200 SMA — Primary regime boundary
400 SMA (optional) — Deep regime / macro bias reference
These averages are intended to help assess directional alignment, trend strength, and structural consistency.
Session VWAP (Institutional Mean)
Session-based VWAP with a clean daily reset
Default session: 09:30–16:00 ET
Uses HLC3 as the VWAP source for balanced price input
Rendered in a high-contrast institutional blue for visibility
VWAP can be used to evaluate mean interaction, acceptance, or rejection during the active session.
How to Use WOLFGATE
This framework is designed for context, not signals.
Traders may use WOLFGATE to:
Identify bullish or bearish market regimes
Evaluate momentum alignment across multiple time horizons
Observe price behavior relative to VWAP
Maintain directional bias during trending conditions
Avoid low-quality conditions when structure is misaligned
The indicator does not generate buy or sell signals and does not include alerts or automated execution logic.
Important Notes
Volume must be added separately using TradingView’s built-in Volume indicator
(Volume cannot be embedded directly into this script due to platform limitations.)
This script is intended for educational and analytical purposes only
No financial advice is provided
Users are responsible for their own risk management and trade decisions

NQ Futures VWAP on QQQOverlay NQ1 vwap for QQQ
Track NQ future's vwap on your QQQ chart to scale with optional bands

Student Alpha VWAPStudent Alpha VWAP is a flexible, anchor-based VWAP tool designed for traders who want deeper control over intraday and higher-timeframe volume-weighted trend analysis.
The indicator supports multiple anchor types—including Sessions, Weeks, Months, Quarters, Years, and event-based anchors such as Earnings, Dividends, and Splits—allowing VWAP to automatically reset at meaningful market intervals.
The script includes up to three optional VWAP bands. These can be calculated using standard deviation or percentage-based distance, making the tool adaptable for volatility modeling, mean-reversion strategies, or structural trend assessment.
Bands and colors are fully customizable, while an optional filter hides VWAP on 1D+ charts for cleaner high-timeframe layouts.
Features include:
• Event-aware VWAP anchoring (Earnings / Dividends / Splits)
• Standard deviation or percentage-based VWAP bands
• Three independent band multipliers with visual fills
• Automatic timeframe and period detection
• Offset controls and full plot toggle options
This tool aims to give traders a more adaptable, context-aware version of VWAP that fits both systematic and discretionary workflows.
VWAP-Anchored MACD [BOSWaves]VWAP-Anchored MACD - Volume-Weighted Momentum Mapping With Zero-Line Filtering
Overview
The VWAP-Anchored MACD delivers a refined momentum model built on volume-weighted price rather than raw closes, giving you a more grounded view of trend strength during sessions, weeks, or months.
Instead of tracking two EMAs of price like a standard MACD, this tool reconstructs the MACD engine using anchored VWAP as the core input. The result is a momentum structure that reacts to real liquidity flow, filters out weak crossovers near the zero line, and visualizes acceleration shifts with clear, high-contrast gradients.
This indicator acts as a precise momentum map that adapts in real time. You see how weighted price is accelerating, where valid crossovers form, and when trend conviction is strong enough to justify execution.
It uses gradient line coloring to show bullish or bearish momentum, histogram shading to highlight energy shifts, cross dots to mark valid crossovers, optional buy/sell diamonds for execution cues, and candle coloring to display trend strength at a glance.
Theoretical Foundation
Traditional MACD compares the difference between two exponential moving averages of price.
This variant replaces price with anchored VWAP, making the calculation sensitive to actual traded volume across your chosen period (Session, Week, or Month).
Three principles drive the logic:
Anchored VWAP Momentum : Price is weighted by volume and aggregated across the selected anchor. The fast and slow VWAP-EMAs then expose how liquidity-corrected momentum is expanding or contracting.
Zero-Line Distance Filtering : Crossover signals that occur too close to the zero line are removed. This eliminates the common MACD problem of generating weak, directionless signals in choppy phases.
Directional Visualization : MACD line, signal line, histogram, candle colors, and optional diamond markers all react to shifts in VWAP-momentum, giving you a clean structural read on market pressure.
Anchoring VWAP to session, weekly, or monthly resets creates a systematic framework for tracking how capital flow is driving momentum throughout each trading cycle.
How It Works
The core engine processes momentum through several mapped layers:
VWAP Aggregation : Price × volume is accumulated until the anchor resets. This creates a continuous, liquidity-corrected VWAP curve.
MACD Construction : Fast and slow VWAP-EMAs define the MACD line, while a smoothed signal line identifies edges where momentum shifts.
Zero-Line Distance Filter : MACD and signal must both exceed a threshold distance from zero for a crossover to count as valid. This prevents fake crossovers during compression.
Visual Momentum Layers : It uses gradient line coloring to show bullish or bearish momentum, histogram shading to highlight energy shifts, cross dots to mark valid crossovers, optional buy/sell diamonds for execution cues, and candle coloring to display trend strength at a glance.
This layered structure ensures you always know whether momentum is strengthening, fading, or transitioning.
Interpretation
You get a clean, structural understanding of VWAP-based momentum:
Bullish Phases : MACD > Signal, histogram expands, candles turn bullish, and crossovers occur above the threshold.
Bearish Phases : MACD < Signal, histogram drives lower, candles shift bearish, and downward crossovers trigger below the threshold.
Neutral/Compression : Both lines remain near the zero boundary, histogram flattens, and signals are suppressed to avoid noise.
This creates a more disciplined version of MACD momentum reading - less noise, more conviction, and better alignment with liquidity.
Strategy Integration
Trend Continuation : Use VWAP-MACD crossovers that occur far from the zero line as higher-conviction entries.
Zero-Line Rejection : Watch for histogram contractions near zero to anticipate flattening momentum and potential reversal setups.
Session/Week/Month Anchors : Session anchor works best for intraday flows. Weekly or monthly anchor structures create cleaner macro momentum reads for swing trading.
Signal-Only Execution : Optional buy/sell diamonds give you direct points to trigger trades without overanalyzing the chart.
This indicator slots cleanly into any momentum-following system and offers higher signal quality than classic MACD variants due to the volume-weighted core.
Technical Implementation Details
VWAP Reset Logic : Session (D), Week (W), or Month (M)
Dynamic Fast/Slow VWAP EMAs : Fully configurable lengths, smoothing and anchor settings
MACD/Signal Line Framework : Traditional structure with volume-anchored input
Zero-Line Filtering : Adjustable threshold for structural confirmation
Dual Visualization Layers : MACD body + histogram + crosses + candle coloring
Optimized Performance : Lightweight, fast rendering across all timeframes
Optimal Application Parameters
Timeframes:
1- 15 min : Short-term momentum scalping and rapid trend shifts
30- 240 min : Balanced momentum mapping with clear structural filtering
Daily : Macro VWAP regime identification
Suggested Configuration:
Fast Length : 12
Slow Length : 26
Signal Length : 9
Zero Threshold : 200 - 500 depending on asset range
These suggested parameters should be used as a baseline; their effectiveness depends on the asset volatility, liquidity, and preferred entry frequency, so fine-tuning is expected for optimal performance.
Performance Characteristics
High Effectiveness:
Assets with strong intraday or session-based volume cycles
Markets where volume-weighted momentum leads price swings
Trend environments with strong acceleration
Reduced Effectiveness:
Ultra-choppy markets hugging the VWAP axis
Sessions with abnormally low volume
Ranges where MACD naturally compresses
Disclaimer
The VWAP-Anchored MACD is a structural momentum tool designed to enhance directional clarity - not a guaranteed predictor. Performance depends on market regime, volatility, and disciplined execution. Use it alongside broader trend, volume, and structural analysis for optimal results.

VWAP From Pivots Lows and Highs
This script starts automatically VWAP from pivot lows and highs.
Parameter allows you to enable up to 3 VWAP (default).
If you use 3, the VWAP from the last three pivots point will be drawn.
If you use 1, just the last pivot point will be used.
You can also just enable VWAPs starting from pivot lows or highs.
Let me know if there are any problems.

Algo & Dark Pool Activity - Find Hidden LiquidityThe script is designed to highlight potential algorithmic buying pressure and dark pool accumulation proxies on a TradingView chart. It overlays signals directly on price bars so you can visually spot when unusual activity may be occurring.

Triple ATR Adaptive MAs + VWAP Option + Clouds + Candle Trend V2Another one of my experiences ... combining things...
📘 Indicator Description – Triple ATR Adaptive Moving Averages with VWAP Influence
This indicator plots three adaptive moving averages whose behavior changes dynamically based on market volatility (ATR) and optionally VWAP deviation.
Because they adapt in real time to both volatility and VWAP pressure, their movement, slope, and reaction speed differ significantly from traditional moving averages.
🔶 1. ATR-Adaptive Moving Averages
Each of the three MAs uses a custom adaptive formula:
ATR (Average True Range) is measured over a chosen period.
Higher ATR → more volatility → the MA becomes more reactive and moves closer to price.
Lower ATR → stable market → the MA becomes smoother and slower.
This creates a volatility-aware smoothing factor, making the MA expand, contract, and respond to market conditions in ways a classic SMA, EMA, or HMA cannot.
🔷 2. Optional VWAP Influence
Each MA has an independent toggle allowing it to be influenced by VWAP.
When enabled:
The MA is gently “pulled” toward VWAP.
The strength of this attraction is determined by the VWAP Influence parameter (0–1).
This causes the moving averages to behave differently from normal MAs:
In trending markets, the ATR and price push the MA away from VWAP.
In mean-reverting or balanced conditions, VWAP pulls the MA back toward fair value.
The result is an MA that reflects both trend pressure and fair-value pressure.
🔶 3. Visual Behavior: Non-Traditional Movement
Because each MA is simultaneously influenced by volatility, trend magnitude, and VWAP deviation, their shape is often very distinct from normal moving averages.
They may:
Respond faster during high volatility
Flatten out earlier during consolidation
Curve toward VWAP when price becomes extended
Separate or compress depending on ATR strength
This is intentional and essential, since the goal is to show:
✔ Volatility expansion
✔ Trend exhaustion
✔ Overextended price relative to VWAP
✔ Dynamic trend confirmation
Rather than simply smoothing past price.
🔷 4. Three Independent Adaptive Lines
Each of the three moving averages has:
Its own ATR length
Its own sensitivity multiplier
Its own optional VWAP influence
Its own color and trail
This allows the user to combine:
a fast volatility-adaptive trend line
a mid-range adaptive baseline
a slow adaptive long-trend MA
All adapting independently to volatility and VWAP conditions.
🔶 5. Optional Candle Coloring
The indicator can color candles according to trend strength derived from the fast/slow MAs.
Stronger trends produce more vivid colors. Neutral or conflicting trends produce softer colors.
This adds a visual layer to identify:
Trend direction
Trend strength
Volatility state
Market compression
at a glance.
📌 Summary
This indicator does not behave like standard SMAs or EMAs because each line dynamically adapts to:
🔸 ATR (volatility)
🔸 VWAP (fair value)
This makes the indicator extremely responsive to market conditions while still reducing noise during stable phases.
It provides a more realistic, context-aware, and intelligent representation of price behavior compared to traditional moving averages.

SMAs TimePortalPlots 5× SMAs from 3 different timeframes - plus current chart timeframe
Plots 2× VWAPs with bands.
Meant for personal use, but maybe you can find it useful too.
Disclaimer: Beware I might update this with big changes in the future.

Luxy VWAP Magic - MTF Projection EngineThis indicator transforms the classic VWAP into a comprehensive trading system. Instead of switching between multiple indicators, you get everything in one place: multi-timeframe analysis, statistical bands, momentum detection, volume profiling, session tracking, and divergence signals.
What Makes This Different
Traditional VWAP indicators show a single line. This tool treats VWAP as a foundation for complete market analysis. The indicator automatically detects your asset type (stocks, crypto, forex, futures) and adjusts its behavior accordingly. Crypto traders get 24/7 session tracking. Stock traders get proper market hours handling. Everyone gets institutional-grade analytics.
Anchor Period Options
The anchor period determines when VWAP resets and recalculates. You have three categories of options:
Time-Based Anchors:
Session - Resets at market open. Best for intraday stock trading where you want fresh VWAP each day.
Day - Resets at midnight UTC. Standard option for most traders.
Week / Month / Quarter / Year - Longer reset periods for swing traders and position traders who want broader context.
Rolling Window Anchors:
Rolling 5D - A sliding 5-day window that never resets. Solves the Monday problem where weekly VWAP equals daily VWAP on first day of week.
Rolling 21D - Approximately one month of trading data in continuous calculation. Excellent for crypto and forex markets that trade 24/7 without clear session breaks.
Event-Based Anchors:
Dividends - Resets on ex-dividend dates. Track institutional cost basis from dividend events.
Splits - Resets on stock split dates. Useful for analyzing post-split trading behavior.
Earnings - Resets on earnings report dates. See where volume-weighted trading occurred since last quarterly report.
Standard Deviation Bands
Three sets of bands surround the main VWAP line:
Band 1 (Aqua) - Plus and minus one standard deviation. Approximately 68% of price action occurs within this range under normal distribution. Touches suggest minor extension.
Band 2 (Fuchsia) - Plus and minus two standard deviations. Only 5% of trading should occur outside this range statistically. Touches here indicate significant overextension and high probability of mean reversion.
Band 3 (Purple) - Plus and minus three standard deviations. Touches are rare (0.3% probability) and represent extreme conditions. Often marks climax moves or panic selling/buying.
Each band can be toggled independently. Most traders show Band 1 by default and add Band 2 and 3 for specific setups or volatile instruments.
Multi-Timeframe VWAP System
The MTF section plots previous period VWAPs as horizontal support and resistance levels:
Daily VWAP - Previous day's final VWAP value. Key intraday reference level.
Weekly VWAP - Previous week's final VWAP. Important for swing traders.
Monthly VWAP - Previous month's final VWAP. Institutional benchmark level.
Quarterly VWAP - Previous quarter's final VWAP. Major support/resistance for position traders.
Previous Day VWAP - Yesterday's closing VWAP specifically, separate from current daily calculation.
The Confluence Zone percentage setting determines how close multiple VWAPs must be to trigger a confluence alert. When two or more timeframe VWAPs converge within this threshold, you get a high-probability support/resistance zone.
Session VWAPs for Global Markets
For forex, crypto, and futures traders who operate in 24/7 markets, the indicator tracks three major global sessions:
Asia Session - UTC 21:00 to 08:00. Gold colored line. Typically lower volatility, range-bound action that sets overnight levels.
London Session - UTC 08:00 to 17:00. Orange colored line. Often determines daily direction with high volume European participation.
New York Session - UTC 13:00 to 22:00. Blue colored line. Highest volume session globally. Sharp directional moves common.
Previous session VWAP values display as horizontal lines when each session closes, acting as intraday support and resistance. The table shows which sessions are currently active with checkmarks.
On-Chart Labels and Signals
The indicator plots several types of labels directly on price action when significant events occur:
Volume Spike Labels
Fire when current bar volume exceeds configurable thresholds relative to both the previous bar and the 20-bar average. Default settings require 300% of previous bar AND 200% of average volume. Green labels indicate bullish candles. Red labels indicate bearish candles. These spikes often mark institutional entry points.
Momentum Shift Labels
Appear when VWAP acceleration changes direction. The Slowing label warns when an active trend loses steam, often preceding reversal. The Accelerating label confirms trend continuation or potential bottom during downtrends. Filters available to show only reversal signals in existing trends.
VWAP Squeeze Labels
Detect when standard deviation bands contract relative to ATR (Average True Range). Low volatility compression often precedes explosive breakout moves. When the squeeze fires (releases), a label appears with directional prediction based on VWAP slope.
Divergence Labels
Mark price/volume divergences using CVD (Cumulative Volume Delta) analysis:
Bullish divergence: Price makes lower low, but CVD makes higher low. Hidden accumulation despite price weakness.
Bearish divergence: Price makes higher high, but CVD makes lower high. Hidden distribution despite price strength.
Dynamic VWAP Coloring
The main VWAP line changes color based on its slope direction:
Green - VWAP is rising. Institutional buying pressure. Volume-weighted price increasing.
Red - VWAP is falling. Institutional selling pressure. Volume-weighted price decreasing.
Gray - VWAP is flat. Consolidation or balance between buyers and sellers.
This coloring can be disabled for a static blue line if you prefer cleaner visuals. The VWAP label next to the line shows the current trend direction and delta percentage.
Calculated Projection Cone
One of the most powerful features is the Calculated Projection Cone. Unlike traditional extrapolation methods that simply extend a trend line forward, this system analyzes what actually happened in similar market conditions throughout the chart's history.
How It Works:
The system classifies each bar into one of 27 unique market states:
Z-Score Level - LOW (oversold), MID (fair value), or HIGH (overbought) based on configurable thresholds
Trend Direction - DOWN, FLAT, or UP based on VWAP slope
Volume Profile - LOW (below 80%), NORMAL (80-150%), or HIGH (above 150%) relative volume
When you look at the current bar, the indicator:
1. Identifies the current market state (e.g., LOW Z-Score + UP Trend + HIGH Volume)
2. Searches through all historical bars on the chart that had the same state
3. Calculates what happened in those bars X bars later (where X is your projection horizon)
4. Shows you the probability of up/down and the average move size
Visual Elements:
Probability Cone - Colored green (bullish probability above 55%), red (bearish below 45%), or gold (neutral). The cone width represents the historical range of outcomes (roughly the 20th to 80th percentile).
Center Line - Shows the average expected price based on historical outcomes in similar conditions.
Probability Label - Displays direction probability and average move. Example: "67% UP (+0.8%)" means 67% of similar past cases moved up, averaging 0.8% gain.
Fallback System:
When the exact 27-state match has insufficient historical data:
First fallback: Uses Z-Score plus Trend only (9 broader states, ignoring volume)
Second fallback: Uses Z-Score only (3 states)
When fallback is active, confidence automatically adjusts
Settings:
Projection Horizon - How many bars forward to analyze outcomes (5, 10, 15, or 20 bars, default 10)
Lookback Period - Historical data window in days (30-252, default 60)
Minimum Samples - Cases needed before using fallback (5-30, default 10)
Z-Score Threshold - Bucket boundary for LOW/MID/HIGH classification (1.0, 1.5, or 2.0 sigma)
Cloud Transparency - Adjust visibility (50-95%)
Colors - Customize bullish, bearish, and neutral cone colors
Confidence Levels:
HIGH - 30 or more similar historical cases found
MEDIUM - 15-29 similar cases
LOW - Fewer than 15 cases (more uncertainty)
IMPORTANT DISCLAIMER:
The Calculated Projection is based on past patterns only. It is NOT a price prediction or financial advice. Similar market states in the past do not guarantee similar outcomes in the future. The probability shown is historical frequency, not a guarantee. Always combine with other analysis and never rely solely on projections for trading decisions.
Alert Conditions
The indicator includes over 20 pre-built alert conditions:
Price vs VWAP:
Price crosses above VWAP
Price crosses below VWAP
Band Touches:
Price touches plus or minus one sigma band
Price touches plus or minus two sigma band (extreme)
Price touches plus or minus three sigma band (very extreme)
Z-Score Extremes:
Z-Score crosses above plus two (overbought extreme)
Z-Score crosses below minus two (oversold extreme)
Momentum and Trend:
Momentum slowing
Momentum accelerating
Trend turns bullish/bearish/neutral
Volume:
Volume spike detected
CVD Direction:
Buyers take control
Sellers take control
High Probability Signals:
Bullish reversal signal (oversold plus accelerating momentum)
Bearish reversal signal (overbought plus slowing momentum)
MTF and Special:
MTF confluence zone entry
VWAP squeeze fired
Bullish/Bearish divergence detected
Any significant signal (catch-all)
All signals use confirmed bar data to prevent false alerts from incomplete candles.
Settings Overview
Settings are organized into logical groups:
VWAP Settings
Anchor Period selection
Show/Hide VWAP line
Dynamic coloring toggle
VWAP label visibility
Bands Visibility
Toggle each of three bands independently
Info Table
Show/Hide table
Table position (9 options)
Text size
Volume spike label settings with adjustable thresholds
Momentum label settings with filters
Signal labels limited to 5 most recent (auto-managed)
Probability engine lookback period
Multi-Timeframe VWAP
Enable/Disable MTF system
Show MTF in table
Show MTF lines on chart
Individual timeframe toggles
Confluence zone threshold
Squeeze detection toggle
Session VWAPs
Enable/Disable session tracking
Apply to all assets option
Show session labels
Divergence Detection
Enable/Disable divergence
Pivot lookback period
Show divergence labels
Calculated Projection
Enable/Disable projection cone
Projection horizon (5, 10, 15, or 20 bars)
Lookback period in days (30-252)
Minimum samples threshold
Z-Score classification threshold (1.0, 1.5, or 2.0 sigma)
Cloud transparency adjustment
Bullish, bearish, and neutral colors
The Info Table - Your Trading Dashboard
The right side of your chart displays a compact table with up to twelve metrics.
Row-by-Row Breakdown:
Asset and Period - Shows what the indicator detected (US Stock, Crypto, Forex, etc.) and your selected anchor period. The detection happens automatically based on exchange data, so VWAP resets and calculations match your actual trading instrument.
Delta Percentage - How far current price sits from VWAP, expressed as a percentage. Positive means price trades above fair value. Negative means below. Large delta values (beyond 1-2%) often precede mean reversion moves. Day traders watch this for overextension.
Z-Score - Statistical deviation from VWAP measured in standard deviations. Unlike raw delta, Z-Score accounts for volatility. A 2% move in a volatile biotech stock differs from 2% in a stable utility. Z-Score normalizes this. Values beyond plus or minus two sigma occur only 5% of the time statistically.
Trend Direction - Whether VWAP itself is rising, falling, or flat. Rising VWAP means the volume-weighted average price is increasing, which indicates institutional accumulation. Falling VWAP suggests distribution. This differs from price trend since it weights by volume.
Momentum State - Is the trend accelerating or slowing down? This measures the rate of change in VWAP slope. When an uptrend shows slowing momentum, it often precedes reversal. Accelerating momentum in a downtrend can signal capitulation and potential bottom.
Relative Volume - Current bar volume compared to the 20-bar average, shown as percentage. Values above 150% indicate above-average activity. Spikes above 200-300% often mark institutional involvement. Low volume (below 80%) warns of potential fake moves.
MTF Bias - Four checkmarks or X marks showing whether price sits above or below Daily, Weekly, Monthly, and Quarterly VWAP. Four checkmarks means strong bullish alignment across all timeframes. Four X marks indicates bearish alignment. Mixed readings suggest consolidation or transition.
Band Probabilities - Historical statistics showing how often price touched each standard deviation band over your lookback period. This helps you understand if mean reversion or trend following works better for your specific instrument.
Session Status - Which global trading sessions are currently active (Asia, London, New York). Shows checkmarks for active sessions. Important for forex and crypto traders who need to know when major liquidity windows open and close.
Divergence State - Whether the indicator detects bullish or bearish divergence between price and cumulative volume delta. Bullish divergence occurs when price makes lower lows but buying pressure (CVD) makes higher lows, suggesting hidden accumulation.
Confidence Score - A weighted composite of all factors displayed as a progress bar and percentage. Combines MTF alignment, Z-Score, trend direction, volume delta, momentum, and relative volume into a single 0-100 score. Higher scores indicate stronger conviction setups.
Calculated Projection - When the Projection Cone is enabled, shows the historical probability of price direction and expected move. For example: "▲ 67% (+0.8%)" means in similar market states historically, price moved up 67% of the time with an average gain of 0.8%. The system analyzes 27 unique market states based on Z-Score, Trend, and Volume conditions.
Recommended Use Cases
Day Trading Stocks:
Use Session anchor with Band 1 visible. Watch for price returning to VWAP after morning move. Volume spikes near VWAP often mark institutional accumulation zones.
Swing Trading:
Use Weekly or Rolling 21D anchor. Enable MTF lines for Daily and Weekly levels. Trade pullbacks to these levels in direction of MTF bias.
Crypto and Forex:
Enable Session VWAPs. Use Rolling anchors to avoid artificial resets. Monitor session transitions for breakout opportunities.
Mean Reversion:
Focus on Z-Score reaching plus or minus two. Add Band 2 visibility. Combine with slowing momentum for highest probability reversals.
Trend Following:
Watch MTF bias alignment. Four checkmarks plus accelerating momentum plus high volume confirms trend continuation setups.
Projection Planning:
Enable the Calculated Projection to see what happened historically in similar market conditions. Use 5-10 bars for intraday setups, 15-20 bars for swing trade planning. Focus on high probability readings (above 60%) with HIGH confidence (30 or more samples). The cone shows the probable range of outcomes based on actual historical data. Combine with other factors like MTF alignment and volume for higher conviction setups.
Important Notes
The indicator does not repaint. MTF values use previous period's confirmed data.
Rolling VWAP works best on 15-minute timeframes and above due to bar lookback requirements.
Session VWAPs apply to global markets by default (forex, crypto, futures). Enable the all-assets option for stocks if desired.
Volume data for forex represents tick volume, not actual traded volume.
All alert conditions fire only on confirmed (closed) bars to prevent false signals.
The Calculated Projection updates each bar as market state changes. This is expected behavior. The projection shows probabilities based on similar past conditions, not a fixed prediction.
Q AND A
Q: Does this indicator repaint?
A: No. The main VWAP calculation uses standard TradingView VWAP methodology. Multi-timeframe values use previous period's confirmed data with appropriate lookahead settings. All alert signals require bar confirmation.
Q: Why does my Rolling VWAP look different on 1-minute versus 15-minute charts?
A: Rolling VWAP calculates across a fixed number of trading days. On very short timeframes, the bar lookback may hit TradingView limits. For best Rolling VWAP accuracy, use 15-minute or higher timeframes.
Q: Can I use this on any instrument?
A: Yes. The indicator automatically detects asset type and adjusts behavior. Stocks use standard market hours. Crypto uses 24/7 calculations. Forex uses tick volume. Everything adapts automatically.
Q: What does the Confidence Score actually measure?
A: The score combines six weighted factors: MTF alignment (25%), Z-Score position (20%), Trend direction (20%), CVD pressure (15%), Momentum state (10%), and Relative volume (10%). Higher scores indicate more factors aligned in one direction.
Q: Why are Session VWAPs not showing on my stock chart?
A: Session VWAPs apply to 24-hour markets by default (forex, crypto, futures). For stocks, enable the Use for All Assets option in Session VWAP settings.
Q: The Divergence labels appear delayed. Is this a bug?
A: Divergence detection requires pivot confirmation, which needs bars on both sides of the pivot point. The label appears at the actual pivot location (several bars back) once confirmed. This is intentional and prevents false signals.
Q: Can I change the band colors?
A: Yes. Each of the three bands has its own color input setting. You can customize Band 1, Band 2, and Band 3 colors to match your preferences. The defaults are Aqua, Fuchsia, and Purple. The main VWAP line color adapts dynamically based on slope direction or can be set to static blue.
Q: How do I set up alerts?
A: Right-click on the chart, select Add Alert, choose this indicator, and select your desired condition from the dropdown. All conditions include descriptive alert messages with relevant data.
Q: What is the Probability Engine lookback period?
A: This setting determines how many trading days the indicator analyzes to calculate band touch rates and mean reversion statistics. Default is 60 days (approximately 3 months). Longer periods provide more stable statistics but may miss recent behavior changes.
Q: Why do I see fewer labels than expected?
A: Signal labels (Volume, Momentum, Squeeze, Divergence) are limited to 5 most recent labels on the chart to keep it clean. When a new label appears, the oldest one is automatically removed. Additionally, momentum labels have several filters: check the slope multiplier setting (higher values require stronger trends) and the Only Reversal Signals option (when enabled, labels only appear for potential reversals, not trend confirmations).
Q: What is the Calculated Projection and how accurate is it?
A: The Calculated Projection analyzes what happened in past market conditions similar to the current state. It classifies each bar by Z-Score level, Trend direction, and Volume profile (27 unique states), then shows the historical probability of up vs down and the average move size. It is NOT a price prediction or guarantee. The probability shown is how often similar conditions led to up/down moves historically, not a future guarantee. Always use it as one input among many.
Q: Why does the Projection probability change?
A: The projection updates on each bar as market state changes. If Z-Score moves from LOW to MID, or trend shifts from UP to FLAT, the system looks up a different historical category. This is expected behavior. The projection shows what happened in similar past conditions to the current bar's state.
Q: The Projection shows LOW confidence. What does that mean?
A: Confidence levels indicate sample size: HIGH means 30 or more historical cases found, MEDIUM means 15-29 cases, LOW means fewer than 15 cases. When sample size is low, the system uses a fallback: first aggregating by Z-Score plus Trend only (ignoring volume), then by Z-Score only. LOW confidence means less statistical reliability, so weight other factors more heavily in your decision.
Q: Why does the cone sometimes show 50/50 probability?
A: A 50/50 reading means that in similar past market states, price moved up roughly half the time and down half the time. This indicates a neutral or balanced condition where historical patterns provide no directional edge. Consider waiting for a higher probability setup or using other analysis methods.
CREDITS AND ACKNOWLEDGMENTS
Methodology Foundation:
VWAP (Volume Weighted Average Price) - Standard institutional benchmark calculation, widely used since the 1980s for algorithmic execution and fair value assessment
Standard Deviation Bands - Statistical volatility measurement applying normal distribution principles to price deviation from mean
Z-Score Analysis - Classic statistical normalization technique for comparing values across different volatility regimes
Cumulative Volume Delta (CVD) - Order flow analysis concept measuring aggressive buying versus selling pressure
Concept Integration:
Mean reversion probability engine - Custom historical statistics tracking for band touch rates
Momentum acceleration detection - Second derivative analysis of VWAP slope changes
VWAP Squeeze - Volatility compression concept adapted from TTM Squeeze methodology applied to VWAP bands versus ATR
Confidence scoring system - Weighted composite scoring combining multiple technical factors
Calculated Projection Cone - Probability-based projection using 27-state market classification (Z-Score, Trend, Volume) with historical outcome analysis and weighted fallback system
All calculations use standard public domain formulas and TradingView built-in functions. No proprietary third-party code was used.
For questions, feedback, or feature requests, please comment below or send a private message.
Happy Trading!

Session VWAPs [cryptalent]This indicator provides a more granular and timely analysis of market structure compared to traditional daily Volume Weighted Average Price (VWAP). It splits the 24-hour trading day into four distinct, customizable sessions (T1, T2, T3, T4), calculating an independent Session VWAP and Standard Deviation Bands for each segment.
🌟 Key Features and Functionality
1. Segmented VWAP Calculation
Purpose: To track the true Volume Weighted Average Price (Fair Value) specific to the participants and trading activities within different global market sessions (e.g., Asian, European, US sessions).
Design: By default, the 24 hours (based on UTC time) are divided into T1 (00:00-06:00), T2 (06:00-12:00), T3 (12:00-20:00), and T4 (20:00-00:00).
Mechanism: The VWAP calculation resets at the start of each designated session, offering a clearer, segment-specific view of market consensus and volume absorption.
2. Standard Deviation Bands
Calculation: Each Session VWAP line is accompanied by upper and lower standard deviation bands.
Control: The width of these bands is controlled by the user input "Band Multiplier" (default is 1.0, representing one standard deviation).
Application: These bands measure the Volume-Weighted Volatility and define the expected "normal" trading range for the current session.
- Price within the bands suggests consolidation or a normal auction process.
- Price breaking out of the bands indicates strong directional momentum or an extreme/overbought/oversold condition for that specific session.
3. High Customization (User Inputs)
Session Timing: All four session start and end times (in UTC) are customizable, allowing traders to align the indicator with specific market hours or individual trading strategies.
Price Source: The source price used for the VWAP calculation is selectable (default is close).
💡 Trading Applications
1. Fair Value Identification: The VWAP line serves as the "Fair Value" or "Volume-Weighted Consensus Cost" for the active session.
Price above VWAP: Buyers are in control during that session.
Price below VWAP: Sellers are in control during that session.
2. Dynamic Support & Resistance: Both the VWAP and the Standard Deviation Bands often act as reliable dynamic support and resistance levels.
3. Volatility Assessment: The width of the bands reflects the volume-weighted volatility of the current session. Narrow bands suggest range-bound trading; wide bands imply strong directional activity.
4. Trend Strength: Sustained price action outside of the standard deviation bands is a key measure of the strength and commitment behind a current trend.

Session Dynamics & Pivot Overlay (Arjo)## **OVERVIEW**
The **Session Dynamics & Pivot Overlay (Arjo)** is a visual analysis tool that displays session-based price ranges, anchored volume-weighted averages, daily pivot levels, and smoothed trend conditions on the chart. It highlights how price interacts with custom sessions, midpoint levels, and dynamic ranges, providing a structured visual layout that helps users observe market behavior over time without implying any form of prediction or trading signal.
## **CONCEPTS**
This indicator incorporates several widely used analytical concepts:
- **Session Ranges:** Identifies user-defined time windows and visually displays their high, low, and midpoint behavior throughout the session.
- **VWAP (Morning Session):** Shows volume-weighted average price calculations for a defined morning period, assisting with visual comparison between price and weighted averages.
- **Daily Pivot Levels:** Displays R1–R2, S1–S2, central pivot, and associated levels derived from prior daily price data.
- **Trend Smoothing:** Uses SuperSmoother filtering and an additional EMA to highlight whether the smoothed trend is rising or falling.
- **EMA + ATR Bands:** Plots a 20-period EMA with upper and lower ATR-derived bands to help visualize short-term price displacement relative to average true range.
All of these elements are presented solely for structural and comparative chart analysis.
## **FEATURES**
- **Custom Session Visualization:** Automatically draws session boxes, capturing the evolving high, low, and midpoint throughout the defined intraday window.
- **Dynamic Midline Calculation:** A midpoint line is updated continuously during the session to visually anchor price within the session’s range.
- **Morning Session VWAP:** Displays a dedicated VWAP line for the morning window with adjustable source and configuration options.
- **Daily Pivot Lines:** Automatically plots pivot, BC/TC, R1–R2, and S1–S2 levels with customizable colors, widths, and line styles.
- **Trend-Responsive Pivot Display:** Optionally toggles visibility of R2 or S2 depending on the direction of the smoothed trend.
- **EMA + ATR Zones:** Renders a 20-EMA and ATR-based support/resistance zone using filled regions for enhanced visual clarity.
- **Full Customization:** Multiple color, transparency, line-style, and display options allow users to adapt the presentation to their charting preferences.
- **Overlay Compatible:** Designed to work directly on price charts without obstructing candles or other overlays.
## **HOW TO USE**
Users can interact with the indicator entirely through the settings panel:
- Adjust session timings to match preferred market hours or custom internal zones.
- Enable or disable the display of pivot levels, VWAP, or the ATR/EMA zone.
- Customize colors and line styles to improve visibility according to the chart background or personal preference.
- Observe how price behaves relative to the session box, midpoint, VWAP, and pivot levels for contextual understanding.
- Utilize the smoothed trend condition to see when the indicator chooses to display certain pivot extensions.
These elements help users interpret chart structure, volatility, and intraday behavior in a visually organized manner.
## **CONCLUSION**
The ** Session Dynamics & Pivot Overlay (Arjo) ** indicator offers a consolidated view of session structure, pivot levels, VWAP, and smoothed trend conditions. Its purpose is to improve visual clarity and assist users in understanding market context without issuing directives or trade suggestions. It functions as an educational tool that enhances chart interpretation and supports structured analysis.
---
## **DISCLAIMER**
This indicator is for educational and visual analysis purposes only. It does not provide trading signals, financial advice, or guaranteed outcomes. Users should conduct their own research and consult a licensed financial professional when necessary. All trading decisions are solely the responsibility of the user.
Happy Trading (Arjo)

Aydan ScalperBy when EMA 8 cross EMA 21 from Below to Abouve and SELL when EMA 21 cross EMA 8 from Abouve to Belove

VWAP 1SD 2SD yasurferThis custom intraday indicator is designed to provide a detailed understanding of market equilibrium, volatility expansion, and trend structure by combining Session VWAP, Standard Deviation bands, and multi-timeframe EMAs. The script calculates cumulative volume-weighted price data throughout the trading day and automatically resets at the start of each new session. This ensures that the Session VWAP reflects only current-day trading activity, making it highly relevant for scalpers, day traders, and intraday swing setups.
The ±2 Standard Deviation bands illustrate where price is statistically stretched. These zones often act as areas of exhaustion, liquidity grabs, or potential momentum continuation points. By tracking variance around VWAP, the indicator helps traders quickly identify whether price is trading within a normal distribution or pushing into extreme territory.
A dynamic label displays the real-time percentage distance from VWAP, allowing traders to assess how far price has deviated from fair value. This is particularly useful for identifying overextended moves, mean-reversion opportunities, or breakout conditions.
The addition of EMA 50, EMA 200, and EMA 325 provides structural trend context—helping traders evaluate higher-timeframe alignment and potential confluence with VWAP levels. Overall, this indicator enhances clarity, timing, and decision-making by blending statistical tools with traditional trend analysis.

Institutional VWAP Suite (Lite Compatible)The **Institutional VWAP Suite (Lite Compatible)** brings true institutional volume-weighted price analysis to every trader — even on TradingView Lite/Free accounts where standard VWAP tools are restricted.
This script recreates the most important VWAP models used by banks, funds, and high-frequency desks, including:
• **Daily VWAP** (exchange-accurate)
• **Weekly VWAP** (manually accumulated)
• **Monthly VWAP** (manually accumulated)
• **Rolling Window VWAP** (array-based, fully Lite-compatible)
All calculations avoid blocked functions like `ta.sum` or session-restricted VWAP calls. Everything is built manually from volume and price to ensure accuracy across all accounts and all markets.
### Features
• Multi-timeframe VWAPs (Daily/Weekly/Monthly)
• Manual Rolling VWAP with adjustable length
• Optional VWAP bands (Lite-safe)
• Clean visuals with color-coded levels
• Optimized arrays for fast, stable performance
• Free-tier compatible — no premium functions required
This tool is designed for traders who want institutional structure, premium-level VWAP calculations, and consistent execution regardless of plan level. Perfect for scalpers, day traders, futures traders, and anyone who uses intraday volume profiles.
### Recommended Use
• Map directional bias using Daily vs Weekly VWAP
• Use Monthly VWAP for macro trend context
• Track intraday mean reversion with Rolling VWAP
• Use VWAP bands as dynamic support/resistance zones
A simple, powerful, no-restrictions VWAP engine — built for everyone.

Hybrid -WinCAlgo/// 🇬🇧
Hybrid - WinCAlgo is a weighted composite oscillator designed to provide a more robust and reliable signal than the standard Relative Strength Index (RSI). It integrates four different momentum and volume metrics—RSI, Money Flow Index (MFI), Scaled CCI, and VWAP-RSI—into a single 0-100 oscillator.
This powerful tool aims to filter market noise and enhance the detection of trend reversals by confirming momentum with trading volume and volume-weighted average price action.
⚪ What is this Indicator?
The Hybrid Oscillator combines:
* RSI (40% Weight): Measures fundamental price momentum.
* VWAP-RSI (40% Weight): Measures the momentum of the Volume Weighted Average Price (VWAP), providing strong volume confirmation for trend strength.
* MFI (10% Weight): Measures money flow volume, confirming momentum with liquidity.
* Scaled CCI (10% Weight): Tracks market extremes and potential trend shifts, scaled to fit the 0-100 range.
⚪ Key Features
* Composite Strength: Blends four different market factors for a multi-dimensional view of momentum.
* Volume Integration: High weights on VWAP-RSI and MFI ensure that momentum signals are backed by trading volume.
* Advanced Divergence: The robust formula significantly enhances the detection of Bullish and Bearish Divergences, often providing an earlier signal than traditional oscillators.
* Customizable: Adjustable Lookback Length (N) and Individual Component Weights allow users to fine-tune the oscillator for specific assets or timeframes.
* Visual Clarity: Uses 40/60 bands for earlier Overbought/Oversold indications, with a gradient-styled background for intuitive visual interpretation.
⚪ Usage
Use Hybrid – WinCAlgo as your primary momentum confirmation tool:
* Divergence Signals: Trust the indicator when it fails to confirm new price highs/lows; this signals imminent trend exhaustion and reversal.
* Accumulation/Distribution: Look for the oscillator to rise/fall while the price is ranging at a bottom/top; this confirms hidden buying or selling (accumulation).
* Overbought/Oversold: Use the 60 band as the trigger for potential selling/shorting signals, and the 40 band for potential buying/longing signals.
* Noise Filter: Combine with a higher timeframe chart (e.g., 4H or Daily) to filter out gürültü (noise) and focus only on significant momentum shifts.
---

FAIRPRICE_VWAP_RDFAIRPRICE_VWAP_RD
This script plots an **anchored VWAP (Volume Weighted Average Price)** that resets
based on the user-selected anchor period. It acts as a dynamic “fair value” line
that reflects where the market has actually transacted during the chosen period.
FEATURES
- Multiple anchor options: Session, Week, Month, Quarter, Year, Decade, Century,
Earnings, Dividends, or Splits.
- Intelligent handling of the “Session” anchor so it works correctly on both 1m
(resets each new day) and 1D (continuous, non-resetting VWAP).
- Manual VWAP calculation using cumulative(price * volume) and cumulative(volume),
ensuring the line is stable and works on all timeframes.
- Optional hiding of VWAP on daily or higher charts.
- Offset input for horizontal shifting if desired.
- VWAP provides a true “fair price” reference for trend, mean-reversion,
and institutional-level analysis.
PURPOSE
This indicator solves the common problem of VWAP behaving incorrectly on higher
timeframes, on synthetic data, or with unusual anchors. By implementing VWAP
manually and allowing flexible reset conditions, it functions reliably as
an institutional-style fair value benchmark across any timeframe.
