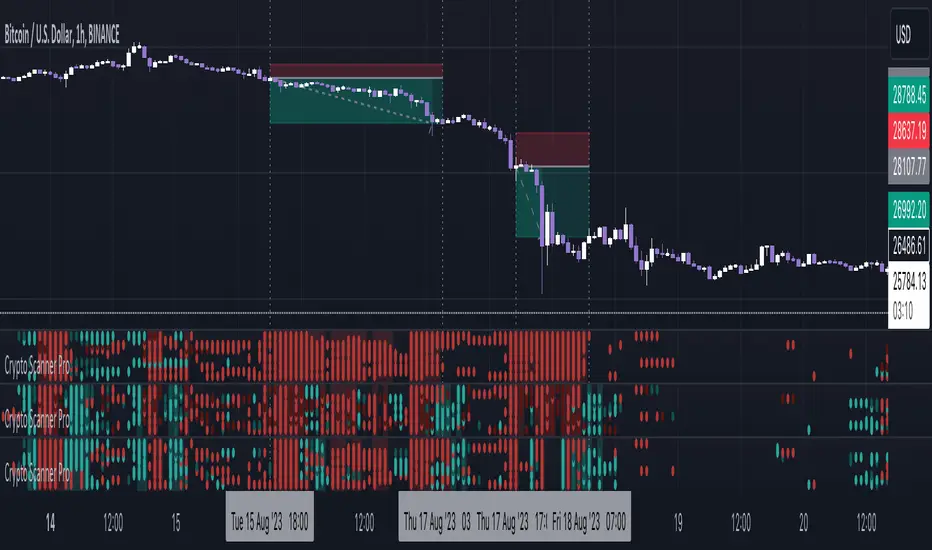
Crypto Scanner Pro [FxScripts]***** FEATURES *****
Crypto Scanner Pro is both an indicator and market scanner combined. The combination allows you to have multiple eyes across the market, all from a single chart.
Each scanner is comprised of an intuitively designed 3-in-1 tool that tracks the key metrics that drive markets.
They each use advanced algorithms to gather information from multiple data points, distilled into one simplified view.
***** TREND SCANNER *****
The Trend Scanner allows you to track price action across the wider market. Instantly see pattern shifts and emerging trends; when the market moves, you can move with it.
***** MOMENTUM SCANNER *****
The Momentum Scanner offers realtime insights into momentum shifts as they occur. This allows you to monitor false breakouts and catch the moves that matter.
***** VOLUME SCANNER *****
The Volume Scanner provides unique indications into where buy and sell volume is being placed. It offers a further way of determining entry and exit points or simply confirmation that a trend is underway.
***** INSTRUMENTS *****
Crypto Scanner Pro works effortlessly with the following large cap coins:
Avalanche, Bitcoin Cash, Bitcoin, BITO, BNB, Cardano, Chainlink, Dogecoin, Ethereum, Litecoin, Polkadot, Polygon, Shiba Inu, Solana, Stellar, Toncoin, XRP (Ripple) *
***** SETTINGS OVERVIEW *****
The scanner features the following customizable settings:
~~ Trend Settings ~~
Trend Filter - adjusting this will allow you to focus on short term trends (most suitable for scalping), medium or long term (best for swing trading).
Countertrend Strength - increases the sensitivity of weaker vs stronger countertrends. As countertrends are trends that run against the main trend, this will assist in detecting the strength of a pullback or reversal and allow you to either hold, exit or reverse the trade with confidence.
~~ Momentum Settings ~~
Momentum Filter - increase or decrease the sensitivity of the momentum scanner. Increase to avoid periods of low or weak momentum, decrease to highlight stronger surges in momentum.
~~ Volume Settings ~~
Volume Filter - increase or decrease the sensitivity of the volume scanner. Increase to avoid periods where buy and sell volume can potentially cancel each other out.
~~ Volatility Settings ~~
Volatility Offset - use this to fine tune the volatility filter. A higher value generally delays the volatility filter allowing for confirmation of stronger trends, a lower value will detect trend, momentum or volume movement sooner but may be less accurate.
Each scanner has its own setting allowing you to adjust how you monitor the underlying volatility for each.
As with all settings, we recommend adjusting this to your style of trading, instrument and timeframe.
~~ Alerts ~~
Alerts can be configured to send notifications when anything from 6-10 bullish or bearish dots are showing. Exit markers can be configured when anything from 2+ dots are revealed. This adds an extra layer of sensitivity for traders who appreciate complete control over their trade.
~~ Display Settings ~~
You have the ability to hide all colored dots and only show the background or, alternatively, hide the background and only show colored dots.
***** TRIAL PERIOD *****
We offer a FREE, no questions asked, 7-day trial with every new registration. Visit the link below to register.
* list subject to change as coins increase or decrease in popularity
Volumetrading
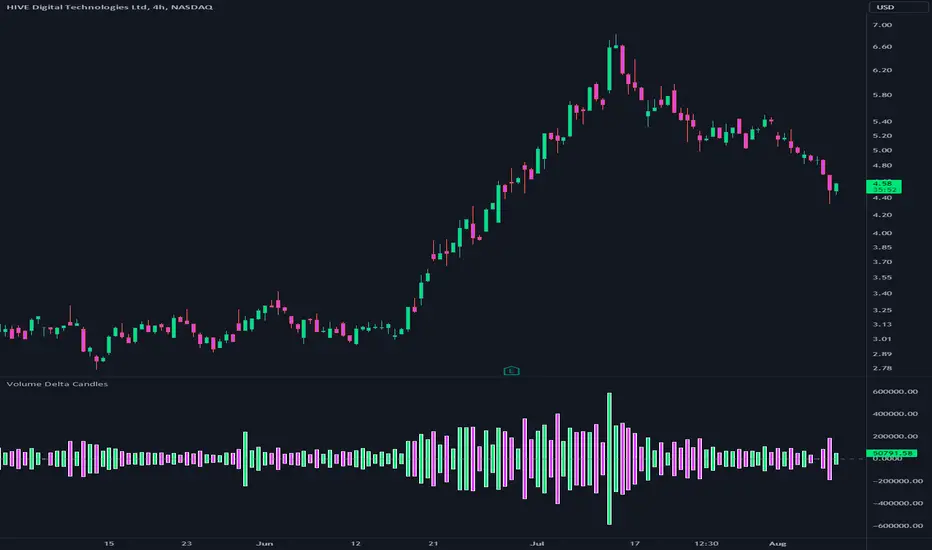
Volume Delta CandlesThis indicator is designed to visualize the volume delta, which represents the difference between buying and selling volumes during each candle period. The indicator plots custom candlesticks on the chart, with OHLC values calculated based on the volume delta.
Calculations:
To calculate the volume delta, the indicator first determines the buying and selling volumes. If the closing price is higher than the opening price (close > open), the volume is considered as buying volume. If the closing price is lower than the opening price (close < open), the volume is considered as selling volume. Otherwise, the volume is set to zero. The volume delta is then calculated as the difference between the buying volume and the selling volume.
The custom OHLC values are derived from the volume delta. The custom open is obtained by subtracting the volume delta from the closing price. The custom close is obtained by adding the volume delta to the closing price. The custom high is set as the maximum value between the closing price and the custom open, ensuring that the candle represents the highest value within the range. The custom low is set as the minimum value between the closing price and the custom open, ensuring that the candle represents the lowest value within the range.
Interpretation:
The indicator's custom candles provide visual insights into the volume delta. Each candlestick's color (lime for positive volume delta, fuchsia for negative volume delta) indicates the dominance of buying or selling pressure during that period. When the volume delta is positive, it suggests that buying volume exceeded selling volume, possibly indicating a bullish sentiment. Conversely, when the volume delta is negative, it indicates that selling volume was higher, potentially signaling a bearish sentiment. The indicator also plots a zero line to represent the equilibrium point, where buying and selling volumes are equal.
Potential Uses and Limitations:
Traders can use the indicator to gain insights into the strength and direction of buying and selling pressures. Positive volume delta during an uptrend could suggest the presence of strong buying interest, potentially supporting further bullish moves. On the other hand, negative volume delta during a downtrend could indicate intensified selling pressure, hinting at potential further declines. Traders might use the indicator in conjunction with other technical analysis tools, such as support and resistance levels, trendlines, or oscillators, to confirm potential reversal points or trend continuations.
It's essential to interpret the indicator in the context of the overall market environment. While volume delta can provide valuable insights into short-term buying and selling imbalances, it is just one aspect of market analysis. Traders should consider other factors, such as market structure, fundamental events, and overall sentiment, to make informed trading decisions. Additionally, the indicator's efficacy might vary across different market conditions, and it may produce false signals during low-volume periods or choppy markets.
Conclusion:
By visualizing volume delta through custom candlesticks, traders can gauge market sentiment and potentially identify key reversal or continuation points. As with any technical indicator, it is advisable to use the Volume Delta Candles in combination with other tools to gain a comprehensive understanding of market conditions and make well-informed trading choices. Additionally, traders should practice proper risk management techniques to protect their capital while using the indicator in their trading strategy.
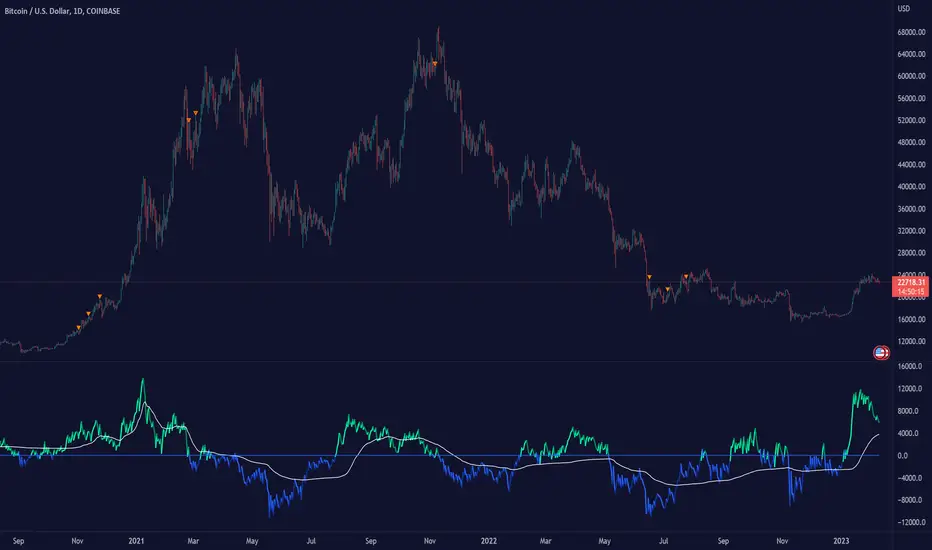
Volume Delta (Expo)█ Overview
Volume Delta (Expo) is a trading tool that measures the difference between buying and selling volume in a given market. It is a powerful tool for analyzing volume clusters and price action, as it can help traders identify the direction and strength of the trend as well as potential volume-weighted support and resistance areas.
█ How is the Volume Delta calculated?
Volume Delta is calculated by subtracting the number of contracts traded on the bid from the number of contracts traded on the ask. A positive Volume Delta indicates that more contracts are being traded on the ask than on the bid, which suggests buying pressure. A negative Volume Delta indicates that more contracts are being traded on the bid than on the ask, which suggests selling pressure.
Note, our Volume Delta (Expo) uses intrabar analysis in combination with volume clusters which is a great approximation to calculating volume delta on TradingView. The tool is equipped with a unique volume-weighted cluster function to calculate the delta trend over time as well as a dynamic trend strength calculation.
█ How to Use Volume Delta to Analyze Volume Clusters
Volume clusters are areas of high volume that indicate a potential change in price direction. Once the clusters have been identified, traders can then use Volume Delta to measure the difference between buying and selling volume in the clusters.
If the buying volume is greater than the selling volume, it indicates that the price is likely to move higher. Conversely, if the selling volume is greater than the buying volume, it indicates that the price is likely to move lower.
In addition to measuring the difference between buying and selling volume, traders can also use Volume Delta to analyze price action. By looking at the volume clusters and the corresponding price action, traders can identify potential support and resistance levels.
█ How to use
The volume delta provides insight into market sentiment, as a rise in buying volume on a positive close indicates that bullish sentiment is strengthening, while a rise in selling volume on a negative close indicates that bearish sentiment is increasing. In addition, use volume delta to identify the direction and strength of the trend.
It's common among volume traders to use volume delta to confirm trends, identify reversals, divergences, and volume-weighted support and resistance areas
Volume - divergences
If the volume delta is positive but the price trend is still bearish, it could be an indication that the current trend is weakening and a reversal may be imminent. Similarly, if the volume delta is negative but the price trend is still bullish, it could be an indication that the current trend is weakening and a reversal may be imminent.
█ Indicator Features
In addition to the main Volume Delta feature, the indicator has the following features:
Adaptive or Stability Volume Strength: Choose between adaptive or stability volume strength.
Exhausted Volume bars: Show Exhausted Volume Bars on the chart.
Divergences: Enable Regular and Hidden Volume Divergences
-----------------
Disclaimer
The information contained in my Scripts/Indicators/Ideas/Algos/Systems does not constitute financial advice or a solicitation to buy or sell any securities of any type. I will not accept liability for any loss or damage, including without limitation any loss of profit, which may arise directly or indirectly from the use of or reliance on such information.
All investments involve risk, and the past performance of a security, industry, sector, market, financial product, trading strategy, backtest, or individual's trading does not guarantee future results or returns. Investors are fully responsible for any investment decisions they make. Such decisions should be based solely on an evaluation of their financial circumstances, investment objectives, risk tolerance, and liquidity needs.
My Scripts/Indicators/Ideas/Algos/Systems are only for educational purposes!
Exhausted Volume (Expo)Exhausted Volume (Expo)
DESCRIPTION
Exhausted Volume (Expo) indicator visualize exhausted volume. Exhaustion often signals the reversal of a current trend because it illustrates excess levels of supply or demand, indicating a market is either overbought or oversold.
The indicator can also be used to detect volume pressure in either direction which can occur in breakouts or in reversal points. The input variable ‘Volume Length’ can be changed. A longer Volume length means that the indicator detects bolder exhausted volume.
• Volume pressure is seen in reversal points.
• Volume pressure can be seen in breakouts.
The indicator is also equipped with exhausted volume signals that are more sensitive. This is visualized with arrows up and down. The investor has the ability to adjust the sensitivity of these signals.
HOW TO USE
1. Use the indicator to identify exhausted volume
2. Use the indicator to identify volume pressure.
3. Use the indicator to identify reversal points.
4. Use the indicator to identify breakouts.
Combine the indicator with ‘ Climax Volume (Expo) ’
INDICATOR IN ACTION
EURUSD
EURUSD
BTCUSD
BTCUSD
The indicator works with RENKO, HEIKIN ASHI and with KAGI charts as well.
I hope you find this indicator useful, and please comment or contact me if you like the script or have any questions/suggestions for future improvements. Thanks!
I will continue to work on this indicator, so please share your experience and feedback with me so that I can continuously improve it. Thanks to everyone that have contacted me regarding my scripts. Your feedback is valuable for future developments!
ACCESS THE INDICATOR
• Contact me on TradingView or use the links below
-----------------
Disclaimer
Copyright by Zeiierman.
The information contained in my scripts/indicators/ideas does not constitute financial advice or a solicitation to buy or sell any securities of any type. I will not accept liability for any loss or damage, including without limitation any loss of profit, which may arise directly or indirectly from use of or reliance on such information.
All investments involve risk, and the past performance of a security, industry, sector, market, financial product, trading strategy, or individual’s trading does not guarantee future results or returns. Investors are fully responsible for any investment decisions they make. Such decisions should be based solely on an evaluation of their financial circumstances, investment objectives, risk tolerance, and liquidity needs.
My scripts/indicators/ideas are only for educational purposes!

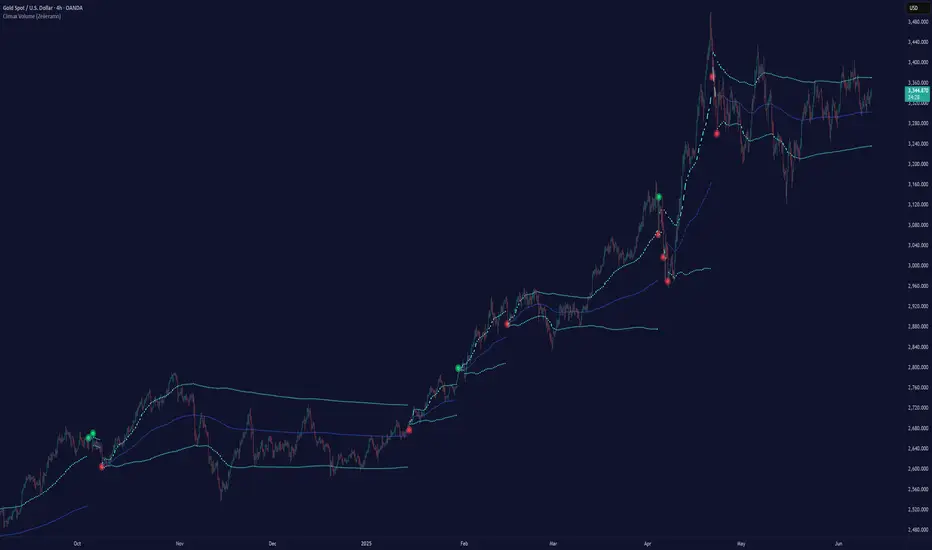
Climax Volume (Zeiierman)█ Overview
Climax Volume (Zeiierman) isolates extreme participation events to pinpoint when price action reaches exhaustion. These moments of volume climax often precede reversals, pauses, or key balance shifts, offering traders an early read on changing market dynamics. Instead of treating volume as a passive tally, it locates climax bars, abnormally large activity bursts, and anchors a Point of Control (PoC) that tracks where post-climax transactions concentrate. The result is a clear read on when participation is peaking, where value re-centers afterward, and how far price can reasonably deviate before reverting.
This tool is designed for multi-context use, such as intraday execution, swing confirmation, or structural bias analysis, offering a precise view of where volume matters, not just how much.
⚪ Why This One Is Unique
Unlike conventional volume-spike indicators, Climax Volume (Zeiierman) integrates adaptive extremum detection, a dynamic PoC core, and multi-layer deviation envelopes that evolve in real time with market context.
Internally, it fuses bid–ask volume delta modeling with re-normalized dispersion mapping to measure the directional imbalance driving each climax event. The system continuously evaluates delta asymmetry between buying and selling pressure to refine the detection of true participation extremes. This allows the engine to differentiate between constructive volume expansion (trend continuation) and exhaustive volume spikes (potential reversals).
█ Main Features
⚪ Climax Volume
The Climax Volume Engine isolates statistically significant bursts in participation that indicate potential turning points or exhaustion phases. It identifies climax bars—instances where volume reaches regime-level extremes relative to recent activity—and classifies them as bullish (green) or bearish (red) based on directional dominance. These events highlight where aggressive activity peaks and often mark the start of structural imbalance, providing early cues for reversal, absorption, or renewed continuation.
⚪ Point of Control (PoC)
Each climax event dynamically re-anchors a Point of Control (PoC)—the evolving price center of post-climax volume distribution. The PoC tracks where transaction density stabilizes after an extreme burst, forming the reference core of a control zone. From this anchor, the system projects upper and lower tolerance bands to define acceptable deviation ranges, contextualizing how far the price can travel before reverting or rebalancing.
█ How to Use
⚪ Trend Following
Use the Volume Point of Control (PoC) as a dynamic guide to assess directional bias. The PoC effectively acts as a moving equilibrium line, continuously updating to reflect where trading volume and market influence are concentrated.
When price holds above the PoC, it signals sustained bullish sentiment and active accumulation.
When the price remains below, it confirms bearish control and ongoing distribution.
⚪ Trend Continuation Retests
The slope of the PoC reflects the strength and persistence of market momentum. The steeper the PoC slope, the stronger the active momentum. A flat or neutral PoC typically signals consolidation or low conviction — conditions better avoided for trend trades.
In a bullish scenario , watch for the price to retest the PoC or the lower tolerance band after a pullback. A successful rejection of that zone often signals that buyers are defending control, providing a high-probability continuation entry.
In a bearish scenario , when the PoC slopes downward, wait for the price to retest it from below. If the market fails to reclaim that level, it indicates that sellers remain dominant, and downside momentum is likely to continue.
⚪ Reversals
Climax Points — the color-coded circles that appear during moments of extreme volume. These signals indicate that the market may soon pause, reverse, or rotate back toward the PoC equilibrium.
🟢 Bullish Climax Points emerge when heavy buying reaches unsustainable levels, often signaling a buyer exhaustion event or a possible local top formation.
🔴 Bearish Climax Points form during high-intensity selling bursts, warning of seller exhaustion and potential bottoming conditions.
⚪ Confirm Breakouts
High-volume breakouts confirmed by Climax Volume signals often mark the initiation of strong directional moves. When climax confirmation aligns with a structural break, it validates that the breakout is backed by genuine participation — not just thin volatility spikes — increasing the probability of follow-through and trend expansion.
Identify a key support or resistance zone manually or with your preferred structural tool.
Wait for a climax signal to coincide with a break beyond that level.
For bullish breakouts , a green climax point appearing as price pushes above resistance confirms that buyers are stepping in with conviction.
For bearish breakouts , a red climax point forming as price drops through support indicates that real selling pressure is driving the move.
█ How It Works
⚪ Climax Detection
Identifies participation surges within a dynamic volume–price field to isolate genuine activity extremes rather than simple bar-size anomalies.
Calculation: Utilizes adaptive extremum detection on a re-normalized volume–delta composite with regime-sensitive thresholds and variance filters to extract statistically valid climax events.
⚪ Point of Control (PoC)
Defines the evolving price centroid where post-climax transactions cluster, continuously adapting to shifting participation density.
Calculation: Employs a volume-weighted delta balance framework with incremental accumulation and curvature-preserving smoothing, ensuring stability while maintaining local reactivity to order-flow asymmetry.
⚪ Tolerance Bands
Outlines a probabilistic corridor around the PoC that distinguishes expected fluctuation from meaningful deviation.
Calculation: Implements variance-aware dispersion modeling with contextual weighting derived from real-time delta gradients, projecting symmetric envelopes scaled by adaptive multipliers.
-----------------
Disclaimer
The content provided in my scripts, indicators, ideas, algorithms, and systems is for educational and informational purposes only. It does not constitute financial advice, investment recommendations, or a solicitation to buy or sell any financial instruments. I will not accept liability for any loss or damage, including without limitation any loss of profit, which may arise directly or indirectly from the use of or reliance on such information.
All investments involve risk, and the past performance of a security, industry, sector, market, financial product, trading strategy, backtest, or individual's trading does not guarantee future results or returns. Investors are fully responsible for any investment decisions they make. Such decisions should be based solely on an evaluation of their financial circumstances, investment objectives, risk tolerance, and liquidity needs.
Bezahltes Script