Fixed $200 Risk Futures Position Sizer (2R Target)This indicator is designed for traders who want to follow a strict, professional-style risk model identical to the rules used in funded futures trading programs. Instead of risking a percentage of the account, the indicator always risks a fixed $200 per trade, regardless of contract or market volatility. This allows traders to simulate evaluation accounts and maintain perfect risk discipline.
The tool works across a wide range of futures markets — including micro, mini, and continuous contracts (MES, MNQ, MNQ1!, MYM, M2K, MCL, MGC, ES1!, NQ1!, GC1!) — and automatically loads the correct tick size and tick value for each contract. This ensures that stop distance and risk calculations are always accurate, even when switching between index futures, metals, or energy markets.
You simply enter your Entry Price and Stop Loss Price, and the indicator calculates:
The stop distance in points and ticks
The exact dollar risk per contract
The maximum number of contracts allowed while staying under a fixed $200 risk
A fully automated 2R take-profit target (equivalent to $400 profit per trade)
Expected profit per contract
Total projected profit based on allowed size
Full long/short direction detection
This makes position sizing effortless and completely rule-based. If the chosen stop-loss distance requires more than $200 of risk per contract, the indicator will automatically show 0 contracts allowed, preventing invalid trades and helping maintain consistency.
For clarity and execution, the indicator also plots:
A green Entry Line
A red Stop-Loss Line
A blue 2R Take-Profit Line
This produces a visual, easy-to-understand risk-to-reward layout directly on the chart.
This tool is ideal for traders preparing for funded account challenges, traders practicing mechanical risk systems, or anyone who wants to enforce a strict, repeatable risk framework. It eliminates guesswork, improves consistency, and helps traders build discipline by sizing every trade according to a fixed dollar risk with a precise 2R reward objective.
Volumen

9 EMA Retracement Buy/Sell + Volume FilterFor all you scalpers out there this is a 9 ema scalp Indicator coupled with volume bars, the Indicator plots buy and sell when the conditions are met
Price mist be above or below the 9 ema it must retrace and the volume bar must match the direction of the candle and then a signal will be printed with a red or green triangle, do not blindly take all trades on the signals make sure the is a trend works on any asset and remember it is for scalping only

Volume Heikin Ashi by CrugThis indicator combines the Heikin Ashi with classic volume candles.
It is useful to see the trend and "how much" volume it contains
1 - Select Volume Candles on the graph
i.postimg.cc
2- In setting remove the all the colors
i.postimg.cc
3- Insert the indicator
4- Using with momentum indicators (like Market liberator B, MACD, ...) it provides more precise and realistic data to plot divergences because it combines: classic japanese candle but with volumes. In the meantime it is easier to see the main trend
i.postimg.cc
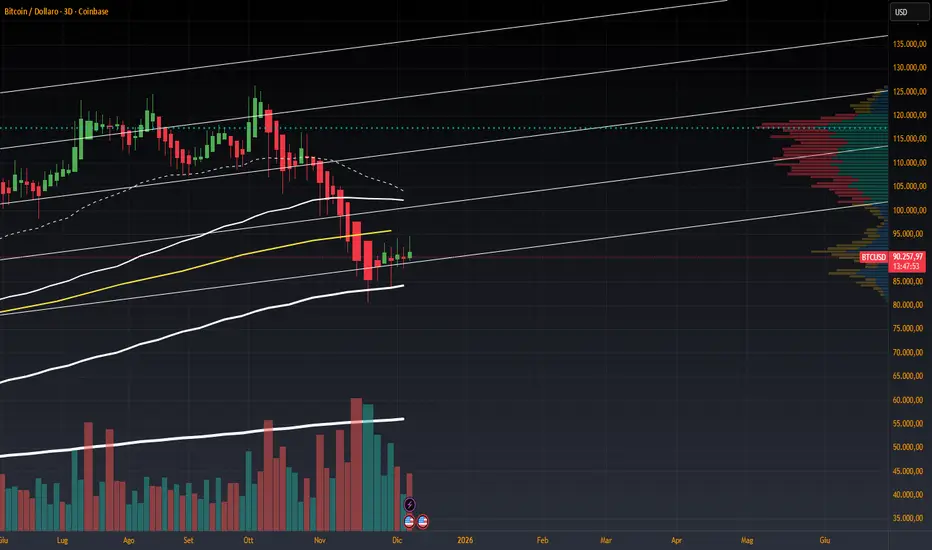
Multi-Distribution Volume Profile (Zeiierman)█ Overview
Multi-Distribution Volume Profile (Zeiierman) is a flexible, structure-first volume profile tool that lets you reshape how volume is distributed across price, from classic uniform profiles to advanced statistical curves like Gaussian, Lognormal, Student-t, and more.
Instead of forcing every market into a single "one-size-fits-all" profile, this tool lets you model how volume is likely concentrated inside each bar (body vs wicks, midpoint, tails, center bias, right-skew, heavy tails, etc.) and then stacks that behavior across a whole lookback window to build a rich, multi-distribution map of traded activity.
On top of that, it overlays a dynamic Center Band (value area) and a fade/gradient model that can color each price row by volume, hits, recency, volatility, reversals, or even liquidity voids, turning a plain profile into a multi-dimensional context map.
Highlights
Choose from multiple Profile Build Modes , including uniform, body-only, wick-only, midpoint/close/open, center-weighted, and a suite of probability-style distributions (Gaussian, Lognormal, Weibull, Student-t, etc.)
Flexible anchor layout: draw the profile on Right/Left (horizontal) or Bottom/Top (vertical) to fit any chart layout
Value Area / Center Band computed from volume quantiles around the POC.
Gradient-based Fade Metrics: volume, price hits, freshness (time decay), volatility impact, dwell time, reversal density, compression, and liquidity voids
Separate bullish vs bearish volume at each price row for directional structure insights
█ How It Works
⚪ Profile Construction
The script scans a user-defined Bars Included window and finds the full high–low span of that zone. It then divides this range into a user-controlled number of Price Levels (rows).
For each historical bar within the window:
It measures the candle’s price range, body, and wicks.
It assigns volume to rows according to the selected Profile Build Mode, for example:
* Range Uniform – volume spread evenly across the full high–low range.
* Range Body Only / Range Wick Only – concentrate volume inside the body or wicks only.
* Midpoint / Close / Open Only – allocate volume entirely into one price row (pinpoint modeling).
HL2 / Body Center Weighted – center weights around the middle of the range/body.
Recent-Weighted Volume – amplify newer bars using exponential time decay.
Volume Squared (Hard) – aggressively boost bars with large volume.
Up Bars Only / Down Bars Only – filter volume to only bullish or bearish bars.
For more advanced shapes, the script uses continuous distributions across the bar’s span:
Linear, Triangular, Exponential to High
Cosine Centered, PERT
Gaussian, Lognormal, Cauchy, Laplace
Pareto, Weibull, Logistic, Gumbel
Gamma, Beta, Chi-Square, Student-t, F-Shape
Each distribution produces a weight for each row within the bar’s range, normalized so the total volume remains consistent, but the shape of where that volume lands changes.
⚪ POC & Center Band (Value Area)
Once all rows are accumulated:
The row with the highest total volume becomes the Point of Control (POC)
The script computes cumulative volume and finds the band that wraps a user-defined Center of Profile % (e.g., 68%) around the center of distribution.
This range is displayed as a central band, often treated like a value area where price has spent the most “effort” trading.
⚪ Gradient Fade Engine
Each row also gets a fade metric, chosen in Fade Metric:
Volume – opacity based on relative volume.
Price Hits – how frequently that row was touched.
Blended (Vol+Hits) – average of volume & hits.
Freshness – emphasizes recent activity, controlled by Decay.
Volatility Impact – rows that saw larger ranges contribute more.
Dwell Time – where price “camped” the longest.
Reversal Density – where direction changes cluster.
Compression – tight-range compression zones.
Liquidity Void – inverse of volume (thin liquidity zones).
When Apply Gradient is enabled, the row’s bullish/bearish colors are tinted from faint to strong based on this chosen metric, effectively turning the profile into a heatmap of your chosen structural property.
█ How to Use
⚪ Explore Different Distribution Assumptions
Switch between multiple Profile Build Modes to see how your assumptions about intrabar volume affect structure:
Use Range Uniform for classical profile reading.
Deploy Gaussian, Logistic, or Cosine shapes to emphasize central clustering.
Try Pareto, Lognormal, or F-Shape to focus on tail / extremal activity.
Use Recent-Weighted Volume to prioritize the most recent structural behavior.
This is especially useful for traders who want to test how different modeling assumptions change perceived value areas and levels of interest.
⚪ Identify Value, Acceptance & Rejection Zones
Use the POC and Center of Profile (%) band to distinguish:
High-acceptance zones – wide central band, thick rows, strong gradient → fair value areas
Rejection zones & tails – thin extremes, low dwell time, high volatility or reversal density
These regions can be used as:
Targets and origin zones for mean reversion
Context for breakout validation (leaving value)
Bias reference for intraday rotations or swing rotations
⚪ Read Directional Structure Within the Profile
Because each row is split into bullish vs bearish contributions, you can visually read:
Where buyers dominated a price region (large bullish slice)
Where sellers absorbed or defended (large bearish slice)
Combining this with Fade Metrics like Reversal Density, Dwell Time, or Freshness turns the profile into a structural order-flow map, without needing raw tick-by-tick volume data.
⚪ Use Fade Metrics for Contextual Heatmaps
Each Fade Metric can be used for a different analytical lens:
Volume / Blended – emphasize where volume and activity are concentrated.
Freshness – highlight the most recently active zones that still matter.
Volatility Impact & Compression – spot areas of explosive moves vs coiled ranges.
Reversal Density – locate micro turning points and battle zones.
Liquidity Void – visually pop out thin regions that may act as speedways or magnets.
█ Settings
Profile Build Mode – Selects how each bar’s volume is distributed across its price range (uniform, body/wick, midpoint/close/open, center-weighted, or statistical distribution families).
Bars Included – Number of bars used to build the profile from the current bar backward.
Price Levels – Vertical resolution of the profile: more levels = smoother but heavier.
Anchor Side – Where the profile is drawn on the chart: Right, Left, Bottom, or Top.
Offset (bars) – Horizontal offset from the last bar to the profile when using Right/Left modes.
Apply Gradient – Toggles the fade/heatmap coloring based on the selected metric.
Fade Metric – Chooses the property driving row opacity (Volume, Hits, Freshness, Volatility Impact, Dwell Time, Reversal Density, Compression, Liquidity Void).
Decay – Time-decay factor for Freshness (values close to 1 keep older activity relevant for longer).
Profile Thickness – Relative thickness of the profile along the time axis, as a % of the lookback window.
Center of Profile (%) – Volume percentage used to define the central band (value area) around the POC.
-----------------
Disclaimer
The content provided in my scripts, indicators, ideas, algorithms, and systems is for educational and informational purposes only. It does not constitute financial advice, investment recommendations, or a solicitation to buy or sell any financial instruments. I will not accept liability for any loss or damage, including without limitation any loss of profit, which may arise directly or indirectly from the use of or reliance on such information.
All investments involve risk, and the past performance of a security, industry, sector, market, financial product, trading strategy, backtest, or individual's trading does not guarantee future results or returns. Investors are fully responsible for any investment decisions they make. Such decisions should be based solely on an evaluation of their financial circumstances, investment objectives, risk tolerance, and liquidity needs.

EMA 9/18/50 Crossover Alert By PRIGood for equity. When this crossover happen you may go long with sl keeping low of previous candle. Cautios in sideways market.

5MA+TrendMagic + Disparity + Volume Spikes5MA + TrendMagic + Disparity Scalping + Volume Spikes is an all-in-one trend and momentum indicator designed for fast entries, trend confirmation, and volatility detection.
Main Features
Multiple EMAs (9/21/50/100/200) for trend structure
TrendMagic for dynamic trend direction and stop levels
Ultra Fast Disparity Scalper (EMA disparity + RSI + RVI momentum)
Volume Spike Detection with smart filters (valid highs/lows, candle types, color match, session filter)
Gold Volatility Signals using ATR, Bollinger Bands, HV/RV spread
Clear BUY/SELL markers, overheat filters, and full alert support
This tool helps identify early reversals, confirm major trends, and highlight strong volume-driven turning points.

TedAlpha – Structure / FVG / OB Sessions:
Only looks for trades when price is inside your defined London or NY time blocks.
CHOCH:
Uses pivots to track swing highs/lows, then flags a bullish CHOCH when structure flips from LL/LH to HH/HL, and vice versa for bearish.
FVG:
Detects 3-candle imbalance and keeps the zone “active” for fvgLookback bars, then checks if price trades back into it.
Order Blocks:
On a CHOCH, grabs the last opposite candle (bearish before bull CHOCH = bullish OB, bullish before bear CHOCH = bearish OB) and marks its body as the OB zone.
Signal:
A valid long = bull CHOCH + in session + (price inside bullish FVG and/or bullish OB, depending on toggles).
Short is the mirror image.
RR 1:3:
SL uses the last swing low (for longs) or last swing high (for shorts), TP is auto-set at 3× that distance and plotted as lines.


VCAI Volume & Liquidity Map LiteVCAI Volume & Liquidity Map Lite visualises recent market participation using a horizontal liquidity/volume histogram plotted beside current price.
It shows where trading activity has clustered, where the chart is thin, and how much of that activity came from buying vs selling pressure.
This Lite edition keeps the tool simple and fast:
Yellow = buy-side volume (aggressive buyers / upward pressure)
Purple = sell-side volume (aggressive sellers / downward pressure)
Thicker sections = higher traded volume at that price
POC line (purple) marks the price with the highest volume concentration
Value Area lines (yellow dashed) mark where ~70% of volume has traded
Bars extend outward to the right of price for a clean, unobstructed chart
Lookback setting controls how many candles the map is built from
Use it to quickly identify:
high-interest price zones
low-liquidity areas where price can move fast
likely reaction levels
where momentum may slow, reverse, or break through
Designed as a lightweight, open-source tool for anyone wanting a clean liquidity/volume map without complex settings.
Part of the VCAI Lite Series.

VCAI Volume LiteVCAI Volume Lite is a clean, modern take on volume analysis designed for traders who want a clearer read on participation without loading multiple indicators.
This Lite edition focuses on the essentials:
real activity vs dead sessions
expansion vs contraction
momentum shifts around breakouts and pullbacks
No hype, no filters, no hidden logic — just a straightforward volume tool rebuilt with the VCAI visual framework.
Use it to quickly spot:
stronger moves backed by genuine participation
weak pushes running on low volume
areas where momentum may stall or accelerate
Part of the VCAI Lite Series.

Smart Scalper V7 [Churn Filter]Indicator uses relative volume by time as well as ADX to highlight if volume is high to prevent trading in chop or being faked out.
Dec 1
Release Notes
How to Read the "Traffic Light" 🚦
You asked: "How do I work out if volume is higher or lower?" Look at the White Horizontal Line running across the indicator.
Height (Quantity):
Above the Line: Volume is High (The crowd is here).
Below the Line: Volume is Low (Everyone is at lunch).
Color (Quality):
🟢 Green: High Volume + Strong Trend. (Best for Entries).
🟡 Yellow: High Volume but NO Trend. This is usually a Reversal or a Trap. (Big fight, no winner yet).
🟠 Orange: Trending, but on Low Volume. The price is drifting. Don't trust it—it can snap back easily.
🔴 Red: Low Volume, No Trend. The "Kill Zone." Do not trade.

Fair Value Gap Signals [Kodexius]Fair Value Gap Signals is an advanced market structure tool that automatically detects and tracks Fair Value Gaps (FVGs), evaluates the quality of each gap, and highlights high value reaction zones with visual metrics and signal markers.
The script is designed for traders who focus on liquidity concepts, order flow and mean reversion. It goes beyond basic FVG plotting by continuously monitoring how price interacts with each gap and by quantifying three key aspects of each zone:
-Entry velocity inside the gap
-Volume absorption during tests
-Structural integrity and depth of penetration
The result is a dynamic, information rich visualization of which gaps are being respected, which are being absorbed, and where potential reversals or continuations are most likely to occur.
All visual elements are configurable, including the maximum number of visible gaps per direction, mitigation method (close or wick) and an ATR based filter to ignore insignificant gaps in low volatility environments.
🔹 Features
🔸 Automated Fair Value Gap Detection
The script detects both bullish and bearish FVGs based on classic three candle logic:
Bullish FVG: current low is strictly above the high from two bars ago
Bearish FVG: current high is strictly below the low from two bars ago
🔸 ATR Based Gap Filter
To avoid clutter and low quality signals, the script can ignore very small gaps using an ATR based filter.
🔸Per Gap State Machine and Lifecycle
Each gap is tracked with an internal status:
Fresh: gap has just formed and has not been tested
Testing: price is currently trading inside the gap
Tested: gap was tested and left, waiting for a potential new test
Rejected: price entered the gap and then rejected away from it
Filled: gap is considered fully mitigated and no longer active
This state machine allows the script to distinguish between simple touches, multiple tests and meaningful reversals, and to trigger different alerts accordingly.
🔸 Visual Ranking of Gaps by Metrics
For each active gap, three additional horizontal rank bars are drawn on top of the gap area:
Rank 1 (Vel): maximum entry velocity inside the gap
Rank 2 (Vol): relative test volume compared to average volume
Rank 3 (Dpt): remaining safety of the gap based on maximum penetration depth
These rank bars extend horizontally from the creation bar, and their length is a visual score between 0 and 1, scaled to the age of the gap. Longer bars represent stronger or more favorable conditions.
🔸Signals and Rejection Markers
When a gap shows signs of rejection (price enters the gap and then closes away from it with sufficient activity), the script can print a signal label at the reaction point. These markers summarize the internal metrics of the gap using a tooltip:
-Velocity percentage
-Volume percentage
-Safety score
-Number of tests
🔸 Flexible Mitigation Logic (Close or Wick)
You can choose how mitigation is defined via the Mitigation Method input:
Close: the gap is considered filled only when the closing price crosses the gap boundary
Wick: a full fill is detected as soon as any wick crosses the gap boundary
🔸 Alert Conditions
-New FVG formed
-Price entering a gap (testing)
-Gap fully filled and invalidated
-Rejection signal generated
🔹Calculations
This section summarizes the main calculations used under the hood. Only the core logic is covered.
1. ATR Filter and Gap Size
The script uses a configurable ATR length to filter out small gaps. First the ATR is computed:
float atrVal = ta.atr(atrLength)
Gap size for both directions is then measured:
float gapSizeBull = low - high
float gapSizeBear = low - high
If useAtrFilter is enabled, gaps smaller than atrVal are ignored. This ties the minimum gap size to the current volatility regime.
2. Fair Value Gap Detection
The basic FVG conditions use a three bar structure:
bool fvgBull = low > high
bool fvgBear = high < low
For bullish gaps the script stores:
-top as low of the current bar
-bottom as high
For bearish gaps:
-top as high of the current bar
-bottom as low
This defines the price range that is considered the imbalance area.
3. Depth and Safety Score
Depth measures how far price has penetrated into the gap since its creation. For each bar, the script computes a currentDepth and updates the maximum depth:
float currentDepth = 0.0
if g.isBullish
if l < g.top
currentDepth := g.top - l
else
if h > g.bottom
currentDepth := h - g.bottom
if currentDepth > g.maxDepth
g.maxDepth := currentDepth
The safety score expresses how much of the gap remains intact:
float depthRatio = g.maxDepth / gapSize
float safetyScore = math.max(0.0, 1.0 - depthRatio)
safetyScore near 1: gap is mostly untouched
safetyScore near 0: gap is mostly or fully filled
4. Velocity Metric
Velocity captures how aggressively price moves inside the gap. It is based on the body to range ratio of each bar that trades within the gap and rewards bars that move in the same direction as the gap:
float barRange = h - l
float bodyRatio = math.abs(close - open) / barRange
float directionBonus = 0.0
if g.isBullish and close > open
directionBonus := 0.2
else if not g.isBullish and close < open
directionBonus := 0.2
float currentVelocity = math.min(bodyRatio + directionBonus, 1.0)
The gap keeps track of the strongest observed value:
if currentVelocity > g.maxVelocity
g.maxVelocity := currentVelocity
This maximum is later used as velScore when building the velocity rank bar.
5. Volume Accumulation and Volume Score
While price is trading inside a gap, the script accumulates the traded volume:
if isInside
g.testVolume += volume
It also keeps track of the number of tests and the volume at the start of the first test:
if g.status == "Fresh"
g.status := "Testing"
g.testCount := 1
g.testStartVolume := volume
An average volume is computed using a 20 period SMA:
float volAvg = ta.sma(volume, 20)
The expected volume is approximated as:
float expectedVol = volAvg * math.max(1, (bar_index - g.index) / 2)
The volume score is then:
float volScore = math.min(g.testVolume / expectedVol, 1.0)
This produces a normalized 0 to 1 metric that shows whether the gap has attracted more or less volume than expected over its lifetime.
6. Rank Bar Scaling
All three scores are projected visually along the time axis as horizontal bars. The script uses the age of the gap in bars as the maximum width:
float maxWidth = math.max(bar_index - g.index, 1)
Then each metric is mapped to a bar length:
int len1 = int(math.max(1, maxWidth * velScore))
g.rankBox1.set_right(g.index + len1)
int len2 = int(math.max(1, maxWidth * volScore))
g.rankBox2.set_right(g.index + len2)
int len3 = int(math.max(1, maxWidth * safetyScore))
g.rankBox3.set_right(g.index + len3)
This creates an intuitive visual representation where stronger metrics produce longer rank bars, making it easy to quickly compare the relative quality of multiple FVGs on the chart.

Advanced Confluence DashboardAdvanced Confluence Dashboard - Multi-Indicator Technical Analysis Tool
OVERVIEW
The Advanced Confluence Dashboard is a comprehensive technical analysis tool designed to help traders identify high-probability trade setups by tracking multiple technical indicators simultaneously. The indicator displays up to 13 different technical confluences in an easy-to-read dashboard format, providing both individual signals and an overall market bias percentage. Switch between full table view and condensed view for maximum chart flexibility.
FEATURES
- 13 Technical Confluences: RSI, VWAP, EMA Cross (9/21), MACD, Stochastic, Trend (50 EMA), Bollinger Bands, ADX Strength, Price Momentum, Volume Breakout, VWAP Bands, 200 EMA, and Price Action (Higher Highs/Lower Lows)
- Real-time Confluence Scoring: Automatically calculates bullish vs bearish signal strength
- Multi-Timeframe Support: Analyze indicators on any timeframe while viewing your chart on another
- Customizable Display: Toggle individual indicators on/off, adjust table position, size, and transparency
- ATR Information: Optional ATR display for volatility-based position sizing
- Condensed View Mode: Ultra-minimal display showing only confluence score and ATR (perfect for scalpers who want maximum chart visibility)
- Full Table View: Detailed breakdown of each indicator's value and signal
- Color-Coded Signals: Green (bullish), red (bearish), white (neutral) for instant visual clarity
HOW IT WORKS
The indicator evaluates each enabled technical indicator and assigns it either a bullish or bearish signal based on its current state. The confluence score shows how many indicators are aligned in each direction, giving you a clear percentage-based view of market bias. For example, if 8 out of 13 indicators are bullish, you'll see a 62% LONG BIAS signal.
DISPLAY MODES
Full View: Shows all enabled indicators with their current values and signals in a detailed table format. Perfect for understanding exactly which indicators are bullish or bearish and why.
Condensed View: Shows only the confluence score (e.g., "4/13 LONG | 9/13 SHORT - SHORT BIAS 69%") and optional ATR information. This minimal display keeps your chart clean while still providing the essential confluence data you need for quick trading decisions. Ideal for scalpers and traders who want maximum chart space.
CONFLUENCES EXPLAINED
- RSI: Momentum oscillator (>50 bullish, <50 bearish, shows overbought/oversold)
- VWAP: Volume-weighted average price (above = bullish, below = bearish)
- EMA Cross: Fast EMA (9) vs Slow EMA (21) with price position
- MACD: Trend-following momentum (line above signal = bullish)
- Stochastic: Momentum oscillator (>50 bullish, <50 bearish)
- Trend (50 EMA): Price position relative to 50-period EMA
- Bollinger Bands: Volatility and mean reversion (above middle = bullish)
- ADX Strength: Trend strength indicator (shows strong trends)
- Price Momentum: Rate of price change over specified period
- Volume Breakout: Detects unusual volume with directional bias
- VWAP Bands: Standard deviation bands around VWAP
- 200 EMA: Long-term trend indicator
- Price Action: Higher Highs and Lower Lows pattern detection
SETTINGS
Timeframe Settings:
- Indicator Timeframe: Analyze indicators on a different timeframe than your chart
Display Options:
- Condensed View: Toggle between full table and minimal display
- Show ATR Info: Display/hide ATR information
- Table Position: 9 positions (top/middle/bottom + left/center/right)
- Text Size: Auto, tiny, small, normal, large, huge
- Table Transparency: 0-100%
- Border Width: 1-5 pixels
Confluence Toggles:
- Enable/disable any of the 13 confluences individually
- Confluence score automatically adjusts based on enabled indicators
Indicator Settings:
- RSI Length (default: 14)
- ATR Length (default: 14)
- Fast/Slow EMA (default: 9/21)
- Trend EMA (default: 50)
- Volume SMA Length (default: 20)
- Volume Breakout Multiplier (default: 2.0x)
- Bollinger Bands Length/StdDev (default: 20/2.0)
- ADX Length (default: 14)
- ADX Strength Threshold (default: 25)
- Momentum Length (default: 10)
IDEAL USE CASES
- Scalping: Quick identification of confluence for fast entries/exits - use condensed view for clean charts
- Day Trading: Multi-timeframe analysis for intraday setups
- Swing Trading: Confirmation of longer-term bias
- Risk Management: Higher confluence = higher probability trades
- Trade Filtering: Only take trades when confluence reaches your threshold
- Multi-Monitor Setups: Use condensed view on execution charts, full view on analysis charts
HOW TO USE
1. Add the indicator to your chart
2. Toggle on/off the confluences you prefer to use
3. Choose between Full View (detailed) or Condensed View (minimal)
4. Adjust the table position and size to your preference
5. Look for high confluence percentages (70%+ is strong bias)
6. Use the individual indicator signals (full view) to understand market structure
7. Combine with your trading strategy for entry/exit confirmation
TIPS
- Use Condensed View when scalping to keep your chart clean and uncluttered
- Switch to Full View when you need to analyze which specific indicators are conflicting
- Higher confluence doesn't guarantee success - always use proper risk management
- Consider using 60%+ confluence as a minimum threshold for trades
- Pay attention to which specific indicators are aligned vs conflicting
- Use the ATR display for quick reference on position sizing
- Experiment with different timeframes to find what works for your style
- Disable indicators you don't use to simplify your confluence scoring
DISCLAIMER
This indicator is for educational and informational purposes only. It does not constitute financial advice, investment advice, trading advice, or any other type of advice. Trading and investing in financial markets involves substantial risk of loss and is not suitable for every investor. Past performance is not indicative of future results. Always do your own research and consult with a qualified financial advisor before making any investment decisions.

Premarket&Regular Session VolumeThis script provides a clean and practical overview of premarket cumulative volume compared with regular session volume, helping traders instantly identify unusual early-session liquidity.
Features
Tracks total premarket volume from 4:00–9:30 ET
Shows cumulative premarket buildup as a smooth line
Helps detect early liquidity spikes that often lead to halts, gap-ups or momentum runs
Designed for intraday scalpers and small-cap/momentum traders
Why It’s Useful
Premarket activity frequently reveals hidden demand long before the opening bell.
When premarket volume significantly exceeds average daily levels, the probability of early spikes, volatility events, or continuation moves increases.
This indicator offers a simple but powerful visual tool for evaluating market interest before the open and comparing it with regular session volume

ueuito Trend Strength LSMA-BasedAnother experience.... still improving
Indicator Description (English)
Name: Trend Strength LSMA-Based
Overview:
This indicator is designed to measure the strength and exhaustion of a trend based on the Least Squares Moving Average (LSMA). It combines price, trend slope, volume, and volatility to calculate a trend exhaustion score, which is then smoothed and visualized as a colored area on the chart. The indicator also plots discrete points to signal potential reversals or decreases in trend intensity.
Key Features:
LSMA-Based Trend Strength:
Calculates a Least Squares Moving Average (LSMA) of the selected timeframe.
Measures the slope of the LSMA to capture trend direction and momentum.
Trend Exhaustion Score:
Combines multiple factors:
Distance between price and LSMA
LSMA slope (trend strength)
Volume relative to its moving average
ATR-based volatility
Each factor is weighted according to user-defined inputs.
The combined score is multiplied to produce a scaled trend exhaustion value.
Smoothed Area Plot:
The trend exhaustion score is smoothed using an EMA to reduce noise.
Displayed as a colored area that changes based on trend strength:
Strong bullish exhaustion → dark green
Weak bullish exhaustion → light green
Strong bearish exhaustion → dark red
Weak bearish exhaustion → light red
Neutral → gray
Dynamic Visual Cues:
Points for reversals: small green/red circles appear when the trend changes direction.
Points for intensity decrease: small green/red circles appear when the trend weakens but has not yet reversed.
The area’s color intensity dynamically reflects the strength of the trend exhaustion, making it visually intuitive.
Multi-Timeframe Support:
The indicator can calculate the trend exhaustion based on a different timeframe from the chart, allowing for higher timeframe trend analysis on lower timeframe charts.
Customizable Settings:
LSMA period, smoothing length, volume period, ATR period
Weighting for each factor in the score calculation
Thresholds for weak/strong exhaustion
Timeframe selection
Usage:
Identify when a trend is losing strength or approaching a potential reversal.
Helps visualize the current momentum and exhaustion of bullish or bearish trends.
Can be used in conjunction with other technical tools for confirming entries or exits.
Important Note:
Depending on the asset, market volatility, and timeframe, it may be necessary to adjust the indicator settings to optimize its responsiveness and accuracy. The default parameters provide a general starting point but fine-tuning is recommended for best results.

Rolling Volume Profile [Matrix Volume Heatmap] by NXT2017Description
This indicator offers a unique visual approach to Volume Profile analysis. Instead of the traditional histogram bars or boxes, this script renders a Rolling Volume Profile as a background "Matrix Heatmap" directly on your chart.
By dividing the price action of the most recent N-candles into 30 horizontal zones (buckets), it visualizes where the most trading activity has occurred within your defined lookback period. The visualization uses dynamic transparency to highlight the Point of Control (POC) and high-volume nodes, while fading out low-volume areas.
🧠 How it Works
The script operates on a "Rolling Window" basis, meaning it recalculates the profile at every bar to reflect the immediate market context.
Dynamic Range: It calculates the highest High and lowest Low of the user-defined Lookback Length (default: 1000 bars).
Bucket Slicing: This vertical range is divided into 30 equal price buckets.
Volume Distribution (Overlap Logic): The script iterates through the historical data. If a candle is large and spans multiple buckets, its volume is distributed proportionally across those buckets. This ensures a more realistic profile compared to simply assigning volume to the close price.
Heatmap Visualization:
The script calculates the Maximum Volume (POC) within the profile.
It uses a Reference Length to normalize this maximum.
Dynamic Opacity: Zones with volume close to the maximum are rendered opaque (solid). Zones with low relative volume become highly transparent. This creates an automatic "Heatmap" effect, allowing you to instantly spot the most significant price levels.
⚙️ Settings
Lookback Length (candles): Defines how far back the profile calculates volume (e.g., 1000 bars).
POC Reference Length: Defines the smoothing window for the 100% volume baseline. Increasing this stabilizes the color changes; decreasing it makes the heatmap more reactive to sudden volume spikes.
Profil Color: Choose the base color for the matrix. The transparency is calculated automatically.
💡 Use Case
This tool is ideal for traders who want to see the "Value Area" of the current range without cluttering the chart with complex boxes or side-bars. It works excellent as a background context tool to identify:
High Volume Nodes (Support/Resistance)
Low Volume Nodes (Price gaps/Rejection areas)
Migrating Points of Control (Trend direction)

Volume Profile VisionVolume Profile Vision - Complete Description
Overview
Volume Profile Vision (VPV) is an advanced volume profile indicator that visualizes where trading activity has occurred at different price levels over a specified time period. Unlike traditional volume indicators that show volume over time, this indicator displays volume distribution across price levels, helping traders identify key support/resistance zones, fair value areas, and potential reversal points.
What Makes This Indicator Original
Volume Profile Vision introduces several unique features not found in standard volume profile tools:
Dual-Direction Histogram Display:
Unlike conventional volume profiles that only show bars extending in one direction, VPV displays volume bars extending both left (into historical candles) and right (as a traditional histogram). This bi-directional approach allows traders to see exactly where historical price action intersected with high-volume nodes.
Real-Time Candle Highlighting: The indicator dynamically highlights volume bars that intersect with the current candle's price range, making it immediately obvious which volume levels are currently in play.
Four Professional Color Schemes: Each color scheme uses distinct gradient algorithms and visual encoding systems:
Traffic Light: Uses red (POC), green (VA boundaries), yellow (HVN), with grayscale gradients outside the value area
Aurora Glass: Modern cyan-to-magenta gradient with hot magenta POC highlighting
Obsidian Precision: Professional dark theme with white POC and electric cyan accents
Black Ice: Monochromatic cyan family with graduated intensity
Adaptive Transparency System: Automatically adjusts bar transparency based on position relative to value area, with special handling for each color scheme to maintain visual clarity.
Core Concepts & Calculations
Volume Distribution Analysis
The indicator divides the visible price range into user-defined price levels (default: 80 levels) and calculates the total volume traded at each level by:
Scanning back through the specified lookback period (customizable or visible range)
For each historical bar, determining which price levels the bar's high/low range intersects
Accumulating volume for each intersected price level
Optionally filtering by bullish/bearish volume only
Point of Control (POC)
The POC is the price level with the highest traded volume during the analyzed period. This represents the "fairest" price where most traders agreed on value. The indicator marks this with distinct coloring (red in Traffic Light, magenta in Aurora Glass, white in Obsidian Precision, cyan in Black Ice).
Trading Significance: POC acts as a strong magnet for price - markets tend to return to fair value. When price is away from POC, traders watch for:
Mean reversion opportunities when price is far from POC
Rejection signals when price tests POC from above/below
Breakout confirmation when price breaks through and holds beyond POC
Value Area (VA)
The Value Area encompasses the price range where a specified percentage (default: 68%) of all volume traded. This represents the range of "accepted value" by market participants.
Calculation Method:
Start at the POC (highest volume level)
Expand upward and downward, adding adjacent price levels
Always add the level with higher volume next
Continue until accumulated volume reaches the VA percentage threshold
Value Area High (VAH): Upper boundary of accepted value - acts as resistance
Value Area Low (VAL): Lower boundary of accepted value - acts as support
Trading Significance:
Price spending time inside VA indicates market equilibrium
Breakouts above VAH suggest bullish momentum shift
Breakdowns below VAL suggest bearish momentum shift
Returns to VA boundaries often provide high-probability entry zones
High Volume Nodes (HVN)
Price levels with volume exceeding a threshold percentage (default: 80%) of POC volume. These represent areas of strong agreement and consolidation.
Trading Significance:
HVNs act as strong support/resistance zones
Price tends to consolidate at HVNs before making directional moves
Breaking through an HVN often signals strong momentum
Low Volume Nodes (LVN)
Price levels within the Value Area with volume ≤30% of POC volume. These are zones price moved through quickly with minimal consolidation.
Trading Significance:
LVNs represent areas of rejection - price finds little acceptance
Price tends to move rapidly through LVN zones
Useful for setting stop-losses (below LVN for longs, above for shorts)
Can identify potential gaps or "air pockets" in the market structure
Grayscale POC Detection
A secondary POC detection system identifies the highest volume level outside the Value Area (with a 2-level buffer to avoid confusion). This helps identify significant volume accumulation zones that exist beyond the main value area.
How to Use This Indicator
Setup
Choose Lookback Period:
Enable "Use Visible Range" to analyze only what's on your chart
Or set "Fixed Range Lookback Depth" (default: 200 bars) for consistent analysis
Adjust Profile Resolution:
"Number of Price Levels" (default: 80) - higher = more granular analysis, lower = broader zones
Select Color Scheme:
Traffic Light: Best for clear POC/VA/HVN identification
Aurora Glass: Modern aesthetic for dark charts
Obsidian Precision: Professional trader preference
Black Ice: Minimalist single-color family
Visual Customization
Left Extension: How far back the left-side histogram extends into historical candles (default: 490 bars)
Right Extension: Width of the traditional histogram bars on the right (default: 50 bars)
Right Margin: Space between current price bar and histogram (default: 0 for flush alignment)
Left Profile Gap: Space between left-side histogram and candles (default: 0)
Trading Strategies
Strategy 1: Value Area Mean Reversion
Wait for price to move outside the Value Area (above VAH or below VAL)
Look for rejection signals (wicks, bearish/bullish candles)
Enter trades toward the POC
Take profits as price returns to POC or opposite VA boundary
Strategy 2: Breakout Confirmation
Identify when price is consolidating within the Value Area
Wait for a strong close above VAH (bullish) or below VAL (bearish)
Enter on the breakout or on first pullback to the VA boundary
Target previous HVNs or swing highs/lows outside the VA
Strategy 3: POC Support/Resistance
Watch for price approaching the POC level
If approaching from below, look for bullish reversal patterns at POC (support)
If approaching from above, look for bearish reversal patterns at POC (resistance)
Trade in the direction of the bounce with stops beyond the POC
Strategy 4: LVN Fast Movement Zones
Identify LVN zones within the Value Area (marked with "LVN" label)
When price enters an LVN, expect rapid movement through the zone
Avoid entering trades within LVNs
Use LVNs as confirmation of directional momentum
Alert System
The indicator includes 7 customizable alert conditions:
POC Touch: Alerts when price comes within 0.5 ATR of POC
VAH/VAL Touch: Alerts at Value Area boundaries
VA Breakout: Alerts on breakouts above VAH or below VAL
HVN Touch: Alerts when price contacts High Volume Nodes
LVN Entry: Alerts when entering Low Volume zones
POC Shift: Alerts when POC moves to a new price level
Reading the Profile
Price Labels (shown on the right side):
POC: Point of Control - highest volume price level
VAH: Value Area High - upper boundary of accepted value
VAL: Value Area Low - lower boundary of accepted value
LVN: Low Volume Node - expect fast movement through this zone
Color Intensity Interpretation:
Brighter colors = higher volume concentration
Dimmer colors = lower volume
Abrupt color changes = transition between volume zones
Gaps in the histogram = price levels with no trading activity
Technical Details
Volume Accumulation Logic:
For each bar in lookback period:
For each price level:
If bar's high/low range intersects price level:
Add bar's volume to that price level's total
Gradient Algorithm:
Traffic Light: Dual-range piecewise gradient (0-50% and 50-100% volume intensity)
Aurora Glass: Linear cyan-to-magenta interpolation
Obsidian Precision: Dark blue gradient with cyan highlights
Black Ice: Three-stage cyan intensity progression
Real-Time Updates:
The profile recalculates on every bar, including real-time tick data, ensuring the volume distribution always reflects current market structure.
Best Practices
Timeframe Selection: Use higher timeframes (4H, Daily) for swing trading, lower timeframes (5min, 15min) for day trading
Combine with Price Action: Volume profile shows WHERE, price action shows WHEN
Multiple Timeframe Analysis: Check daily VP for major levels, then drill down to intraday for entries
Volume Type Selection: Use "Bullish" volume in uptrends, "Bearish" in downtrends, or "Both" for complete picture
Adjust VA Percentage: 68% (default) captures one standard deviation; try 70% for tighter or 60% for broader value areas
Performance Notes
Maximum bars back: 5000 (handles deep historical analysis)
Maximum boxes: 500 (handles complex profiles)
Optimized calculation: Only recalculates on last bar for efficiency
Real-time capable: Updates as new ticks arrive

Volume vs Body Alert.Vsa
"This VSA-based indicator identifies potential anomalies in price action by detecting candles that show a larger body size than the previous candle while simultaneously having lower volume. This 'more result with less effort' pattern can signal weakness, manipulation, or potential trend exhaustion. Visual signals and customizable alerts notify traders when these conditions occur."

Student Alpha VWAPStudent Alpha VWAP is a flexible, anchor-based VWAP tool designed for traders who want deeper control over intraday and higher-timeframe volume-weighted trend analysis.
The indicator supports multiple anchor types—including Sessions, Weeks, Months, Quarters, Years, and event-based anchors such as Earnings, Dividends, and Splits—allowing VWAP to automatically reset at meaningful market intervals.
The script includes up to three optional VWAP bands. These can be calculated using standard deviation or percentage-based distance, making the tool adaptable for volatility modeling, mean-reversion strategies, or structural trend assessment.
Bands and colors are fully customizable, while an optional filter hides VWAP on 1D+ charts for cleaner high-timeframe layouts.
Features include:
• Event-aware VWAP anchoring (Earnings / Dividends / Splits)
• Standard deviation or percentage-based VWAP bands
• Three independent band multipliers with visual fills
• Automatic timeframe and period detection
• Offset controls and full plot toggle options
This tool aims to give traders a more adaptable, context-aware version of VWAP that fits both systematic and discretionary workflows.
Trend & Pullback Cycle How to use.
Trend Identification:
Green Columns: The cycle is above 50. Look for Longs.
Red Columns: The cycle is below 50. Look for Shorts.
Pullback Detection:
I added a Colour Change feature. If the Green bars turn Dark Green, it means momentum is fading (a pullback is happening). This is your signal to get ready to enter or add to a position once it turns Bright Green again.
The Yellow Line:
This is your trigger. In the screenshot, you see the bars cross the yellow line.
Entry Signal: When the Histogram crosses above the Yellow line (while generally green) or crosses below it (while generally red).

Advanced Volume Suite (24h, Pulse, Spikes, Breakout Pressure)Advanced Volume Suite transforms raw volume into a complete market-intelligence toolkit for breakout, momentum, and liquidity-driven trading.
Unlike the basic volume indicator, this tool analyzes volume in true USDT value, tracks rolling 24h exchange-style volume, measures volume strength vs historical averages, detects smart spikes, and highlights breakout pressure near support/resistance.
Core Features:
• USDT-based volume histogram
• 24h rolling volume line
• Volume Pulse (volume vs moving average)
• Smart spike detection with directional filters
• Breakout pressure system (breakouts + near-breakout conditions)
• 3 advanced volume color modes (Simple / Body / Delta-style)
• All signals and thresholds fully configurable
Perfect for traders who rely on volume confirmation for breakouts, momentum entries, scalping, or detecting institutional activity.

XAU Micro ScalperThis indicator is designed for short-term price rotation detection on XAUUSD, especially on the 1-minute timeframe.
It combines three momentum components—Stochastic, RSI, and OBV slope—to highlight potential reversal points and short-term scalping opportunities.
Core Logic
The script generates a signal only when multiple conditions align:
1. Stochastic Reversal (Timing Component)
A basic long/short trigger occurs when the Stochastic oscillator exits oversold (long) or overbought (short).
This represents a potential shift in short-term momentum.
2. RSI “Smart Rotation” Filter (Context Component)
Instead of using fixed oversold/overbought thresholds, the indicator checks whether RSI is turning:
Long: RSI is below a contextual ceiling (default 50) and rising
Short: RSI is above a contextual floor (default 55) and falling
This avoids premature entries during strong trending phases and confirms that momentum is actually rotating.
3. OBV Slope Filter (Volume Confirmation)
The On-Balance Volume trend is compared to its previous value:
Long: OBV slope improving
Short: OBV slope deteriorating
This helps confirm whether volume pressure is shifting in favor of the trade direction.
Both RSI and OBV filters can be enabled or disabled independently via the indicator settings.
Signals
Small circles mark raw Stochastic reversal points (unfiltered).
Green / red triangles represent validated long/short signals where all active filters agree.
Optional candle coloring highlights confirmed entry signals on the chart.
Use Cases
Intraday and scalping strategies on XAUUSD
Identifying short-term momentum reversals
Filtering noisy signals during high-volatility sessions
Studying how volume and momentum align around turning points
Customization
Users can adjust:
RSI contextual thresholds
Lookback periods
OBV slope sensitivity
Stochastic parameters
Activation of RSI and OBV filters
This flexibility allows the indicator to adapt to different market conditions and timeframes.
Disclaimer
This indicator does not provide financial advice or guarantee performance.
Always test any strategy on historical data and use proper risk management.

VAPO OsilatorThe Real Map of Buying and Selling Pressure.
VAPO Advanced is fundamentally different from conventional oscillators that only measure momentum based on price. By integrating Volume and price movement (Pressure), it quantitatively maps the true buying and selling pressure in the market.
How It Works and What Are Its Advantages?
1. Core Pressure Measurement
Logic: The oscillator interprets high-volume price increases as strong buying pressure (+P) and high-volume price decreases as strong selling pressure (-P). Low-volume moves weaken the signal strength.
Benefit: This effectively filters out misleading signals caused by "fake" price movements (manipulation or low-volume spikes). It only displays momentum shifts that are supported by volume.
2. Dynamic Signal Line and Histogram
Signal Line: Provides a dynamic signal line smoothed by your choice of Moving Average type (EMA, SMA, WMA).
Histogram: Shows the difference between the VAPO line and the Signal line. A zero-line crossover of the histogram is the clearest signal that pressure is shifting direction. As the Green histogram grows, Buying Pressure accelerates; as the Red histogram grows, Selling Pressure accelerates.
3. Reliable Confirmation Tool
VAPO serves as an excellent confirmation tool when used alongside your primary trend indicators. For instance, when a trend indicator gives a BUY signal, VAPO crossing above the zero line (positive pressure) significantly increases the reliability of that signal.
⚠️ DISCLAIMER: THIS IS NOT FINANCIAL ADVICE. ALL INFORMATION PROVIDED IS FOR EDUCATIONAL AND ANALYTICAL PURPOSES ONLY.
YASAL UYARI: BU BİR YATIRIM TAVSİYESİ DEĞİLDİR. SUNULAN TÜM BİLGİLER YALNIZCA EĞİTİM VE ANALİZ AMAÇLIDIR.
