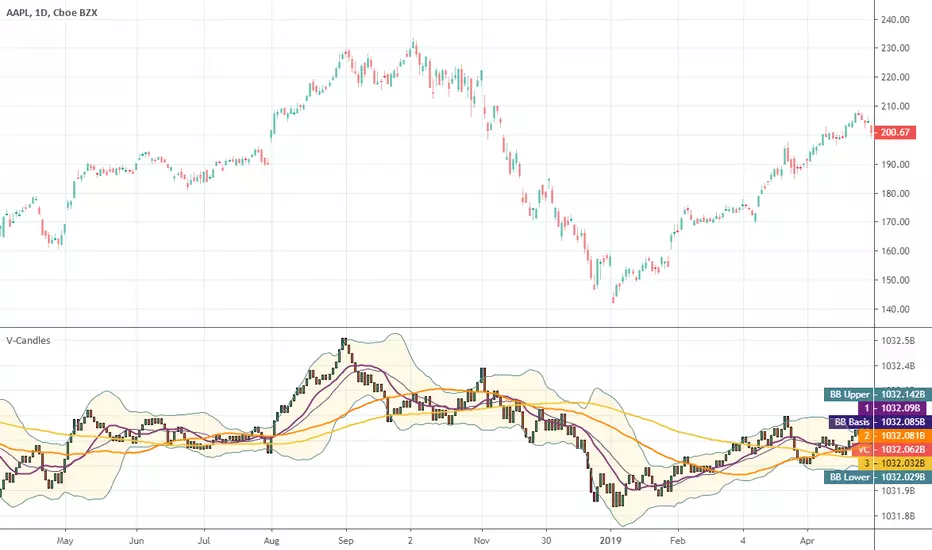
Volume CandlesHello traders!
Well, I was trying to implement EquiVolume Charts that were developed by Richard W. Arms, but unfortunately I got a poor result.
Instead, I used my groundwork on EquiVolumes to create Volume Candles indicator to help you make better, smarter trades.
What are the cool features?
Excellently filters the instrument's movements
Gives a better view of the accumulation/distribution phases
Completely removes price gaps
Works on ANY instrument that has available volume data.
Personally, I am a big fan of the volume-based indicators and to clarify my position I cite the following words of Buff Pelz Dormeier from his book "Investing with Volume Analysis: Identify, Follow, and Profit from Trends" :
A trade produces only two pieces of information: the price and price's neglected sibling, volume. Perhaps the least appreciated piece of the puzzle, volume represents fertile ground for technical analysis. Proficiency in volume analysis is a rare skill. Properly understood, though, volume analysis can provide its practitioner with the power to peer deeply into market mechanics.
Benjamin Graham, the father of value investing and a mentor of Warren Buffett, often called the market a 'voting machine'. If so, then volume is the ballot box. Volume is a literal illustration of the power behind the forces of supply and demand.
Volume is understood as the validation of price, the source of liquidity, the substantiation of information, the fulfillment of convictions, the revelation of divergent opinions, the fuel of the market, the proponent of truth, and the energy behind the velocity of money. If you believe any of this information might be important in making an investment decision, volume analysis is important to you.
I attached some screenshots to show you how it works with other instruments.
Happy Trading!
Volumepriceanalysis
Klinger Volume OscillatorThis indicator was originally developed by Stephen J. Klinger (Stocks & Commodities, V.15:12 (December, 1997): "Identifying Trends with Volume Analysis").
NOTE : this is the only correct version of Klinger Volume Oscillator in the public library.
Like and follow for more open source indicators!
Happy Trading!

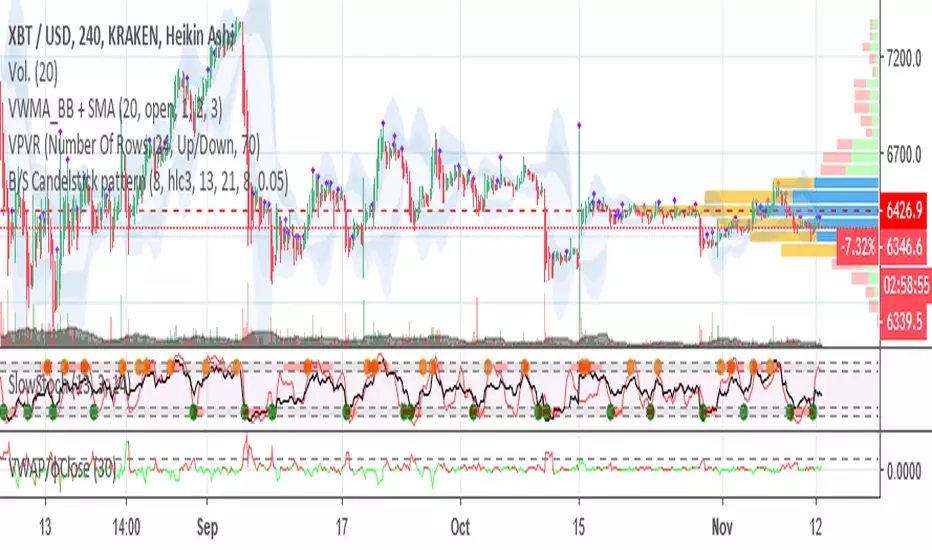
VWAP/CloseHey!
This time I'm going to introduce you to an indicator which catches volume spikes and its respect price change, to give an idea of the following price action.
The logic is pretty simple:
Value > 1 : High Volume that changed a lot the price, next price action will follow that trend.
Value < 1 : Low volume that changed a lot the price, trend is weak.
Value = 1 : Volume and price change is balanced, trend would continue based on the previous values.
If you have any doubt just comment!
φ

Relative Volume - VPA / VSA / Better VolumeVolume is important.
Volume is VERY important.
But all the existing methods of volume analysis and order flow analysis fall into the same trap: they're all extremely complicated, hard to learn, and difficult for the human brain to distill down to an actual, tradable signal.
The Relative Volume Gradient Paintbars indicator seeks to address this issue by reducing and simplifying concepts from Volume Price Analaysis (VPA), Volume Spread Analysis (VSA), and Market Profile / Volume Profile into a single indication with varying levels of intensity. Rather than adding more complex symbology and cluttering up your charts with arrows and signals and lines as many volume indicators do, relative volume intuitively takes advantage of the dimension of color, and plays to your brain's automatic recognition of color intensity to highlight areas of interest on a chart where large volumes are being traded. These areas can in turn point out levels of support and resistance, or show strength in a move, exposing the actions of larger market participants that are behind a move.
The Relative Volume indicator can calculate based on a time-segmented / time-based / bar-specific average of volume, adjusting for some of the typical spikes in volume that happen at the beginning and end of a trading day; Or it can be calculated based on any length and type of moving average of volume that is desired: simple, exponential, weighted, Wilders, price-weighted, Hull, or TEMA.
This indicator does more than just normal relative share volume. It can also do relative volume-per-range. The idea behind this setting is that when more volume is being traded but very little movement is happening, this can indicate substantial support or resistance, where a lot of trades are likely being absorbed by larger operators. You can choose your own range calculation for this setting, whether you prefer True Range, high-low range, candle body range, close to close range, or any of several other custom settings.
Moreover, the levels or thresholds at which the color intensity changes are completely user-controlled, so you can adjust them upward to tune out more noise, or downward to increase the level of sensitivity. In addition, all of the colors for each of the thresholds are completely user-controlled.
We hope to see TradingView add support for Richard Arms' CandleVolume or Equivolume before too long, as well as Tick Volume or Trade Count Volume data, all of which can add a lot of power to this method of trading.
BottomFinder MTF Madness - 5x MTF Grid IndicatorsHello Again Trading View!
Bottom Finder Team here bringing another delicious indicator, this time to help spot those trends! This version is closed for Beta Testing with our subscribers only for the next few weeks. After beta improvements it will be released free to anyone who signs up as a free member on our site.
This is meant to be used on the 15m timeframe, and it looks up into higher TF's. It is meant to be maximized, so have this open in one tab and the chart on another. Dual Monitors are best. All options and Time frames are fully configurable inputs.
Indicators from top to bottom are:
1.)Polarity Filtration - 6 Timeframes
2.)Price Volume Trend - 4 Timeframes
3.)Stochastic RSI - 4 Timeframe Grid, and Current Timeframe in lines/ribbons
4.)MACD Crossovers - 8 Timeframes
5.)SuperTrend - 4 Timeframes
And last...
6.)Background Color indicator is up/down (green/red) price on 1 Hour Heiken Ashi candle chart.
No more swapping back and forth between timeframes!
For access to this and many other exclusive indicators - you can visit our telegram and ask about becoming a subscriber. All our paid indicators have a reasonable lifetime cap price. Once you reach it, indicator is yours for life - no more subscription.
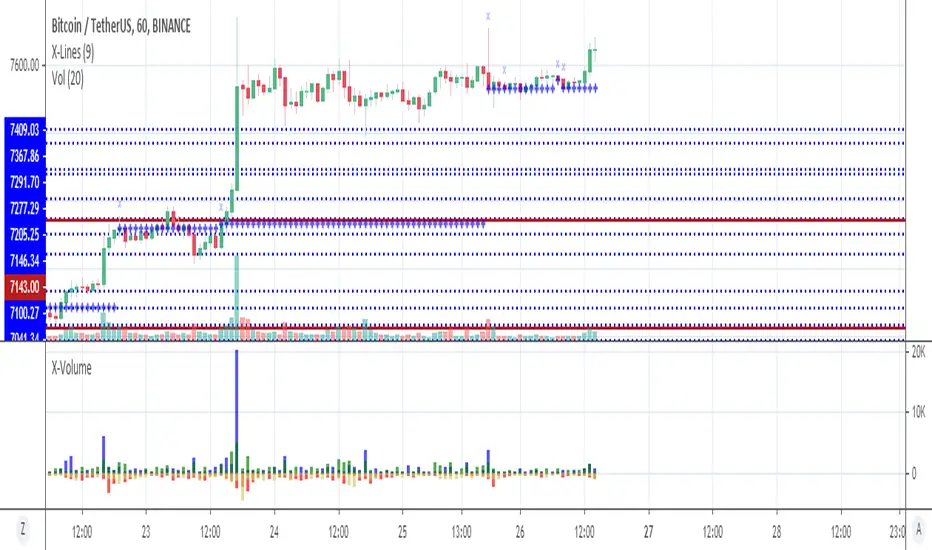
X-VolumeUsing the indicator, you can roughly analyze the accumulation and distribution of trading volume.
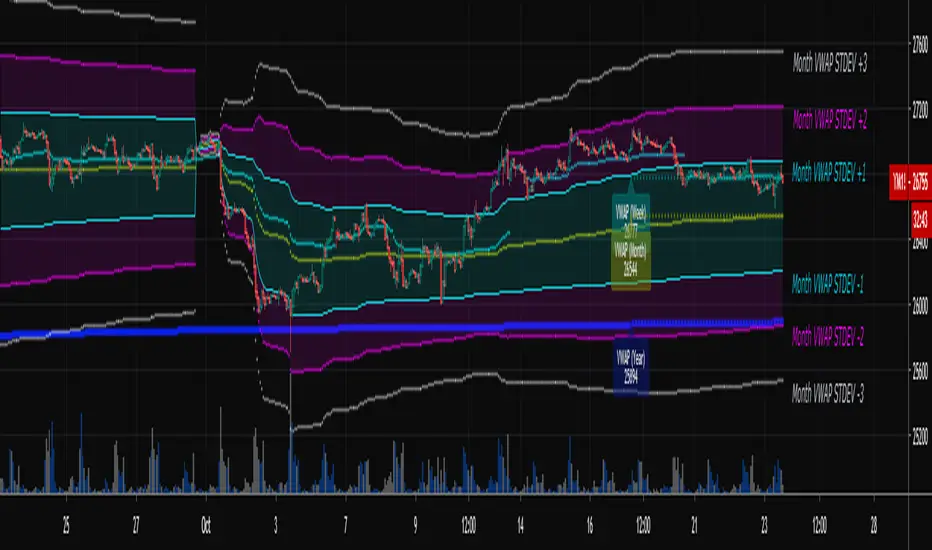
Multi-Timeframe VWAPShows the Daily, Weekly, Monthly, Quarterly, and Yearly VWAP.
Also shows the previous closing VWAP, which is usually very near the HLC3 standard pivot for the previous time frame. i.e. The previous daily VWAP closing price is usually near the current Daily Pivot. Tickers interact well with the previous Daily and Weekly closing VWAP.
Enabling the STDEV bands shows 3 separate standard deviation levels, defaulted at 1, 2, and 3. The lookback period for the bands is always changing with each new bar, since the standard deviation is calculated from the current bar to the beginning of the period. This is different from bollinger bands, as the lookback is constant (usually 20 periods is the textbook default).
The STDEV bands interval of interest can be changed from Day (D), Week (W), Month (M), Quarter (Q), Year (Y).
Tickers tend to bounce very well on Daily, Weekly, and Yearly VWAP (Yes... Year). Use this code and observe the Year VWAP on several major symbols through the past few years and eyes will be opened.
Price Wave V.1.0The Price Wave Indicator is very good add-on to the Volume wave which is an important tool in the Wyckoffian Analysis of the stocks. Along with the Volume wave it helps to understand the effort and result ratios and the consequent effect on the stocks. It has to be used in conjunction with the Volume wave and not useful on a standalone basis

Volume Wave V.1.0Volume wave Indicator is an important tool in the Wyckoffian Analysis of the stocks. It helps to understand the changing / continuation of bullish and bearish sentiment or the Buying and selling pressure. It also helps to understanding the waxing and waning buying and selling pressure and forewarns the changing sentiment. Along with the Price wave it helps to understand the effort and result ratios and the consequent effect on the stocks.

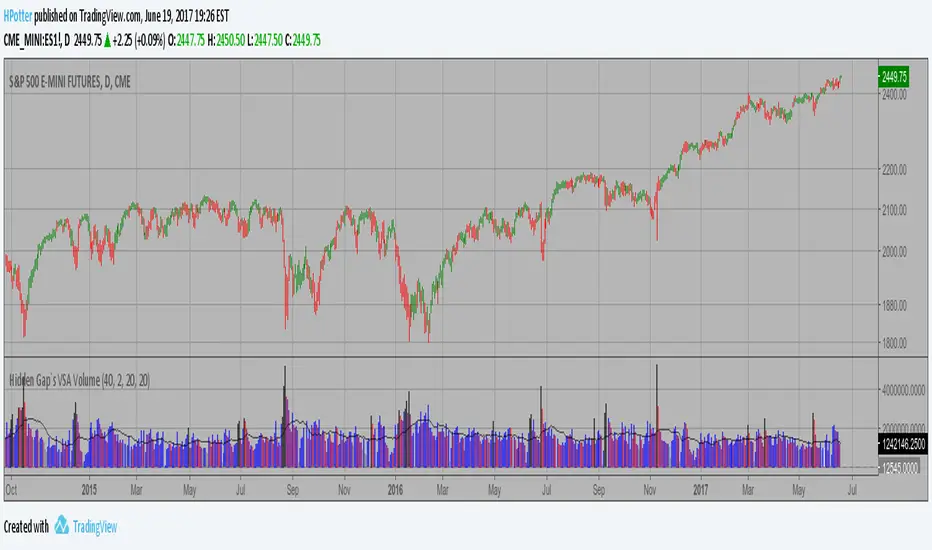
Hidden Gap`s VSA Volume If Volume is less then the previous 20 intervals, Volume is gray.
If Volume is greater then the previous 40 intervals, Volume is black.
If Volume is less then the previous 2 intervals, Volume is purple.
If Volume is less then the previous, Volume is red.
If Volume is greater then the previous, Volume is blue.
Other - white.
You can add on the indicator a 2.5 Standart Deviation of a 20 period
Bollinger Band Shifted 3 periods forward.
Advance-Decline Volume Percent Backtest Advance-Decline Volume Percent (AD Volume Percent) is a breadth indicator
that measures the percentage of Net Advancing Volume for a particular group
of stocks, such as an index or ETF. Net Advancing Volume equals the volume
of advances less the volume of declines. AD Volume Percent equals Net Advancing
Volume divided by total volume for the group. AD Volume Percent fluctuates
between -100% and +100%.
You can change long to short in the Input Settings
Please, use it only for learning or paper trading. Do not for real trading

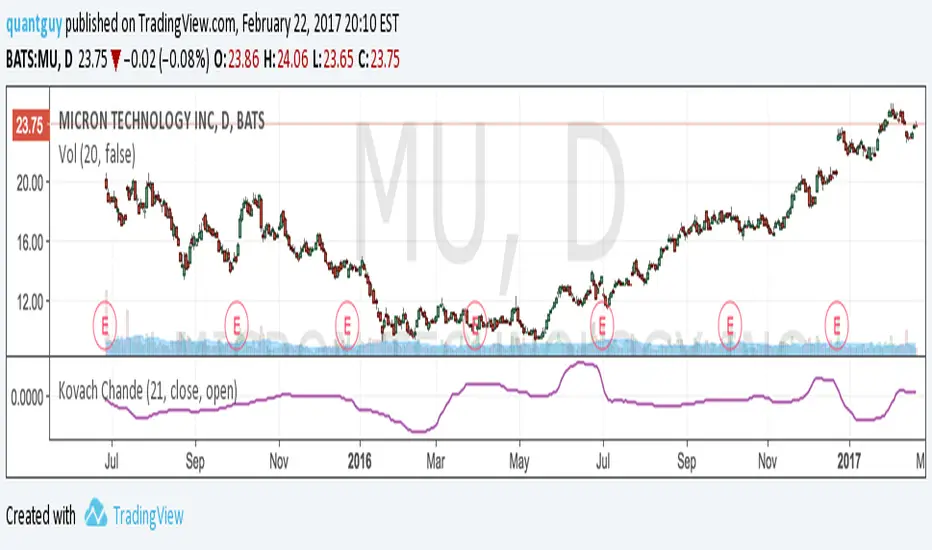
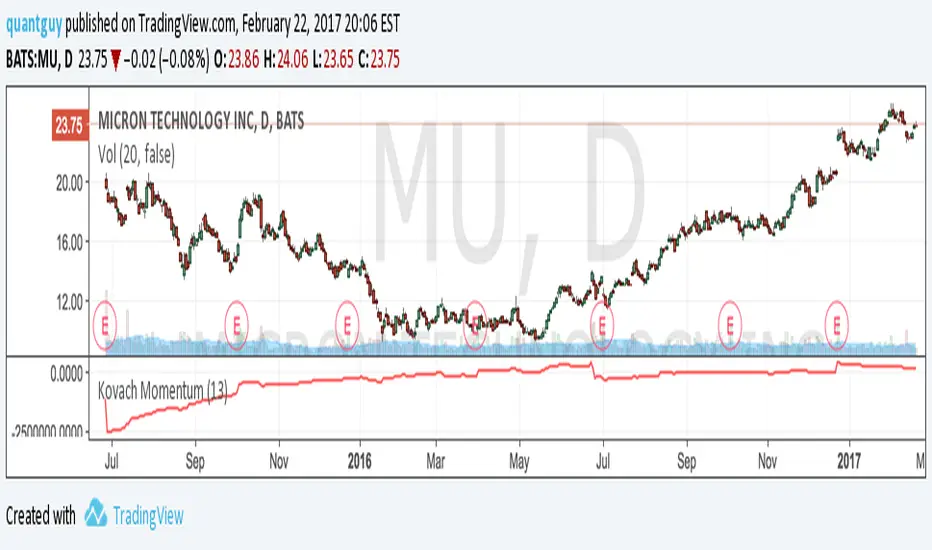
Kovach ChandeThe Kovach Chande indicator measures instantaneous buying pressure. It features advanced signal processing algorithms to minimize lag and filter the effects of volatility. Consider using it with the Kovach OBV indicator and Kovach Momentum indicator. When used with the Kovach OBV, divergences may be used to isolate entry points.
Kovach MomentumThe Kovach Momentum indicator averages instantaneous momentum, while employing advanced signal processing algorithms to minimize lag and filter the effects of volatility. Consider using it with the Kovach Chande indicator and Kovach OBV indicator.
RSI candlesLike Volume-Spread-Analysis , this plot is an attempt to show a little of the candle's feeling.
Some people say that "the most important thing is closure", but we can read some patterns on the RSI candle. And if we use volume changes, it can sometimes make the pattern reading clearer. This indicator is intended to help as a support.
The technique is simple: an RSI candle, not just a linear graph. And also with the option to weigh the volume changes.
Ideas, corrections and suggestions.
Those are always welcome
Al igual que el Volume-Spread-Analysis , esta presentación del clasico RSI es un intento de mostrar un poco del sentimiento que refleja la vela.
Algunas personas dicen que "lo más importante es el Precio final", pero podemos leer algunos patrones en la vela aun en el RSI. Y si usamos cambios de volumen, puede hacer que la lectura del patrón sea más clara. Este indicador tiene la intención de ayudar como un soporte.
La técnica es simple: una vela RSI, no sólo un gráfico lineal. Y también con la opción de sopesar los cambios de volumen.
Ideas, correcciones y sugerencias.
Son siempre bienvenidos

Hersheys Volume Pressure v2Hersheys Volume Pressure gives you very nice confirmation of trend starts and stops using volume and price.
For up bars...
If you have a large price change with low volume , that's very bullish .
If you have a small price change with low volume , that's bullish .
For down bars...
If you have a large price change with low volume , that's very bearish .
If you have a small price change with low volume , that's bearish .
Look at the chart and you'll see how trends start and end with a PINCH and widen in the middle of the moves.
You can set the moving average period, 14 is the default.
Good trading!
Brian Hershey
v2 change log...
- issue with price gaps - gaps at the open were sometimes showing incorrect colors
- scaling issues - sometimes a change is so large it scales down all nearby data and renders it hard to view. Code was added to clip those huge values.
v3 what's coming next...
- better scaling - sometimes with thinly traded stocks there is too much clipping. For now increase the chart interval to correct.

Hersheys Volume Pressure v1Hersheys Volume Pressure gives you very nice confirmation of trend starts and stops using volume and price.
For up bars...
If you have a large price range with low volume, that's very bullish.
If you have a small price range with low volume, that's bullish.
For down bars...
If you have a large price range with low volume, that's very bearish.
If you have a small price range with low volume, that's bearish.
Look at the chart and you'll see how trends start and end with a PINCH and widen in the middle of the moves.
Hersheys Volume Pressure is unique, in that it measures bull/bear pressure on each bar by itself. Other volume indicators like On Balnce Volume and Price Volume Trend use cumulative differences in the current and previous bar to show trends.
You can set the moving average period, 14 is the default.
Good trading!
Brian Hershey
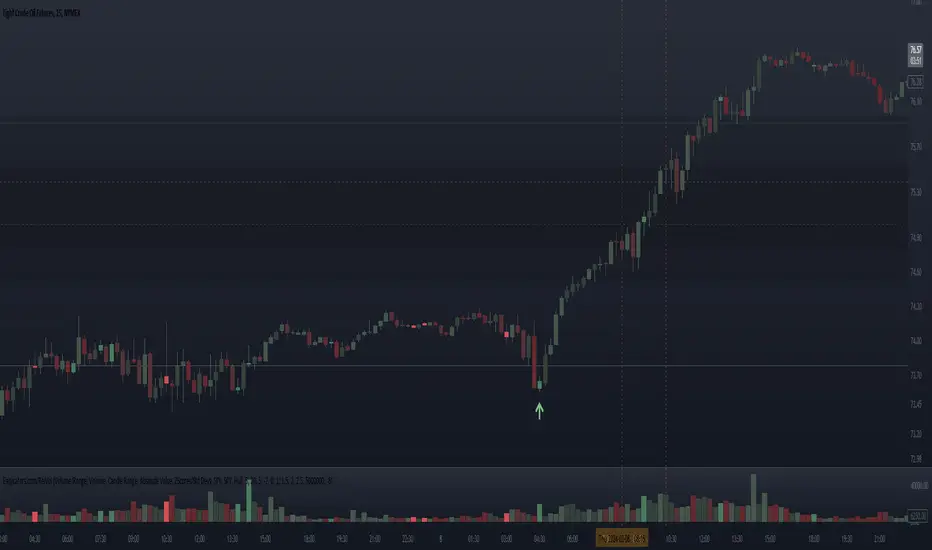
cooltoyz: Volume Delta RealTime v1.0This is a tool, shows the volume variation % strength related to the X past candles.
The current candle is shown in real time, until candle closes.
The visualization of the candle time to close is a thin line, that is 100% for all past candles and slowly goes up for the current candle.
Best with an example:
with a 4h candle, 1 hour has wasted already. This is 25% of all the candle time. So, if volume is also at 25% of the last candles traded, we can expect(yeah, you wish) that by candle close, around 100% of the last volumes average will be traded.
Or two:
in a 4h candle, we're at 10mins., around 8% of total candle time. If volume traded is already at 57% of average past volumes, something big is going on.
Note 1: in the indicator's "Format" pop-up there is a "candle minutes" field, it MUST match the chart timeframe in minutes (ex: 4h=240min)
Note 2: the back volume function check can be switched between the methods "highest value" or "average", in the Format->inputs
Note 3: when a new candle opens, it will go craaayeeezeee!!, because the extreme small values introduce a lot of rounding errors. just let it go, it calms it self after ~0.5% of candle time has passed.
There are more examples and details in the early version of this indicator, check my published scripts.

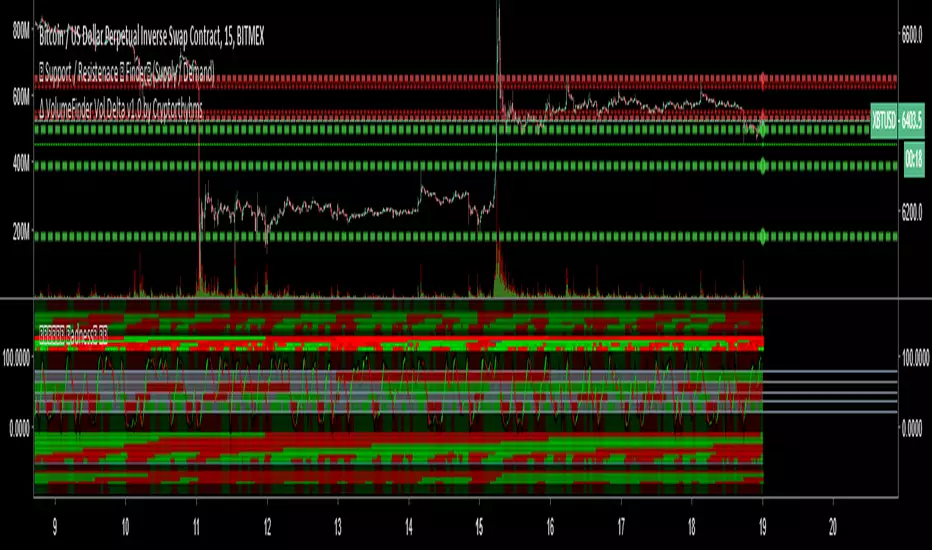
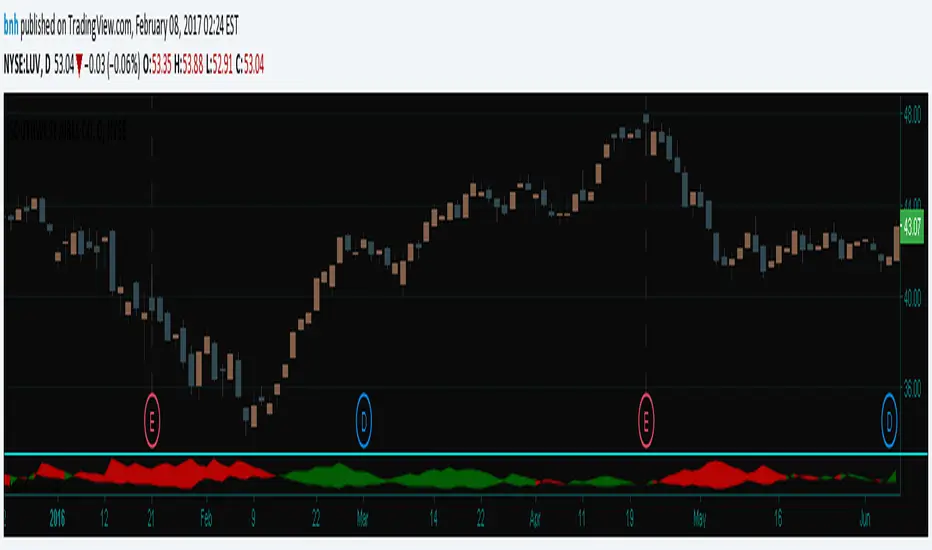
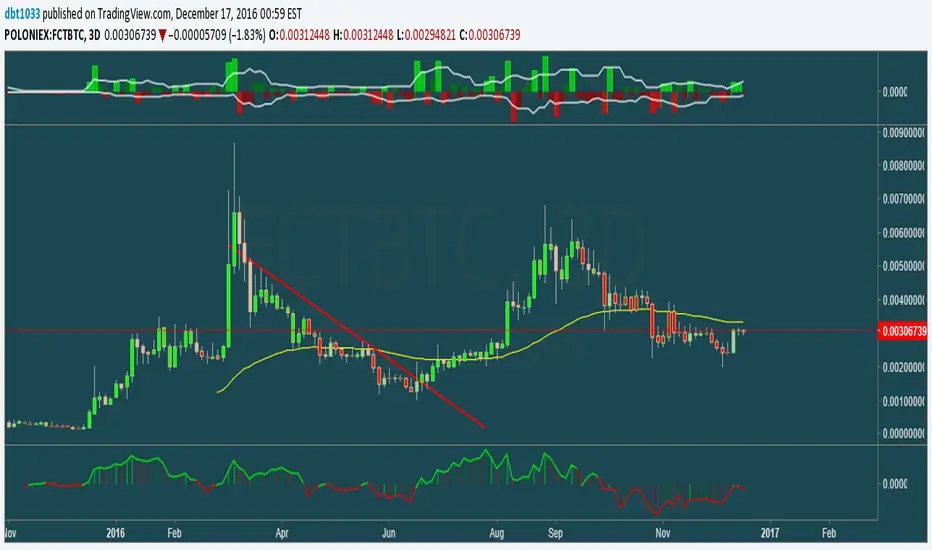
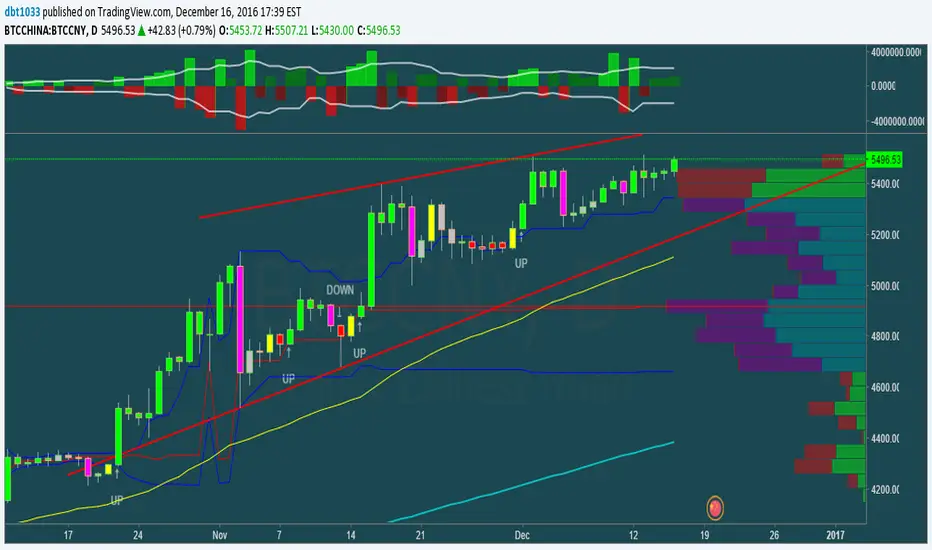
Pump_Doctor Trends**You must enable bar colors in the options for the script if you wish to see them**
This indicator is very useful for spotting trends / tops / bottoms.
This is the ultimate altcoin pump spotting tool. Use on higher timeframes for greatest accuracy. If altcoin is newish (ZEC for example), try 4h rather than 1D or 3D.
Green = Uptrend
Red = Downtrend
Gray = Top/local top, bottom/local bottom, or continuation. You will need some knowledge of price action to determine which condition applies.
You can use the oscillator at the bottom as a measure of momentum / trend strength. You can draw trendlines on the oscillator on the top/bottom or the interior.
1337 VolumeThis volume indicator gives you a unique perspective and ability to analyze volume in any market. The upper line that is always >=0 represents average up volume over a user definable period while the lower line that is always <= 0 represents the average down volume over a user definable period.
green == bullish candle but volume lower than average
lime == bullish candle with above average volume
crimson == bearish candle with below average volume
red == bearish candle with above average volume
This indicator is very useful for spotting bottoms / tops (do a visual backtest and observe its behavior) as well as entry opportunities.
By default, the lookback period for average volume is 7, but I encourage you to change this value in order to find settings that work best for your particular market.
If you have any feedback or ideas for improvement, please comment.
Enjoy :D
Volume Price Spread Analysis 2With the same idea of the VPSA i make the VPSA2 to make Heiken Ashi style synthetic graph of the price and the volume effect, its easy to see the volume trends. Each instrument have a more clear time frame to see the volume patterns.
I see very useful like a secondary analysis layer. in the graph show the same RSI with price and VPSA2 like source.
Can use others indicators over the VPSA, only write in CAPITAL letters open, high, low, close or hl2 at inputs section.
Ideas, corrections & comments.
They are always welcome.

Volume Price Spread AnalysisWith the same idea of the VSA i make the VPSA to make synthetic graph of the price and the volume effect, its easy to see the volume trends. Each instrument have a more clear time frame to see the volume patterns.
Can use others indicators over the VPSA, only write in CAPITAL letters open, high, low, close or hl2 at inputs section.

Colored Volume Bars standard deviation from meanThe colour bars:
Green: Price up - Volume > 2 x STD of last 21 bars
Blue: Price up - Volume > 1 x STD of last 21 bars
Maroon: Price down - Volume > 2 x STD of last 21 bars
Purple: Price down - Volume > 1 x STD of last 21 bars
Grey: not high volume bar
Green line: 2 bar sma
Red line: 8 period sma of the greenline
Bollinger band: 55 period sma of the 21 period sma with bands 1.618 deviation from the mean
