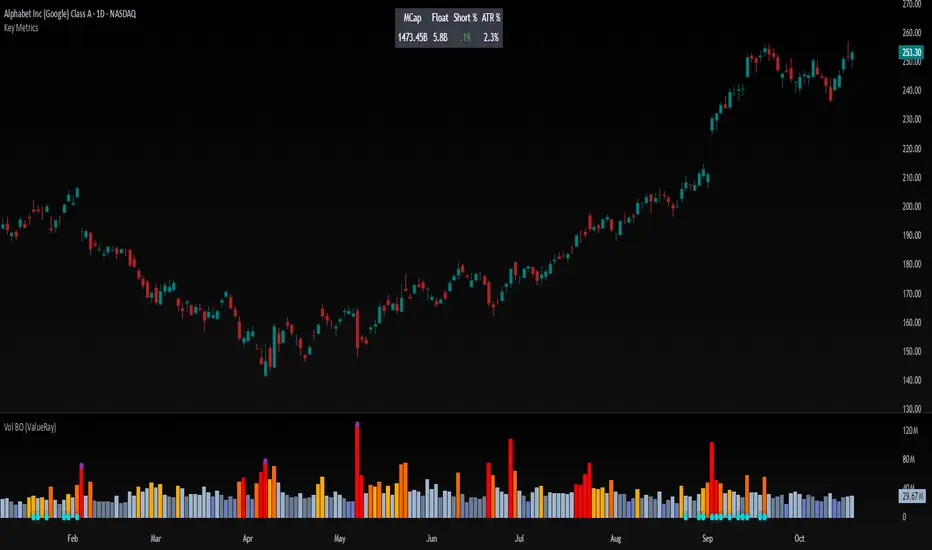
Volume Breakout (ValueRay)Easy visuals on, if volume is way over average. Good for Mean Reverting. Higher Volume tends to higher breakout chances.
Please whisper me for for ideas how to make this better. Its a very simple script, but got some alpha. If you know how to improve, let me know and i will code it into.
VOLUMEBREAKOUT
Volume PlusVolume plus provides volume insights to identify increase or decrease in relative volume or sudden volume expansion that exceeds the average. Based on the period selected the script displays the color code.
Features
1. Two different sensitivity levels can be selected for volumes and coloring.
2. Whenever the volume is higher than the selected SMA, volume bars will change color.
3. Can Plot 20 SMA (can be changed)

SVA - Simple Volume Analyzer, by BlueJayBird [bjb] ENGLISH & SPANISH
------------------------------------- ENSLIGH
The idea was initially inspired in the concepts shared by @LazyBear on his indicator "Better Volume Indicator" (). But I found it somewhat complicated and dull. So I came up with this.
Concept:
It changes the color of volume bars based on surrounding volume changes.
Volume changes are plotted as volume MAs lines in the volume pane.
Whenever the volume is higher than these MAs, the bar changes color.
For this reason, the bar color change is RELATIVE TO the surroundings, because the color change depends on how far the MA has been extended due to sudden (or not) changes in the volume.
BAR COLORS:
Weak Green and Red: Low volume. The calm before or after the storm.
Normal Green and Red: Mid volume. Still low volume, you may get bored.
Yellow: High volume. Players are playing hard and harder.
White: Ultra-High Volume. The elephants stepped in.
NOTES:
SVA works better at lower timeframes. Though as far as I can tell, it works pretty well as far as 1D timeframe.
------------------------------------- SPANISH
La idea estuvo inicialmente inspirada en los conceptos expuestos por @LazyBear en su indicador "Better Volume Indicator" (). Pero lo encontré un poco complicado y falto de claridad. Así que me inventé este.
Conceptp:
Cambia el color de las barras basándose en los últimos cambios de volumen.
Los cambios de volumen son ploteados como lineas de medias móviles (MAs, es decir "Moving Averages") en la sección del volumen (chart pane).
En cualquier momento que el volumen es mayor que estos MAs, el color de las barras cambia.
Por esta razon, el cambio de color de las barras es RELATIVO a lo que está sucediendo alrededor, ya que el cambio de color depende de qué tan lejos el MA se haya extendido por causa de los últimos cambios (o no) de volumen.
BAR COLORS:
Verde y rojo apagados: Volumen bajo (Low Volume). La calma antes de la tormenta.
Verde y rojo normales: Volumen medio (Mid volume). Volumen todavía bajo. Es posible que te aburras.
Amarillo: Volumen alto (High Volume). Los jugadores están jugando duro.
Blanco: Volumen ultra-alto (Ultra-High Volume). Los elefantes entran a la cancha.
NOTAS:
SVA funciona mejor en temporalidades menores. Pero por lo que he visto, funciona bien hasta la temporalidad de 1D.

Relative Volume & RSI PopThis is a basic idea/script designed to take a breakout trade by taking advantage of volume spikes when price/strength is extended (either long or short).
The script only utilises two indicators, the Relative Volume (RV) and the Relative Strength Index (RSI). The script allows the user to select a RSI value between 69 up to 100 for a long trade and between 35 down to 0 for short trade and then pair this with RV from 0 - 10. The period for both the RSI and RV can also be amended by the user but I found in most cases there was no benefit gained by changing away from normal "14" period lookback. The script typically only has small draw downs as the script is designed to exit the trade when the RSI returns back to "normalised" level, therefore the trades are generally quite short. The exit condition for a long trade is when RSI crosses back below 69 (which is why you cannot enter a long below this value) and for a short the, trade will close when RSI crosses back above 35 (which is why you cannot enter a short above this value). These exit values are locked.
By allowing RSI value to go all the way up to "100" on the long side and "0" on the short side this in effect is a way of eliminating the script from taking either longs or shorts if lets say you wanted to back test the script for long only spikes or short only spike. E.G. By setting RSI upper value to "75" the RV to "1" and RSI lower value to "0" then no short trades will not be taken in your back test as the RSI never really gets down to zero.
I put this together with meme stocks in mind and back tested it on day charts for AMC and then a few trending style stocks too. It typically worked best as long only and with RSI settings between 71 - 75 and RV at 1 or 1.5. I also found it had okay results on some lower 1hr timeframe futures markets and weekly time frames too (albeit trades were few and far between on weekly timeframe).
The beauty of such a basic script you could easily set up a trading view screener to look for these opportunities everyday and perhaps even add in an ADX filter on the screener to see if the trend is increasing. Then use this script to run a back test on the stocks that you've selected from the screener.

Volume Play This is going to be my first published indicator on Trading View. Thanks for TradingView for providing us this great platform And thanks for all of those who helps me to built this indicator and share there ideas.I cannot mention everyone name here believe me that list going to be huge.Everyone’s idea and help is much appreciated.This is how our TradingView community is growing day by day with kindness and knowledge. Every time I take so much from community in form knowledge that every time somewhere I feel that I also need to do something for community and finally day arrived .A gift from my side to community.A gift of indicator-VOLUME PLAY
This volume based indicator has High Relative Volume bar Background, Low Relative Volume bar background ,Volume Labels of Buying volume, Selling volume and Total volume count with percentage, Highest Volume in Percentage and Highest 5x volume count and 10x volume count of bar.Plus I have did column scaling to take Down pan input so you can switch pane or add in existing pane without any major problem And all this works on any time frame. Isn’t it good idea?
This indicator displays the volume of each session in a similar manner of the default volume indicator.However it add on the last bar Green and Red bar colours. Green means buying is more than selling and Red means selling is more than buying.On top of Some bar If number appears That means that’s volume is highest multiple volume of 5 and if number appears with label means highest multiple volume of 10.So simple without label volume counts means 5x and with label means 10x.
Now some of bars has background colour of Mint green , Pastel red and White.That’s highlight high relative volume bars with a highly buying activity range in Green and high relative volume bars with a highly selling activity range in Red And white background is low relative volume for that timeframe bar.
I am kind of person who don’t keep show indicator value enable all time.So it’s come in mind why not plot this values without enabling it.So I decided to show this values of buying, selling and total volumes on top near middle pane.Interesting thing is that I made a label with the help of pine script Table feature.Thanks a lot to Pine Team to add this new great feature! It’s great alternative for labels feature.Because of this feature I am able to locate buying, selling and total volume at right place where in most of scenario it will adjust.
Please note that all values are estimate.It’s not accurate.I show volumes in K,M form.Plus with volume I also try to show Buying And Selling volume in percentage form to get rough idea about what’s going on in instrument.Idea is to get better view of volume by splitting it into Buying , Selling and Total volume.This allows you to see are the bulls or bears in-control in relation to the overall Volume.
By default this indicator overlay is false but you can move this indicator pane to existing upper or lower pane.It will help to save space as well.If combine with two indicator at same pane then it will create two value scale at right side.So you will not loose any indicators values.By default I used 50% of vertical space in indicator scale factor.
I tried to make this indicator as accurate as inbuilt volume indicator with added extra feature.The main aim of indicator to get Idea of volume role in that symbol with that specific timeframe.Result might not be accurate but I expect somewhat nearby to accurate.
Kept source code open purposely for learners of pine script. Please avoid misuse or selling of this indicator.Remember Sharing Is Caring. If someone has suggestions or any addition then please comment below.Wishing you all abundance of health, wealth, and prosperity.
After all its all about VOLUME PLAY.
Disclaimer:-This indicator is not meant for buy or sell signals.This post and the script don’t provide any financial advice. This indicator/code IS NOT intended to be a formal investment advice or recommendation by the author, nor should be construed as such. Users will be fully responsible by their use regarding their own trading vehicles/assets.

Best Bulls Bears Volume trend Breakout V2 [badshah_e_alam]This is a intraday indicator. Only to be used on timeframe less than daily charts.
This indicator purely uses volume to plot the graph. The indicator helps in conforming a breakout strategy.
This indicator is advanced version of my previously developed indicator you can check this link
Total volume is made up of buying volume and selling volume . Buying volume is the number of shares, contracts, or lots that were associated with green bars, and selling volume is the number that were associated with red bars.
The labels on the right side are the current bar value and that days bulls /bears weightage.
the first value shows the current bar volume.
second value show the bulls weight in %
third value show the bears weightage throughout the day ( %)
The Blue plot in graph keeps the track of bulls movement in intraday( %)
The Red plot in graph keeps the track of bears movement in intraday ( %)
X axis is time.
Y axis ranges from 100 to -100
I use 1:2 risk to reward ratio. Do your own research.
**not a financial advice**
Example of price increasing, volume decreasing
this indicator can be used for confirming a breakout strategy with bulls or bears in action. In the current example, the buyer’s volume percentage is reducing and the price is increasing throughout the day. Hence a breakout of the trendline is confirmation of a short trade.
Example of Price reducing, volume decreasing
example of price moving down , bears losing the grip
Example of price decreasing volume increasing
Thanks to nizar9599 for giving idea to improve my previous indicator.
DISCLAIMER
Any and all liability for risks resulting from investment transactions or other asset dispositions carried out by the user based on information received or a market analysis is expressly excluded by me.
All the information made available here is generally provided to serve as an example only, without obligation and without specific recommendations for action. It does not constitute and cannot replace investment advice. We therefore recommend that you contact your personal financial advisor before carrying out specific transactions and investments.
Do your own research, This is not a financial advice.

NSE BankNifty Spot Volume - by GrowMore IndicatorsNSE BankNifty Spot Volume - by GrowMore Indicators !!
HOW Does it work ?
Trading volume is a measure of how much of a given financial asset has traded in a period of time. For stocks, volume is measured in the number of shares traded and, for futures and options, it is based on how many contracts have changed hands. The numbers, and other indicators that use volume data, are often provided with online charts.
The Spot Volume of NSE Bank-Nifty is hard to calculate, but TradingView Pine made it easier to calculate the actual spot volume of Bank-Nifty.
As Bank-Nifty users are aware that the Bank-Nifty comprises of 12 banks and each bank has its own weightage in Bank-Nifty movement.
The Indicator has 12 inputs of banks that are in NSE Bank-Nifty and next beside there is weightage input for that particular bank,
now this weightage is modified by NSE every month so it should be changed every month. The link to it is - www1.nseindia.com
User must update the weightage given by NSE into indicator to use it flawlessly.
Disclaimer : Here the volumes are average of volume - of all Bank-Nifty banks.
User Options : Option to input security name and weightage nearby.
also have SMA of volume of user defined length.
Visual Checks - The user could manually validate the back test results on various assets they would like to use this strategy on before putting it live.
How to get access
Please click on the link / email available in the signature or send me a private message to get access.
Feedback
Please click on the link/email in the signature or send me a private message for suggestions/feedbacks.

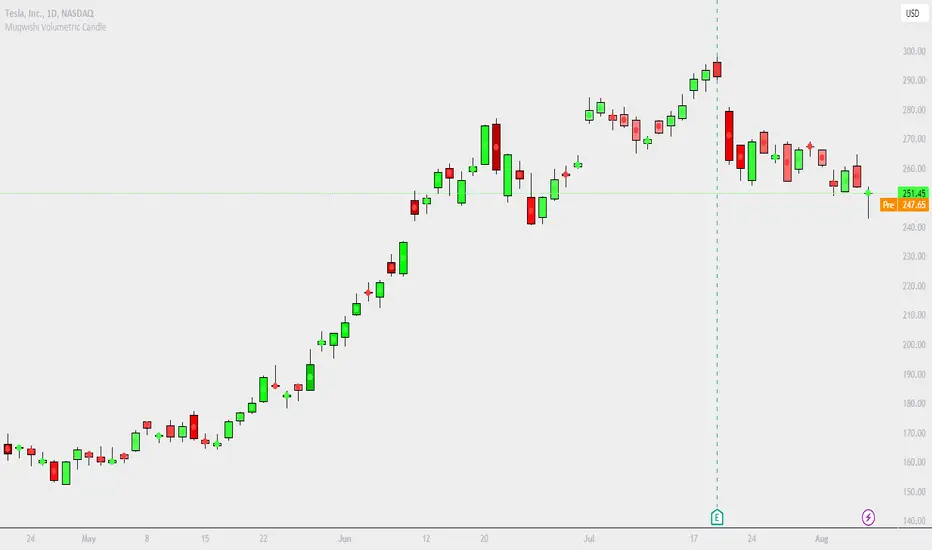
Muqwishi Volumetric CandleIntroduction
Have you ever heard that each candle represents a battle between bulls (buyer) and bears (seller)? If you know the answer, apparently you understand what the price action means. What if I ask you, how much was bloody in each battle between bulls and bears?!. This indicator may give a clear picture of how to identify the candle’s strength by implementing the Standard Deviation on volume and reshape the candle.
The Muqwishi Volumetric Candles indicator works to weigh each candle instantaneously and updates its color level from lightness to darkness based on the rate of the volumetric standard deviation.
Here’s how the idea started with the conceptual design, then improved till achieved to the implemented design of a structured candle.
The conceptual design mentioned for reviewing how the idea started. However, I want you to understand the “implemented design” in which the indicator has been built to address it. As I stated structurally for the implemented design section, wick and border are identified by the user through “Chart Properties” unlike core and body is measured by the indicator.
The candle’s body is ”Dynamic” that colored based on the amount of volume standard deviation in which the low volume standard deviation is a lighter candle’s color and the high volume standard deviation is a darker candle’s color. The core is “Static” color represents zero volume standard deviation which the volume at the average level. In the case where the core is darker than the body means the volume standard deviation is lower than the average volume level, and when the core is lighter than the body mean the volume standard deviation is higher than the average volume level, and when the core’s color has the same body’s color means the volume is in the average level. The image is the best guide to understand the idea.
Rarely seeing a volume standard deviation below -2σ, even though the volume is apparently dead. However, it’s possible to see more than 3.9σ, and mostly it has the same effect as 3.9σ. Personally, any candle above 1.5σ is taking my attention, and more than 2σ I look around seeking for reasons to not take a trade.
§§ Note, if you have misunderstood the standard deviation concept, there are many great sources to understand it such as Wikipedia, YouTube,... etc. In a basic example, How much is your height relative to the height of average people in your city!!?. Similarly, how much is the amount of volume relative to the average volume of a number series of previous bars?!.
Indicator Overview
Before I get into this section, this is NOT meant to be an educational or recommendation. Just showing you how I use this indicator based on an experience.
The chart above has been remarked as an example of how I apply it. Again, it’s a personal preference, and it doesn’t mean this’s an efficient way.
Indicator Setting
➤ Ensure to visualize the indicator to the front for recognition of the candle’s core.
For more information check the image: drive.google.com
➤ Indicator’s title.
Generates two outputs. The first one is the coordinate location for the char “Core”, don’t pay attention to it. The second one colored in blue is referring to the measurement of the volume standard deviation as your cursor point move at any candle on the chart. For more information check the image: drive.google.com
➤ Indicator’s inputs.
■ Length: Number of previous bars covered in the calculation. Prefer between 14-20.
■ Long Candle Color: Choose a color for bullish candles.
■ Short Candle Color: Choose a color for bearish candles.
■ Color Mode: Kinda color style.
● Lightness: From lightness to darkness colored as low volume SD to high volume SD.
● Saturation: From narrow range to wide range colored as low volume SD to high volume SD.
■ Reverse Mode: Yes → Darkness to Lightness colored as low SD to high SD.
■ Show Core: No → Hide cores.
Summarize
■ Users should have a fundamental knowledge of Standard Deviation.
■ The candle’s body is dynamic colored. Got light as low volume standard deviation, and Dark as high volume standard deviation occurred.
■ The Candle’s core is static colored. Represents the average volume which Standard Deviation equals zero.
■ This’s not a trading signal. It works to visualize the level of transactions made per candle.
Final Comments
■ My goal was to achieve the conceptual design, but there’re many obstacles that go beyond the coding ability.
■ Let me know if you have any questions, comments, and any improvements to the project.
■ I hope every time you found this indicator useful and scaled up your trading skills, please present support through PayPal that linked in the signature box below. That will help to get me excited and post many ideas.
■ Trade Safe. ✌
Exhausted Volume (Expo)Exhausted Volume (Expo)
DESCRIPTION
Exhausted Volume (Expo) indicator visualize exhausted volume. Exhaustion often signals the reversal of a current trend because it illustrates excess levels of supply or demand, indicating a market is either overbought or oversold.
The indicator can also be used to detect volume pressure in either direction which can occur in breakouts or in reversal points. The input variable ‘Volume Length’ can be changed. A longer Volume length means that the indicator detects bolder exhausted volume.
• Volume pressure is seen in reversal points.
• Volume pressure can be seen in breakouts.
The indicator is also equipped with exhausted volume signals that are more sensitive. This is visualized with arrows up and down. The investor has the ability to adjust the sensitivity of these signals.
HOW TO USE
1. Use the indicator to identify exhausted volume
2. Use the indicator to identify volume pressure.
3. Use the indicator to identify reversal points.
4. Use the indicator to identify breakouts.
Combine the indicator with ‘ Climax Volume (Expo) ’
INDICATOR IN ACTION
EURUSD
EURUSD
BTCUSD
BTCUSD
The indicator works with RENKO, HEIKIN ASHI and with KAGI charts as well.
I hope you find this indicator useful, and please comment or contact me if you like the script or have any questions/suggestions for future improvements. Thanks!
I will continue to work on this indicator, so please share your experience and feedback with me so that I can continuously improve it. Thanks to everyone that have contacted me regarding my scripts. Your feedback is valuable for future developments!
ACCESS THE INDICATOR
• Contact me on TradingView or use the links below
-----------------
Disclaimer
Copyright by Zeiierman.
The information contained in my scripts/indicators/ideas does not constitute financial advice or a solicitation to buy or sell any securities of any type. I will not accept liability for any loss or damage, including without limitation any loss of profit, which may arise directly or indirectly from use of or reliance on such information.
All investments involve risk, and the past performance of a security, industry, sector, market, financial product, trading strategy, or individual’s trading does not guarantee future results or returns. Investors are fully responsible for any investment decisions they make. Such decisions should be based solely on an evaluation of their financial circumstances, investment objectives, risk tolerance, and liquidity needs.
My scripts/indicators/ideas are only for educational purposes!

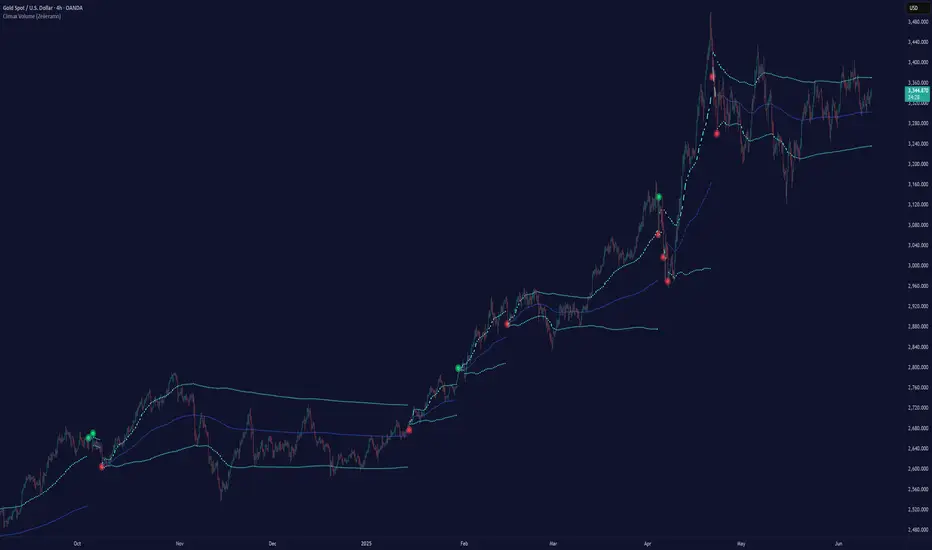
Climax Volume (Zeiierman)█ Overview
Climax Volume (Zeiierman) isolates extreme participation events to pinpoint when price action reaches exhaustion. These moments of volume climax often precede reversals, pauses, or key balance shifts, offering traders an early read on changing market dynamics. Instead of treating volume as a passive tally, it locates climax bars, abnormally large activity bursts, and anchors a Point of Control (PoC) that tracks where post-climax transactions concentrate. The result is a clear read on when participation is peaking, where value re-centers afterward, and how far price can reasonably deviate before reverting.
This tool is designed for multi-context use, such as intraday execution, swing confirmation, or structural bias analysis, offering a precise view of where volume matters, not just how much.
⚪ Why This One Is Unique
Unlike conventional volume-spike indicators, Climax Volume (Zeiierman) integrates adaptive extremum detection, a dynamic PoC core, and multi-layer deviation envelopes that evolve in real time with market context.
Internally, it fuses bid–ask volume delta modeling with re-normalized dispersion mapping to measure the directional imbalance driving each climax event. The system continuously evaluates delta asymmetry between buying and selling pressure to refine the detection of true participation extremes. This allows the engine to differentiate between constructive volume expansion (trend continuation) and exhaustive volume spikes (potential reversals).
█ Main Features
⚪ Climax Volume
The Climax Volume Engine isolates statistically significant bursts in participation that indicate potential turning points or exhaustion phases. It identifies climax bars—instances where volume reaches regime-level extremes relative to recent activity—and classifies them as bullish (green) or bearish (red) based on directional dominance. These events highlight where aggressive activity peaks and often mark the start of structural imbalance, providing early cues for reversal, absorption, or renewed continuation.
⚪ Point of Control (PoC)
Each climax event dynamically re-anchors a Point of Control (PoC)—the evolving price center of post-climax volume distribution. The PoC tracks where transaction density stabilizes after an extreme burst, forming the reference core of a control zone. From this anchor, the system projects upper and lower tolerance bands to define acceptable deviation ranges, contextualizing how far the price can travel before reverting or rebalancing.
█ How to Use
⚪ Trend Following
Use the Volume Point of Control (PoC) as a dynamic guide to assess directional bias. The PoC effectively acts as a moving equilibrium line, continuously updating to reflect where trading volume and market influence are concentrated.
When price holds above the PoC, it signals sustained bullish sentiment and active accumulation.
When the price remains below, it confirms bearish control and ongoing distribution.
⚪ Trend Continuation Retests
The slope of the PoC reflects the strength and persistence of market momentum. The steeper the PoC slope, the stronger the active momentum. A flat or neutral PoC typically signals consolidation or low conviction — conditions better avoided for trend trades.
In a bullish scenario , watch for the price to retest the PoC or the lower tolerance band after a pullback. A successful rejection of that zone often signals that buyers are defending control, providing a high-probability continuation entry.
In a bearish scenario , when the PoC slopes downward, wait for the price to retest it from below. If the market fails to reclaim that level, it indicates that sellers remain dominant, and downside momentum is likely to continue.
⚪ Reversals
Climax Points — the color-coded circles that appear during moments of extreme volume. These signals indicate that the market may soon pause, reverse, or rotate back toward the PoC equilibrium.
🟢 Bullish Climax Points emerge when heavy buying reaches unsustainable levels, often signaling a buyer exhaustion event or a possible local top formation.
🔴 Bearish Climax Points form during high-intensity selling bursts, warning of seller exhaustion and potential bottoming conditions.
⚪ Confirm Breakouts
High-volume breakouts confirmed by Climax Volume signals often mark the initiation of strong directional moves. When climax confirmation aligns with a structural break, it validates that the breakout is backed by genuine participation — not just thin volatility spikes — increasing the probability of follow-through and trend expansion.
Identify a key support or resistance zone manually or with your preferred structural tool.
Wait for a climax signal to coincide with a break beyond that level.
For bullish breakouts , a green climax point appearing as price pushes above resistance confirms that buyers are stepping in with conviction.
For bearish breakouts , a red climax point forming as price drops through support indicates that real selling pressure is driving the move.
█ How It Works
⚪ Climax Detection
Identifies participation surges within a dynamic volume–price field to isolate genuine activity extremes rather than simple bar-size anomalies.
Calculation: Utilizes adaptive extremum detection on a re-normalized volume–delta composite with regime-sensitive thresholds and variance filters to extract statistically valid climax events.
⚪ Point of Control (PoC)
Defines the evolving price centroid where post-climax transactions cluster, continuously adapting to shifting participation density.
Calculation: Employs a volume-weighted delta balance framework with incremental accumulation and curvature-preserving smoothing, ensuring stability while maintaining local reactivity to order-flow asymmetry.
⚪ Tolerance Bands
Outlines a probabilistic corridor around the PoC that distinguishes expected fluctuation from meaningful deviation.
Calculation: Implements variance-aware dispersion modeling with contextual weighting derived from real-time delta gradients, projecting symmetric envelopes scaled by adaptive multipliers.
-----------------
Disclaimer
The content provided in my scripts, indicators, ideas, algorithms, and systems is for educational and informational purposes only. It does not constitute financial advice, investment recommendations, or a solicitation to buy or sell any financial instruments. I will not accept liability for any loss or damage, including without limitation any loss of profit, which may arise directly or indirectly from the use of or reliance on such information.
All investments involve risk, and the past performance of a security, industry, sector, market, financial product, trading strategy, backtest, or individual's trading does not guarantee future results or returns. Investors are fully responsible for any investment decisions they make. Such decisions should be based solely on an evaluation of their financial circumstances, investment objectives, risk tolerance, and liquidity needs.
Bezahltes Script

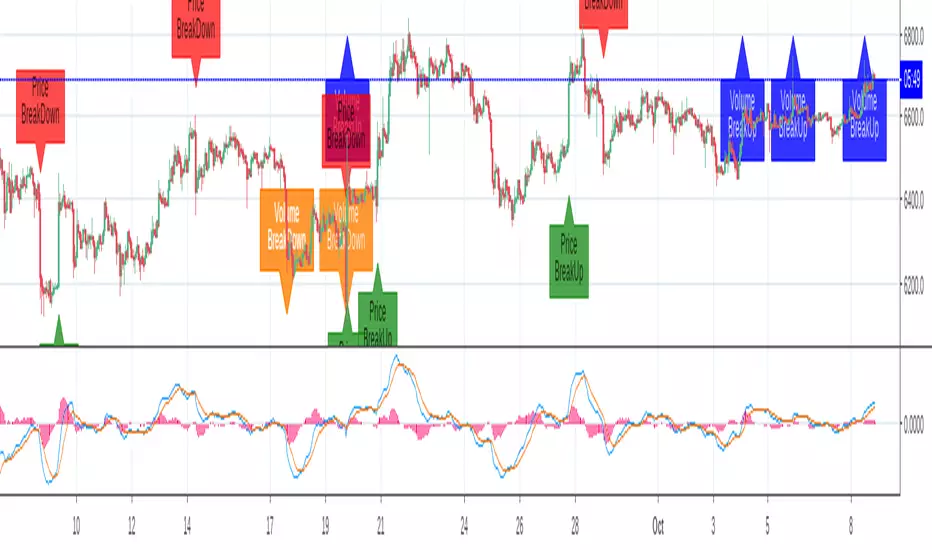
Breakout Labels and Alert For Price And VolumeThe indicator is developped for bitcoin and other cryptocurrencies, whose price and volume changes heavily within minutes. For the other Asset Classes, you may need to adjust the parameters.
Benefits:
1. Since a breakout of price or volume often means the start of a trend, this indicator alerts and displays a label when there is a breakout in price or volume.
2. The indicator prints labels on the chart, which helps people to study the relationship between a breakout and the trend.
3. The volume change is compared to a SMA of volume, instead of the last bar, which can reflect the change compared to a certain period.
4. You can set an alert for breakouts of both price and volume, instead of do it two times.
Settings:
SMA Length for volume: is the length to calculator volume SMA, default:108.
Toggle on/off to display or hide labels for price or volume breakout.
Customize the alert threshhold for price or volume breakout in different time period:3m,5m,15m,30m,60m and other
Use percentageGapForSlopeshape to adjust the relative position of labels.
Style - color settings: Orange for Volume Down, Blue for Volume Up, Red for Price Down, Green for Price Up.
DepthHouse MTF Volume FlowDepthHouse MTF Volume Flow Indicator is an amazing tool used to help determine market direction on multiple time-frames based on the the traded volume.
This indicator is a superb upgrade to my original volume flow indicators.
You now how the option to adjust the displayed volume timeframe, which in turn adjusts the Volume Flow Moving Averages , along with the new Breakout Candle feature.
Additionally, the background colors represent the volume flow crossovers on the primary time-frame, along with three addition time-frames that are user adjustable.
The primary volume flow crossover is shown on the top of the grid, followed by the First Additional Time Frame and then so on down to the bottom.
I generally have this set with the lowest timeframe value at the top, followed by the next one in line.
For those of you who wish to set the current timeframe greater than the rest. I have built in a grid separator feature which will separate it from the rest of the background crossovers.
My MA Settings:
I generally have my Moving Averages set anywhere from 7-14
Breakout Factor:
I generally have the breakout factor set at 1.5 or 2.5
Note: Since volume amounts vary across the board. The background height is set to readjust based on the highest bars. This lookback amount is adjustable by the user and it does not affect calculations what so ever.
How to get:
As you can see this is an invite only script. In the coming month this indicator, along with many others will become pay to use only. (website on my profile page)
However all my indicators will be FREE until May 1, 2018 . So please try them out!
To take advantage of this FREE trial:
1. Leave comment on this indicator post! Maybe even give me a follow :D
2. Check out and take advantage of all my other indicators!
I hope you all enjoy!
