IOTA Market CapThis plots the exact value of the current IOTA market capital in real-time. You can find this indicator in the public indicator library! Search, " IOTA ". Like and follow for more cool indicators! :)Pine Script® Indikatorvon GrantPeaceAktualisiert 1148
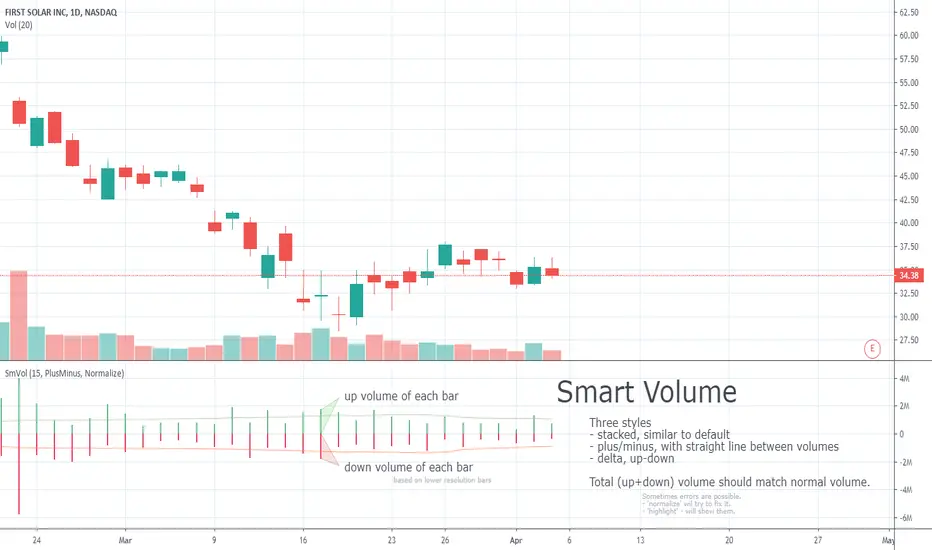
Smart VolumeOut of beta! This script distinguishes up/down volume based on lower resolution. It's important to set correct input "Detailed Resolution" — it affects detalization/loading speed. If equal to chart resolution, should match builtin "volume". The lower it is, the more detalized up/down border.Pine Script® Indikatorvon apozdnyakovAktualisiert 2626 2.4 K
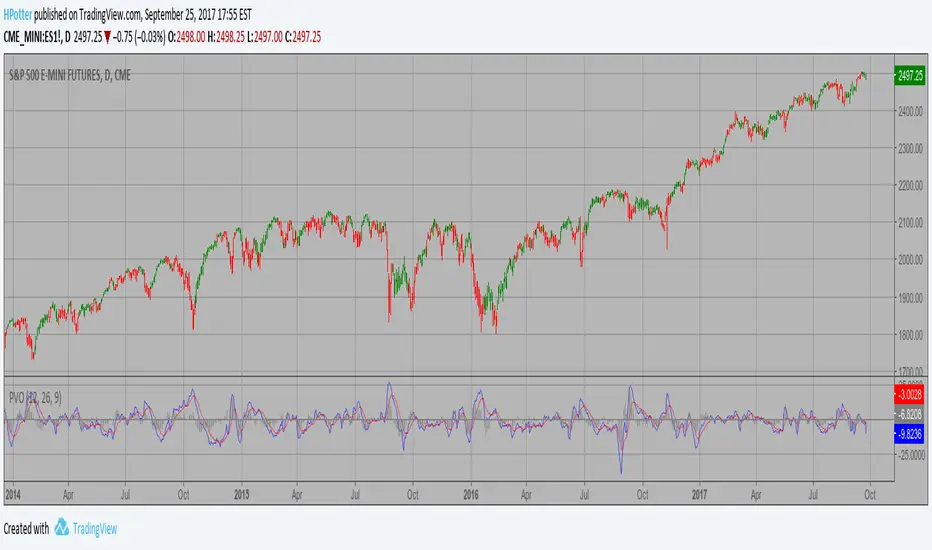
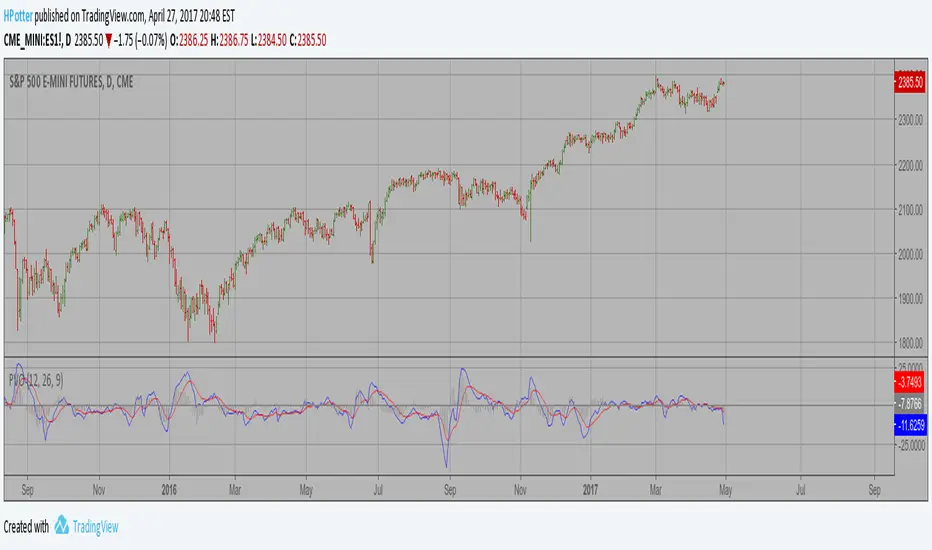
Percentage Volume Oscillator (PVO) Strategy The Percentage Volume Oscillator (PVO) is a momentum oscillator for volume. PVO measures the difference between two volume-based moving averages as a percentage of the larger moving average. As with MACD and the Percentage Price Oscillator (PPO), it is shown with a signal line, a histogram and a centerline. PVO is positive when the shorter volume EMA is above the longer volume EMA and negative when the shorter volume EMA is below. This indicator can be used to define the ups and downs for volume, which can then be use to confirm or refute other signals. Typically, a breakout or support break is validated when PVO is rising or positive. WARNING: This script to change bars colors.Pine Script® Indikatorvon HPotter70
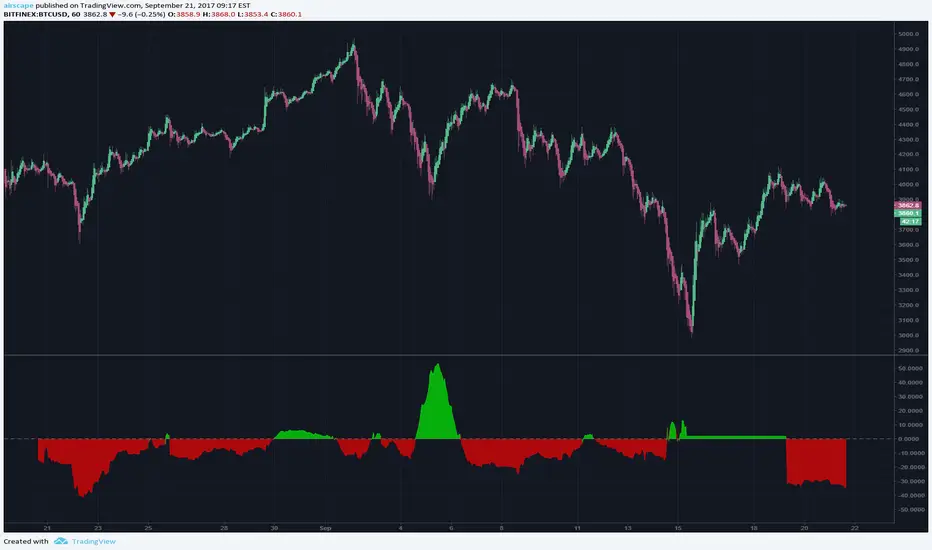
Bitfinex Bitcoin Short/Long PercentageShows the percentage of longs vs shorts. Red area means more shorts than longs and the other way around.Pine Script® Indikatorvon airscape22532
Net Volume BarsFlip the sign on down volume bars; negative net volume bars will appear below 0.Pine Script® Indikatorvon tsmmob44352
[RS]Volume Price ChangeEXPERIMENTAL calculates, price change * volume over a specific time window. It reflects trend, momentum and volume participation. It can be used to find divergences.Pine Script® Indikatorvon RicardoSantosAktualisiert 1111602
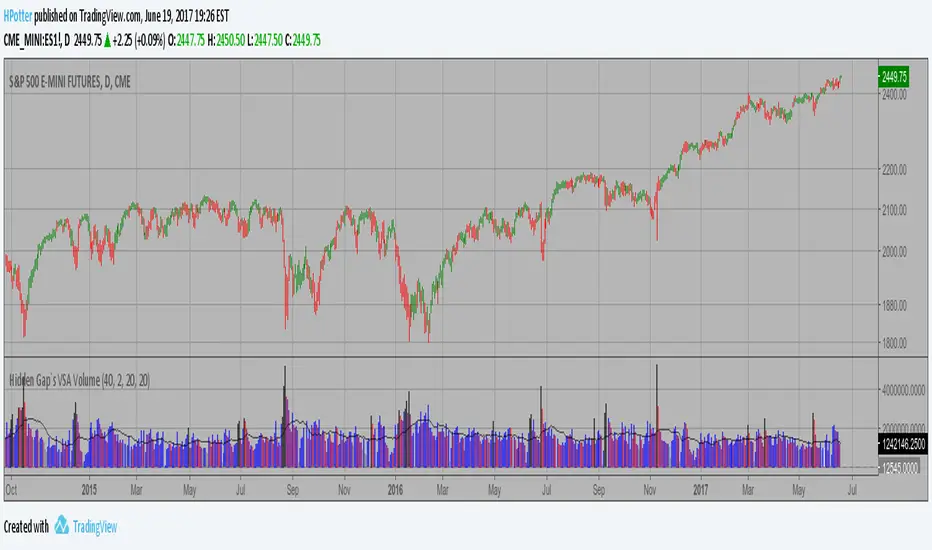
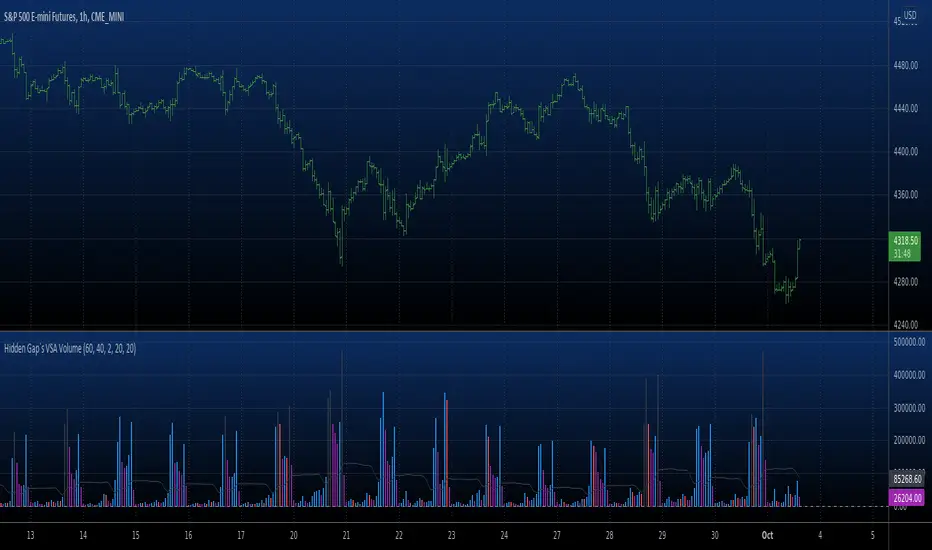
Hidden Gap`s VSA Volume If Volume is less then the previous 20 intervals, Volume is gray. If Volume is greater then the previous 40 intervals, Volume is black. If Volume is less then the previous 2 intervals, Volume is purple. If Volume is less then the previous, Volume is red. If Volume is greater then the previous, Volume is blue. Other - white. You can add on the indicator a 2.5 Standart Deviation of a 20 period Bollinger Band Shifted 3 periods forward.Pine Script® Indikatorvon HPotter33220
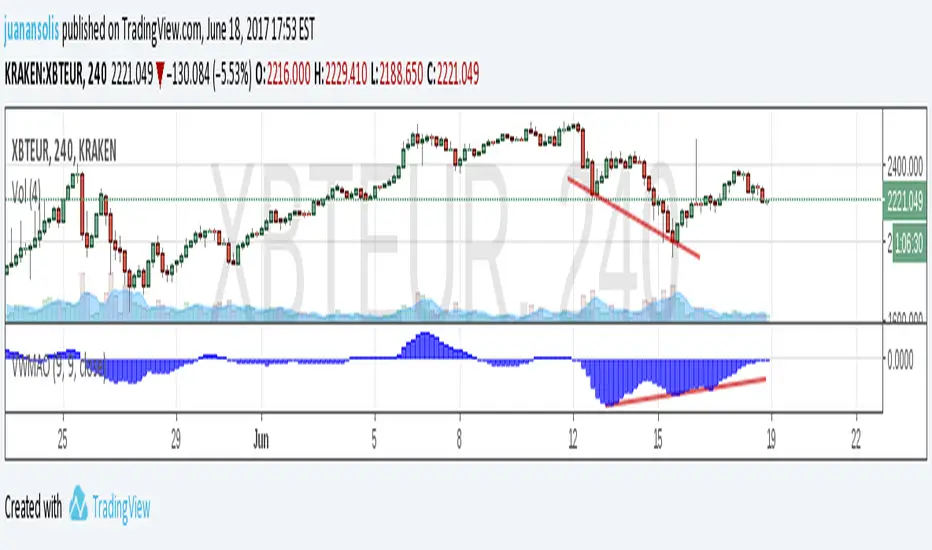
VWMA OscilatorThe Oscillator ranges around 0. Uses the difference between VWMA and an SMA smoothed by an EMA . The most useful are price divergences.Pine Script® Indikatorvon juanansolis205
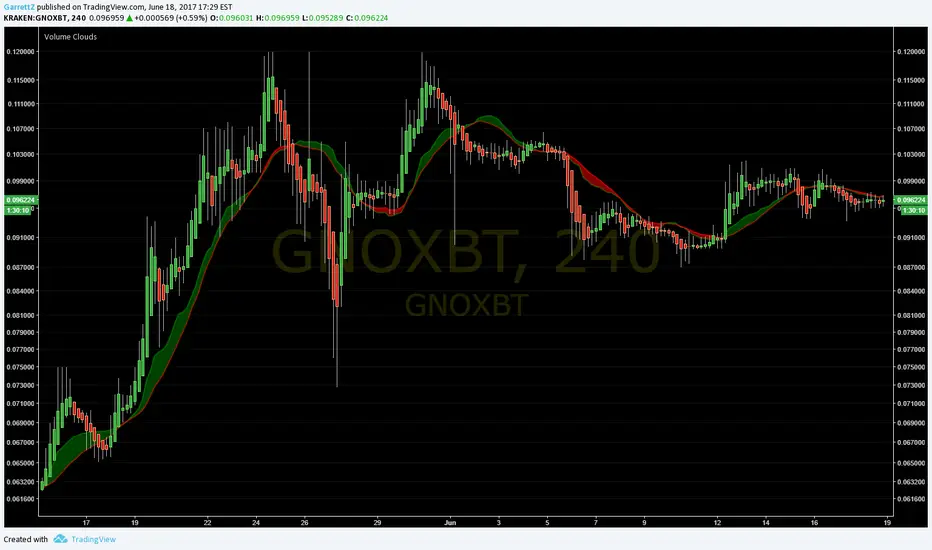
Volume CloudsI know it isn't much, but it is my first time coding an indicator! You might need to modify distance to fit the volatility and time frame of the chart you are looking at (if candles stay on top of cloud in an ugly mess, increase distance until signals can be seen). Sometimes heikin ashi candles can really help clear the picture up as well. How to use: The lines are the Volume Weighted Moving Average (green) and Simple Moving Average (red). Cloud is green when VWMA is above SMA ( bullish ) and red when SMA is above VWMA ( bearish ). The thicker the cloud, the stronger the signal. Also, the farther price strays from the cloud, the more pressure there is for it to return. Look for divergences: When price passes below a green cloud you have a bullish divergence (or if cloud turns green at crossing point) Price pass above red cloud = bearish divergence. Or confirmations: Price passes below red cloud = bearish confirmation. Price pass above green cloud = bullish confirmation. I hope this helps you at least a little! Twitter: GarrettZPine Script® Indikatorvon GarrettZ221
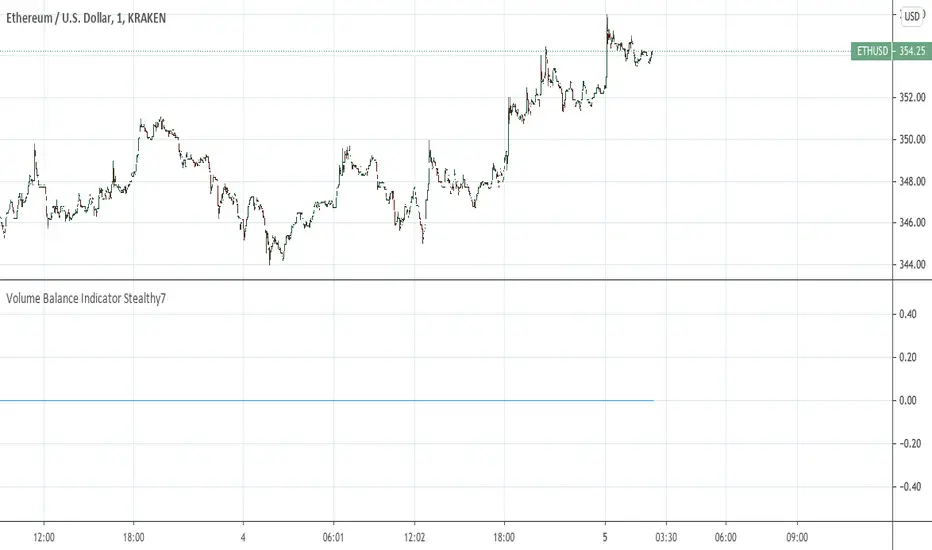
Volume Balance Indicator Stealthy7Find out if Bulls (buys) or Bears (sells) are moving the price. This gives a clear view of activity, even if you are using a higher time period. The lookback is in minutes, I believe. This is a superior volume indicator. Bars are recolored to show the underlying activity per the look back (minutes).Pine Script® Indikatorvon stealthy7Aktualisiert 88278
Volume Conversion IndicatorVolume Conversion Indicator The volume conversion indicator is much like the in-built volume indicator. This particular volume indicator allows you to find out how much of something has been traded in a given timeframe. This is done by multiplying volume by the average price at that point. What does this mean? Well, say, for example, you were watching DGB/BTC (DigiByte/Bitcoin). Instead of the volume being displayed in the amount of DGB traded, the amount of BTC traded is displayed instead. Feel free to comment... Hope this helps :DPine Script® Indikatorvon SquishyPea71
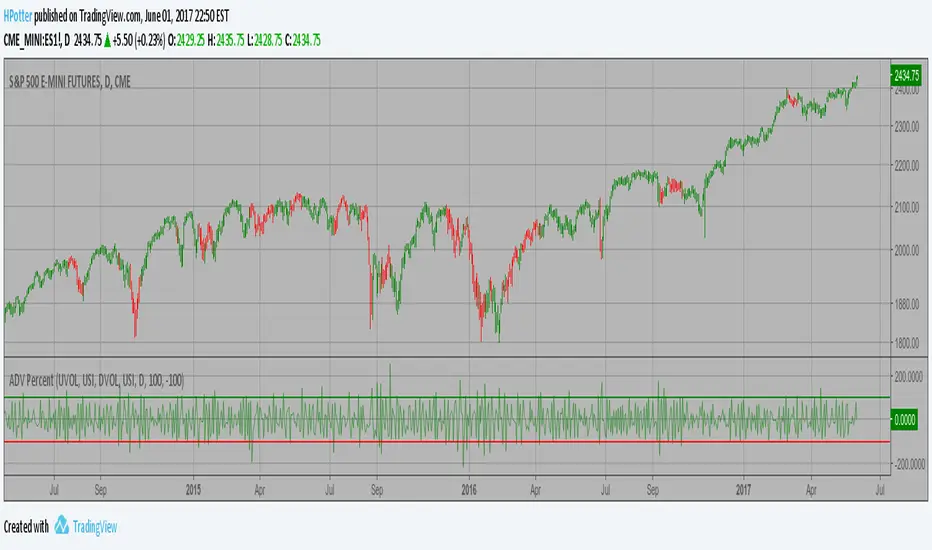
Advance-Decline Volume Percent Advance-Decline Volume Percent (AD Volume Percent) is a breadth indicator that measures the percentage of Net Advancing Volume for a particular group of stocks, such as an index or ETF. Net Advancing Volume equals the volume of advances less the volume of declines. AD Volume Percent equals Net Advancing Volume divided by total volume for the group. AD Volume Percent fluctuates between -100% and +100%. Pine Script® Indikatorvon HPotter1193
Smart Volume (beta)This script distinguishes up/down volume based on lower resolution. It's important to set correct inputs. Second - affects detalisation/loading speed. Third one needs to be set according to your chart resolution. 1440 for 'D', 30 for '30'.Pine Script® Indikatorvon apozdnyakovAktualisiert 11413
Advance-Decline Volume Percent Advance-Decline Volume Percent (AD Volume Percent) is a breadth indicator that measures the percentage of Net Advancing Volume for a particular group of stocks, such as an index or ETF. Net Advancing Volume equals the volume of advances less the volume of declines. AD Volume Percent equals Net Advancing Volume divided by total volume for the group. AD Volume Percent fluctuates between -100% and +100%. Pine Script® Indikatorvon HPotter71
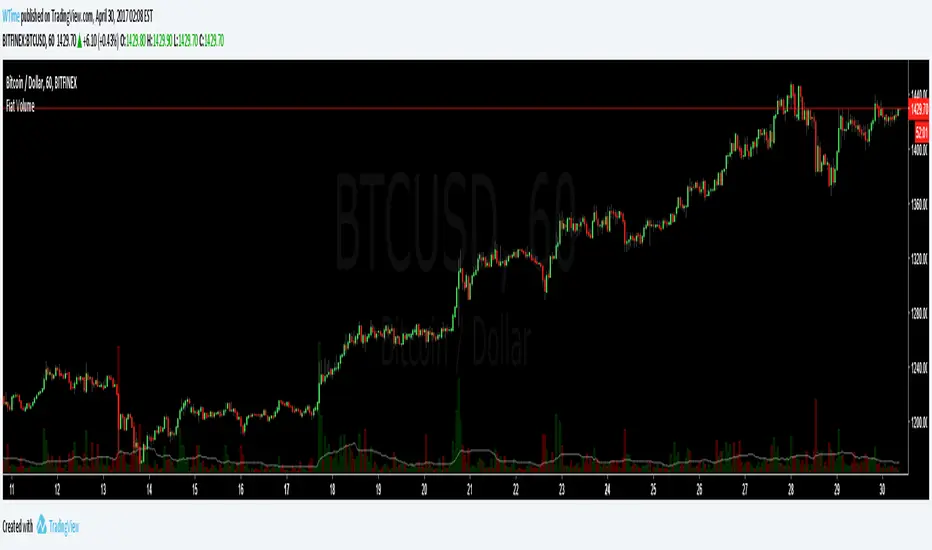
Fiat Denominated VolumeUseful for cryptocurrencies, where price swings often makes crypto denominated volume meaningless.Pine Script® Indikatorvon WTime12
Percentage Volume Oscillator (PVO) Copyright by HPotter v1.0 28/04/2017 The Percentage Volume Oscillator (PVO) is a momentum oscillator for volume. PVO measures the difference between two volume-based moving averages as a percentage of the larger moving average. As with MACD and the Percentage Price Oscillator (PPO), it is shown with a signal line, a histogram and a centerline. PVO is positive when the shorter volume EMA is above the longer volume EMA and negative when the shorter volume EMA is below. This indicator can be used to define the ups and downs for volume, which can then be use to confirm or refute other signals. Typically, a breakout or support break is validated when PVO is rising or positive. Pine Script® Indikatorvon HPotter410
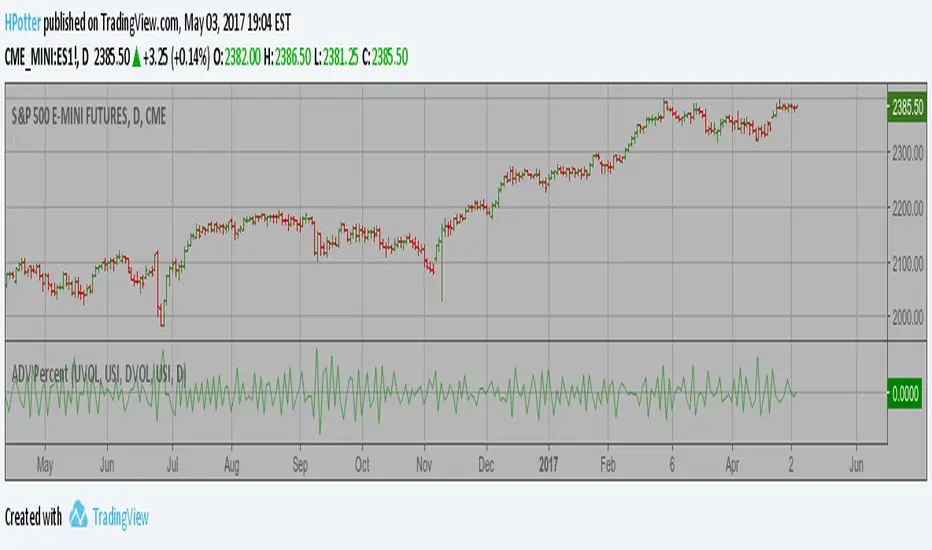
Advance/Decline Volume Line The Advancing-Declining Volume Line (AD Volume Line) is a breadth indicator based on Net Advancing Volume, which is the volume of advancing stocks less the volume of declining stocks. Net Advancing Volume is positive when advancing volume exceeds declining volume and negative when declining volume exceeds advancing volume. The AD Volume Line is a cumulative measure of Net Advancing Volume. It rises when Net Advancing Volume is positive and falls when Net Advancing Volume is negative. Chartists plot the AD Volume Line for a specific index and compare it to the performance of that index. The AD Volume Line should confirm an advance or a decline with similar movements. Bullish or bearish divergences in the AD Volume Line signal a change in buying or selling pressure that could foreshadow a reversal in the index. Pine Script® Indikatorvon HPotter55550
Volume in BTCThis is an experimental script i made for tracking volume in BTC on poloniex pairs. I am not a developer, i hardly even know how to code, so im sure there is a better way! I shared the script on request from someone else. I made the line 100% transparant because i only want the number in the top left. Have a nice day.Pine Script® Indikatorvon UnknownUnicorn373805Aktualisiert 113
[ST] Volume Flow v6Latest update to the volume flow indicator. It calculates volume fraction up and down based on candle shape: body counts twice one way, wicks count both ways. Total volume (positive + negative) is the regular volume. Additionally, I added breakout detection, oscillator, colored candles for easy trend following, reversal warnings, high and low volume alarms. Every aspect uses volume for calculations. What some parts mean : i.imgur.com Hope this helps someone, I use it myself as signals for confirmations. Tips are cool, but saying thanks is plenty as well :)Pine Script® Indikatorvon spacetrader4848 3.4 K
Hidden Gap`s VSA Volume If Volume is less then the previous 20 intervals, Volume is gray. If Volume is greater then the previous 40 intervals, Volume is black. If Volume is less then the previous 2 intervals, Volume is purple. If Volume is less then the previous, Volume is red. If Volume is greater then the previous, Volume is blue. Other - white. You can add on the indicator a 2.5 Standart Deviation of a 20 period Bollinger Band Shifted 3 periods forward.Pine Script® Indikatorvon HPotterAktualisiert 99 1.4 K
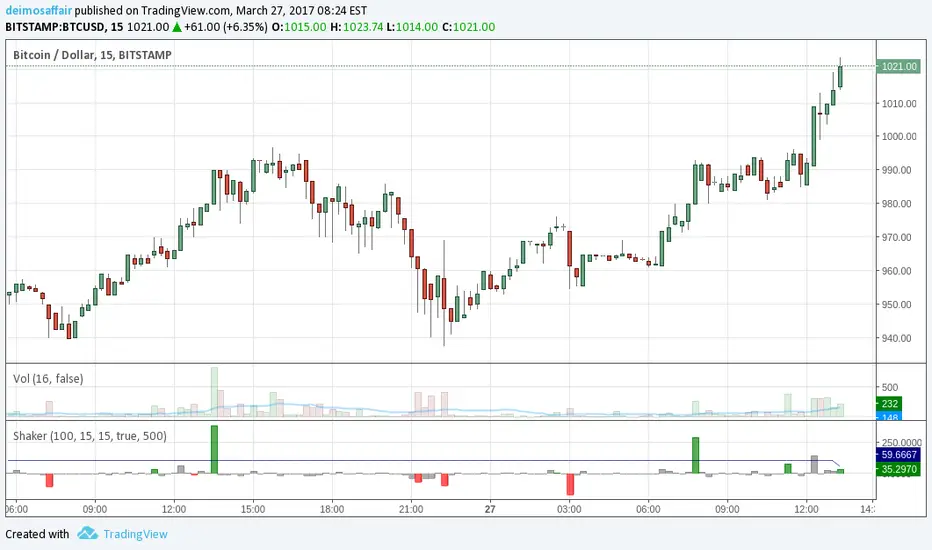
Cooltoyz: market shaker v1.0Panicking over a big ass candle? wondering what's happening on a flat market? Despair no more, this indicator could help with that :) The market Shaker calculates the price differences, and weights them with the volume used for the move. This volume is not the plain value, but a measure of the past X volume candles. Examples: price moves 3%, but with a volume of only ~80% of last candles. looks like weak move price moves 0.4%, but the volume was a massive 220% bigger than last candles. something happened, even if the market absorbed it all, better pay attention. in each case, the shaker indicator makes the calculated value bigger/smaller to account for the volume weight of the move. It's also i real time, the current candle weight is considered on how much time it remains to close. Example, on the 1H chart, if the last candle is 45min to close, the values for the volume are weighted to 25%, since is only 15min "old", while all the other candles are 1h, so the candle is only 25% of it's time to close. The indicator options has the arguments required to tune the indicator, the candles minutes must match the chart, or the results go crazy. Pine Script® Indikatorvon deimosaffair66289
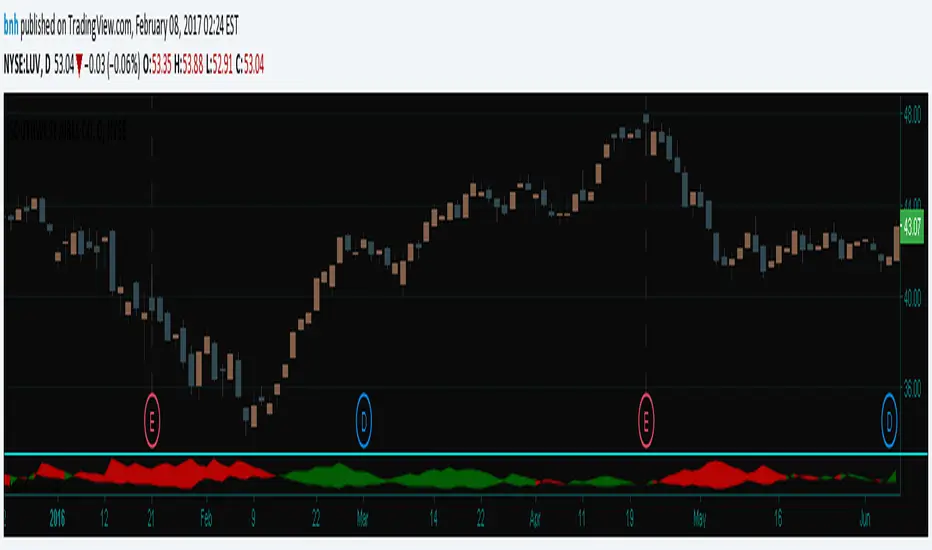
Hersheys Volume Pressure v2Hersheys Volume Pressure gives you very nice confirmation of trend starts and stops using volume and price. For up bars... If you have a large price change with low volume , that's very bullish . If you have a small price change with low volume , that's bullish . For down bars... If you have a large price change with low volume , that's very bearish . If you have a small price change with low volume , that's bearish . Look at the chart and you'll see how trends start and end with a PINCH and widen in the middle of the moves. You can set the moving average period, 14 is the default. Good trading! Brian Hershey v2 change log... - issue with price gaps - gaps at the open were sometimes showing incorrect colors - scaling issues - sometimes a change is so large it scales down all nearby data and renders it hard to view. Code was added to clip those huge values. v3 what's coming next... - better scaling - sometimes with thinly traded stocks there is too much clipping. For now increase the chart interval to correct.Pine Script® Indikatorvon bnh22246
Hersheys Volume Pressure v1Hersheys Volume Pressure gives you very nice confirmation of trend starts and stops using volume and price. For up bars... If you have a large price range with low volume, that's very bullish. If you have a small price range with low volume, that's bullish. For down bars... If you have a large price range with low volume, that's very bearish. If you have a small price range with low volume, that's bearish. Look at the chart and you'll see how trends start and end with a PINCH and widen in the middle of the moves. Hersheys Volume Pressure is unique, in that it measures bull/bear pressure on each bar by itself. Other volume indicators like On Balnce Volume and Price Volume Trend use cumulative differences in the current and previous bar to show trends. You can set the moving average period, 14 is the default. Good trading! Brian Hershey Pine Script® Indikatorvon bnh44310