複合ガチイカ🦑🦑🦑 日本語説明は英文の後ーーーーーーーーーーーーーーー
🦑 Composite Gachi Squid Indicator – A fun and intuitive trading overlay combining SuperTrend, ATR, and RSI.
Body color shows trend direction and strength.
Tentacles visualize volatility.
Eyes indicate overbought/oversold conditions.
🦑↑ / 🦑↓ marks provide clear entry signals.
Perfect for visual traders who want both style and actionable insights.
日本語説明-------------------------------------------------------------
🦑 複合ガチイカ・インジケーター – SuperTrend、ATR、RSI を組み合わせた遊び心と実用性を両立したチャートオーバーレイ。
イカの体の色でトレンドの方向と強さを表示
触手でボラティリティを可視化
目で買われすぎ・売られすぎを表示
🦑↑ / 🦑↓ が分かりやすいエントリーシグナル
見た目も楽しく、トレード判断にも使えるインジケーターです。
Volatilität

Brahmastra PremiumBrahmastra Trade System is a complete institutional trading engine designed for traders who want precision entries, clean trends, and automated risk management.
It combines multi-timeframe confirmation, ATR-based volatility logic, trend structure, and angle analytics—giving you a highly reliable and visually clean trading framework.
🔥 Key Features
✅ 1. Institutional Trend Engine (Triple Confirmation):
The trend is detected using:
Fast MA (5)
Slow SMA/EMA (51)
Custom ATR Trend (SuperTrend-like algorithm)
This three-layer confirmation ensures you only trade when the trend is solid, real, and clean.
✅ 2. Multi-Timeframe Breakout Confirmation (1-Minute)
Most retail breakouts are fake.
This indicator validates entries using lower timeframe 5-minute candle closes.
✔ Helps avoid traps
✔ Ensures genuine breakout momentum
✔ Great for intraday & swing traders
✅ 3. Smart Entry & Exit Signals
Clear on-chart signals:
Bullish Entry (Triangle Up)
Bearish Entry (Triangle Down)
Buy Exit
Sell Exit
Exit logic uses:
Fast MA breakdown
ATR trend reversal
This catches trend reversals early and protects profits.
✅ 4. Automatic SL + TP1/TP2/TP3 Projection (ATR-Based)
On every entry, Brahmastra automatically plots:
Stop Loss (SL),Target 1,Target 2,Target 3
Targets are based on volatility (ATR), not random lines. This gives:
✔ Stable stops
✔ Dynamic targets
✔ Accurate risk–reward mapping
✅ 5. Smart Trailing Stop Loss (TSL)
TSL activates only after TP1 hits.
Buy trades → TSL moves upward
Sell trades → TSL moves downward
The trailing SL never moves backward → flawless institutional money management.
✅ 6. Volume-Powered Candle Coloring
Candles change color based on:
Trend direction
Volume intensity
Makes momentum extremely easy to read:
High volume bull → Neon green
High volume bear → Neon red
✅ 7. Multi-Angle Trendline System (3 Layers)
Brahmastra auto-draws support/resistance trendlines for:
L1 (Scalp) – Short trend
L2 (Swing) – Medium trend
L3 (Macro) – Larger trend
Each trendline is analyzed for angle strength:
🚀 Parabolic (Dangerous / Vertical)
💪 Strong Trend (Ideal)
😴 Weak / Accumulation (Sideways)
This helps you see whether the market is:
About to explode
Losing strength
Moving sideways
⚠️ Disclaimer
This indicator is an advanced trading tool, NOT financial advice.
Always backtest, understand the logic, and trade responsibly.

Deviaton Tracker - QuantSyDeviation Tracker - QuantSy
An adaptive volatility band system that maps price behavior across statistical deviation zones. Provides visual context for market extremes and tracks duration patterns for probabilistic mean reversion analysis.
What it offers:
Dynamic bands that adjust to current volatility conditions, creating clear visual zones for price action. The system continuously monitors time spent in each zone and builds a statistical profile of typical duration patterns, helping identify when price may be overextended.
Best for:
Spotting potential reversal areas at volatility extremes
Understanding current price positioning relative to recent behavior
Timing entries and exits based on statistical probabilities
Risk management and position sizing decisions
Clean gradient visualization provides immediate context while the underlying statistical engine tracks behavioral patterns across all market conditions.
**⚠️ Disclaimer**
Educational tool only - does not constitute investment advice. The developer assumes no liability for any trading profits or losses incurred through the use/misuse of this indicator.
This indicator does not include any features related to interest, leverage, or gambling. Users are fully responsible for making sure their assets and trading practices align with Islamic guidelines.

Real Relative Strength Indicator### What is RRS (Real Relative Strength)?
RRS is a volatility-normalized relative strength indicator that shows you – in real time – whether your stock, crypto, or any asset is genuinely beating or lagging the broader market after adjusting for risk and volatility. Unlike the classic “price ÷ SPY” line that gets completely fooled by volatility regimes, RRS answers the only question that actually matters to professional traders:
“Is this ticker moving better (or worse) than the market on a risk-adjusted basis right now?”
It does this by measuring the excess momentum of your ticker versus a benchmark (SPY, QQQ, BTC, etc.) and then dividing that excess by the average volatility (ATR) of both instruments. The result is a clean, centered-around-zero oscillator that works the same way in calm markets, crash markets, or parabolic bull runs.
### How to Use the RRS Indicator (Aqua/Purple Area Version) in Practice
The indicator is deliberately simple to read once you know the rules:
Positive area (aqua) means genuine outperformance.
Negative area (purple) means genuine underperformance.
The farther from zero, the stronger the leadership or weakness.
#### Core Signals and How to Trade Them
- RRS crossing above zero → one of the highest-probability long signals in existence. The asset has just started outperforming the market on a risk-adjusted basis. Enter or add aggressively if price structure agrees.
- RRS crossing below zero → leadership is ending. Tighten stops, take partial or full profits, or flip short if you trade both sides.
- RRS above +2 (bright aqua area) → clear leadership. This is where the real money is made in bull markets. Trail stops, add on pullbacks, let winners run.
- RRS below –2 (bright purple area) → clear distribution or capitulation. Avoid new longs, consider short entries or protective puts.
- Extreme readings above +4 or below –4 (background tint appears) → rare, very high-conviction moves. Treat these like once-a-month opportunities.
- Divergence (not plotted here, but easy to spot visually): price making new highs while the aqua area is shrinking → distribution. Price making new lows while the purple area is shrinking → hidden buying and coming reversal.
#### Best Settings by Style and Asset Class
For stocks and ETFs: keep benchmark as SPY (or QQQ for tech-heavy names) and length 14–20 on daily/4H charts.
For crypto: change the benchmark to BTCUSD (or ETHUSD) immediately — otherwise the reading is meaningless. Length 10–14 works best on 1H–4H crypto charts because volatility is higher.
For day trading: drop length to 10–12 and use 15-minute or 5-minute charts. Signals are faster and still extremely clean.
#### Highest-Edge Setups (What Actually Prints Money)
- RRS crosses above zero while price is still below a major moving average (50 EMA, 200 SMA, etc.) → early leadership, often catches the exact bottom of a new leg up.
- RRS already deep aqua (+3 or higher) and price pulls back to support without RRS dropping below +1 → textbook add-on or re-entry zone.
- RRS deep purple and suddenly turns flat or starts curling up while price is still falling → hidden accumulation, usually the exact low tick.
That’s it. Master these few rules and the RRS becomes one of the most powerful edge tools you will ever use for rotation trading...

Volume based liquidity This indicator finds area where the price moves relatively mildly compared to the size of the volume, the target area. It also finds weak areas, that have low volume in a relatively large price movement. Larger and more recent target areas are much more useful in finding liquidity. the weak areas could be a tell for when price will reverse into a target area. Make sure a target area hasn't already had its liquidity swept.

Trend Flow & Volatility Guard Strategy [ROSTOK V5]Description:
This strategy is a comprehensive trend-following system designed to identify high-probability entries by aligning long-term market direction with short-term momentum, while strictly filtering out low-quality "choppy" market conditions.
How it Works:
The strategy operates on a multi-stage logic system:
Trend Identification: The core direction is determined by a customizable Main Trend Line (selectable between a long-period EMA or Supertrend). Trades are only taken in the direction of the dominant trend.
Signal Generation: Entries are triggered when a fast-moving Signal Line crosses the Main Trend Line, confirmed by specific candlestick price action (Close > Open).
Advanced Filtering (Confluence): To avoid false signals, the strategy employs a robust set of filters. A trade is only valid if:
Momentum: RSI is within safe operating zones (avoiding extreme overbought/oversold unless a strong trend override is active).
Cycle: CCI and MACD histograms align with the trade direction.
Volatility: The ADX is analyzed to ensure sufficient trend strength, while a Choppiness Index filter blocks trades during sideways/ranging markets.
Risk Management & Recovery: The strategy features built-in money management tools, including:
ADR (Average Daily Range) Filter: Prevents entering trades when the asset has already moved its expected daily distance.
Daily Limits: Hard stops for Max Daily Loss and Target Daily Profit to preserve capital.
Recovery Logic: An optional mechanism to manage drawdowns on difficult days using calculated recovery targets.
Settings & Customization: Users can toggle individual filters (Volume, Choppiness, ADX) and adjust the sensitivity of the trend lines to fit different assets and timeframes (e.g., EURAUD 15m).
Disclaimer: Past performance is not indicative of future results. This script is for educational purposes and backtesting analysis.

ATR Trade Plan ToolOverview
This indicator is a trade management tool designed to help traders visualize volatility-based targets and stop-losses instantly. By anchoring calculations to the Daily Opening Price and the Average True Range (ATR), it projects objective, mathematical support and resistance levels for the current session.
How It Works
The script detects the start of the trading day (or a manually defined period) and draws a vertical marker. From there, it projects horizontal lines representing key multiples of the ATR:
Green Line: Opening Price (The baseline).
Blue Lines (Targets): +0.5 ATR, +1.0 ATR, and +2.0 ATR. These serve as dynamic profit-taking zones based on current market volatility.
Orange Line (Stop Loss): -2.0 ATR. A standard volatility-based stop level.
Red Line (Emergency Exit): -3.0 ATR. A level indicating extreme adverse moves.
Key Features
Auto or Manual Mode: By default, the script automatically fetches the Daily Open and ATR-14. However, users can manually input a specific Opening Price or ATR value in settings to simulate trade plans or override automatic data.
Clean Visuals: Uses the Drawing API to plot lines only on the current/last bar, keeping historical price action clean and uncluttered.
Text Customization: Users can align text to the Right, Left, or Center, adjust the offset distance, and change text size to fit their chart layout.
Flexible Alerts: Includes a dedicated "Alert Configuration" menu. Users can toggle alerts on/off for individual lines (e.g., enable the Stop Loss alert but disable the +0.5 ATR alert). All enabled settings work via a single "Any alert() function call."
Settings
Values: Input custom Open/ATR prices (leave at 0 for automatic).
Text & Alignment: Adjust label position, offset, and size.
Alert Configuration: Checkboxes to enable/disable alerts for specific price levels.
Methodology The levels are calculated using the standard formula: Level = Opening Price + (Multiplier * ATR)

BT MA BandsThe BT MA Bands indicator is built around a central moving average (MA) with upper and lower bands derived from it, similar to Bollinger Bands but focused on exponential moving averages (EMAs) for smoother responsiveness.
The core idea is to visualize trend strength, volatility squeezes, and potential reversal points through dynamic bands that expand/contract based on price deviation. It includes trend-based color fills, entry/exit signals, an optional ATR (Average True Range) overlay for additional volatility bands, and flexible MA source options to adapt to different market conditions.
Inputs
MA Type and Length: Choose from EMA (default), SMA, WMA, or HMA. Default length is 20 periods, but adjustable (e.g., 10-50) for short-term scalping or longer swings.
Deviation Multiplier: Sets the band width as a multiple of the standard deviation from the MA (default: 2.0). Higher values create wider bands for trending markets; lower for ranging ones.
Source Data: Select price source for the MA calculation—close (default), open, high, low, (high+low)/2, or weighted (hlc3/hlcc4) to emphasize different aspects of price action.
ATR Toggle and Multiplier: Optional ATR-based outer bands (default off). When enabled, multiplier (default: 1.5) adds volatility sensitivity, helping filter noise in choppy conditions.
Signal Sensitivity: Threshold for generating buy/sell alerts (e.g., 0-100 scale; default 50) based on band crossovers or squeezes.
Style Options: Enable/disable fills, signals, and colors for personalization.
Visual Elements
Central MA Line: A solid line (e.g., blue by default) representing the chosen moving average, acting as the baseline.
Upper and Lower Bands: Dotted or dashed lines (green/red defaults) that flank the MA, widening during volatility and narrowing in consolidations.
Color-Changing Fills: The area between bands fills with color shifts—bullish (green) when price is above the MA and bands are expanding, bearish (red) when below and contracting, or neutral (gray) during flat trends.
Entry Signals: Arrow plots (up green for bullish, down red for bearish) appear on the chart when price crosses the bands or a squeeze resolves, with optional text labels like "Buy" or "Sell."
ATR Overlay (if enabled): Additional dashed outer bands in a lighter color (e.g., purple) to highlight extreme volatility zones.
How to Use It in Trading
Trend Identification: Use the central MA and band fills to gauge direction—price above the MA with green fills signals an uptrend (favor longs); below with red indicates downtrends (favor shorts). Narrow bands suggest a "squeeze" setup, often preceding big moves.
Entry Points:
Bullish Entries: Enter long when price breaks above the upper band on a bullish signal arrow, especially after a squeeze. Confirm with volume spike or RSI >50 on timeframes like 5m-1h for quick trades.
Bearish Entries: Enter short on a break below the lower band with a bearish arrow, post-squeeze. Ideal on 4h+ frames for swings, paired with MACD crossovers.
Exits and Risk Management: Exit longs when price hits the lower band or a bearish signal fires; vice versa for shorts. Set stops just beyond the opposite band (e.g., below lower for longs). Target 1.5-3x risk-reward, using ATR bands for trailing stops in volatile markets.
General Tips: Best in trending environments; avoid during news events causing false breakouts. Backtest parameters on historical data, and combine with other indicators like RSI or volume for confluence. It's great for spotting reversals but not infallible—always apply position sizing and monitor for band "walks" (price hugging one band) as continuation signals.

Eurovision - EURUSD Market SpecialistProfessional EURUSD trading signals with adaptive parameters
Performance Expectations
Win Rate || 60-70% || Adaptive parameters
Risk/Reward || 1:2.0 || Session optimization
Max Drawdown || <15% || News filter protection
Sharpe Ratio || >1.5 || Multi-timeframe confluence
Signals per Day || 3-8 || EURUSD-specific filtering
Tip: The indicator works best as an overlay on EURUSD M5 charts!

Dark Vector ScalpingThe Dark Vector Scalping indicator is a high-frequency trend-following system designed specifically to capture rapid momentum shifts in the market. It combines a staircase-style breakout logic with volatility-adjusted trailing stops to define market direction.
While the underlying math is robust enough for various asset classes, this specific configuration is optimized for scalping operations on 1-minute and 5-minute timeframes. It aims to filter out the "noise" common in lower timeframes while reacting quickly to genuine breakouts.
Core Components
1. The Apex Engine (Staircase Logic) Unlike traditional moving averages that curve with price, this engine uses a "hard" breakout logic. It looks back at a specific number of bars (Sensitivity) to find the highest highs and lowest lows.
Bullish Flip: Occurs when the price closes below the calculated low of the previous trend.
Bearish Flip: Occurs when the price closes above the calculated high of the previous trend.
Trailing Stop: Once a trend is established, a trailing stop line is drawn. This line only moves in the direction of the trend (up for bullish, down for bearish) and never retraces, acting as a ratchet to lock in paper profits.
2. Volatility Normalization To prevent getting stopped out by random market noise (scam wicks), the indicator calculates the Average True Range (ATR). It multiplies this volatility metric by a user-defined deviation factor to determine exactly how far the stop line should be from the current price action.
3. The Hull Moving Average (HMA) Filter The script includes an optional 50-period Hull Moving Average. The HMA is known for being extremely fast and smooth, reducing lag compared to standard moving averages.
Visual Reference: You can plot the line to see the overall macro trend.
Hard Filter: You can enable a "Safety Filter" in the settings. If enabled, the system will only generate Buy signals if the price is above the HMA, and Sell signals if the price is below the HMA.
4. The Dashboard A data panel is located on the chart (customizable position) to provide instant numerical data without needing to calculate levels manually. It displays the current trend state, the exact price of the trailing stop, and the status of the HMA filter.
Settings & Configuration
Sensitivity (Lookback)
Default: 5
This is the primary setting for the Apex Engine. A setting of 5 is the "sweet spot" for 1-minute and 5-minute charts. It allows the system to react very quickly to sudden volume spikes. Increasing this number (e.g., to 10) will make the signals slower and more conservative.
Stop Deviation
Default: 3.0
This controls the "breathing room" for the trade. A value of 3.0 allows for standard volatility on minute charts without triggering a premature exit. Lowering this to 2.0 will result in tighter stops but more false signals.
HMA Filter
Use HMA as Filter? (Default: OFF):
When OFF, the system signals purely on price action breakouts (fastest).
When ON, the system waits for the price to align with the 50-period HMA before signaling (safest, but may delay entry).
How to Interpret Visuals
Candle Colors
Teal/Green: The market is in a Bullish regime.
Red/Pink: The market is in a Bearish regime.
The Line
The solid stepped line represents the hard invalidation point. If price closes beyond this line, the trend is considered over.
Diamond Signals
Light Green Diamond (Below Bar): Confirmed Buy Signal. A new bullish trend has started.
Light Red/Pink Diamond (Above Bar): Confirmed Sell Signal. A new bearish trend has started.
Trading Strategy Guide
The Scalp Entry
Ensure you are on a 1-minute or 5-minute timeframe.
Wait for a signal Diamond to close. Do not enter while the bar is still forming, as the signal may repaint (disappear) if the price retraces before the close.
Long Entry: Enter when a Green Diamond appears and the candle turns Teal.
Short Entry: Enter when a Red Diamond appears and the candle turns Red.
Risk Management
Stop Loss: Your invalidation level is the "Apex Stop" line. You can place your hard stop loss slightly beyond this line.
Take Profit: Because this is a trend-following system, it is often best to hold until the candle color changes, or to take profit at fixed Risk:Reward ratios (e.g., 1:1.5 or 1:2).
The HMA Nuance If you find the market is "choppy" (moving sideways), enable the "Use HMA as Filter" option in the settings. This will force the system to ignore signals that are counter-trend to the longer-term momentum.
Disclaimer
The information provided by the "Dark Vector Scalping" indicator and this accompanying guide is for educational and informational purposes only. It does not constitute financial, investment, or trading advice. Trading cryptocurrencies, stocks, and forex involves a high level of risk and may not be suitable for all investors. You could lose some or all of your initial investment.

SigmaFrame-NQSigmaFrame is a volatility-weighted standard deviation engine designed to generate dynamic intraday pivot levels which expand during volatility spikes and tighten during compression, giving traders a consistent structural map across trending and rotational environments.

SigmaFrame-ESSigmaFrame is a volatility-weighted standard deviation engine designed to generate dynamic intraday pivot levels which expand during volatility spikes and tighten during compression, giving traders a consistent structural map across trending and rotational environments.

Dark VectorThe Dark Vector is a professional-grade trend-following system designed to solve the two most common causes of trading losses: over-trading during chop and exiting trends too early.
Unlike standard indicators that continuously recalculate based on every price tick, this system operates on a strict "State Machine" logic. This means it tracks the current market phase and refuses to issue conflicting signals. If the system is Long, it mathematically cannot issue another Long signal until the previous trend has concluded.
The system relies on three core engines:
1. The Trend Architecture (Modified SuperTrend) The backbone of the system is an ATR-based trailing stop mechanism. It creates a dynamic trend line that adjusts to volatility. When volatility expands, the line widens to prevent premature stop-outs during market noise. When volatility contracts, the line tightens to protect profits.
2. The Noise Gate (Choppiness Index) This is the system's safety filter. It measures the fractal efficiency of the market—essentially determining if price is moving in a clear direction or moving sideways. When the market enters a consolidation phase (sideways chop), the Noise Gate activates, turning the candles gray and physically blocking all new entry signals. This prevents the user from entering trades in low-probability environments.
3. The Singularity State Machine This internal logic enforces trading discipline. It treats the trend as a binary state (Bullish or Bearish). It forces an alternating signal pattern, ensuring that you are only alerted to the specific moment a major trend reversal occurs, rather than being bombarded with repetitive signals during a long run.
Best Way to Use This System
To maximize profitability and minimize false positives, it is recommended to use the "Regime & Alignment" methodology outlined below.
1. The Traffic Light Rule
Before placing any trade, observe the color of the candlesticks on the chart:
Green Candles: The market is in a confirmed Bullish Impulse. You should only look for Long entries or hold existing positions. Shorting is statistically dangerous here.
Red Candles: The market is in a confirmed Bearish Impulse. You should only look for Short entries or hold cash. Buying the dip here is high-risk.
Gray Candles: The market is in a Chop/Squeeze regime. The Noise Gate is active. Do not open new positions. This indicates indecision, and the market is likely to destroy option premiums or stop out tight leverage. Wait for the candles to return to Green or Red before acting.
2. The Entry Trigger
Enter a trade only when a text label (LONG or SHORT) appears.
Long Signal: Occurs when price closes above the Trend Line AND the market is not in a Chop zone.
Short Signal: Occurs when price closes below the Trend Line AND the market is not in a Chop zone.
3. The Exit Strategy
There are two ways to manage the trade once active:
The Trend Follower (Conservative): Hold the position until the Trend Line flips color. This captures the maximum duration of the move but may give back some profit at the very end.
The Stop Loss (Active): The Trend Line (the white value in your dashboard) acts as your Trailing Stop. If a candle closes beyond this line, the trend is technically invalidated. You should exit immediately.
4. Multi-Timeframe Alignment (The Golden Rule)
The highest win rates are achieved when your trading timeframe aligns with the higher-order trend.
Step 1: Check the 4-Hour chart. Is the Trend Line Green?
Step 2: Switch to the 15-Minute chart.
Step 3: Only take the LONG signals on the 15-Minute chart. Ignore all Short signals.
Reasoning: Counter-trend trades often fail. By trading only in the direction of the higher timeframe, you are swimming with the current, not against it.
Recommended Settings by Style
Swing Trading (Daily/4H): Keep the Trend Factor at 4.0. This ignores daily noise and keeps you in the trade for weeks or months.
Day Trading (1H/15m): Lower the Trend Factor to 3.0. This makes the system more reactive to intraday reversals.
Scalping (5m): Lower the Trend Factor to 2.0 and the ATR Length to 7. This is aggressive and requires strict adherence to the Stop Loss.
Disclaimer
This indicator is for educational and informational purposes only. It does not constitute financial advice, investment advice, or a recommendation to buy or sell any asset. Trading cryptocurrencies, stocks, and futures involves a high degree of risk and the potential for significant financial loss. The user assumes all responsibility for their trading decisions. Past performance of any system or indicator is not indicative of future results. Always practice risk management and never trade with money you cannot afford to lose.

JINN: A Multi-Paradigm Quantitative Trading and Execution EngineI. Core Philosophy: A Substitute for Static Analysis
JINN (Joint Investment Neural and Network) represents a paradigm shift from static indicators to a living, adaptive analytical ecosystem. Traditional tools provide a fixed snapshot of the market. JINN operates on a fundamentally different premise: it treats the market as a dynamic, regime-driven system. It processes market data through a hierarchical suite of advanced, interacting models, arbitrates their outputs through a rules-based engine, and adapts its own logic in real-time.
It is designed as a complete framework for traders who think in terms of statistical edge, market regimes, probabilistic outcomes, and adaptive risk management.
II. The JINN Branded Architecture: Your Command and Control Centre
JINN’s power emerges from the synergy of its proprietary, branded architectural components. You do not simply "use" JINN; you command its engines.
1. JINN Signal Arbitration (JSA) Engine
The heart of JINN. The JSA is your configurable arbitration desk for weighing evidence from all internal models. As the Head Strategist, you define the entire arbitration philosophy:
• Priority and Weighting : Define a "chain of command". Specify which model's opinion must be considered first and assign custom weights to their outputs, directly controlling the hierarchy of your analytical flow.
• Arbitration Modes :
First Wins: For high-conviction, rapid signal deployment based on your most trusted leading model.
Highest Score: A "best evidence" approach that runs a full analysis and selects the signal with the highest weighted probabilistic backing.
Consensus: An ultra-conservative, "all-clear" mode that requires a unanimous pass from all active models, ensuring maximum confluence.
2. JINN Threshold Fusion (JTF) Engine
Static entry thresholds can be limiting in a dynamic market. The JTF engine replaces them with a robust, adaptive "breathing" channel.
• Kalman Filter Core : A noise-reducing, parametric filter that provides a smooth, responsive centre for the entry bands.
• Exponentially Weighted Quantile (EWQ) : A non-parametric, robust measure of the signal's recent distribution, resistant to outliers.
• Dynamic Fusion : The JTF engine intelligently fuses these two methodologies. In stable conditions, it can blend them; in volatile conditions, it can be configured to use the "Minimum Width" of the two, ensuring your entry criteria are always the most statistically relevant.
3. JINN Pattern Veto (JPV) with Dynamic Time Warping
The definitive filter for behavioural edge and pattern recognition. The JPV moves beyond value-based analysis to analyse the shape of market dynamics.
• Dynamic Time Warping (DTW) : A powerful algorithm from computer science that compares the similarity of time series.
• Pattern Veto : Define a "toxic" price action template—a pattern that has historically preceded failed signals. If the JPV detects this pattern, it will veto an otherwise valid trade, providing a sophisticated layer of qualitative, shape-based filtering.
4. JINN Flow VWAP
This is not a standard VWAP. The JINN Flow VWAP is an institutionally-aware variant that analyses volume dynamics to create a "liquidity pressure" band. It helps visualise and gate trades based on the probable activity of larger market participants, offering a nuanced view of where significant flow is occurring.
III. The Advanced Model Suite: Your Pre-Built Quantitative Toolkit
JINN provides you with a turnkey suite of institutional-grade models, saving you thousands of hours of research and development.
1. Auto-Tuning Hyperparameters Engine (Online Meta-Learning)
Markets evolve. A static strategy is an incomplete strategy. JINN’s Auto-Tuning engine is a meta-learning layer inspired by the Hedge (EWA) algorithm, designed to combat alpha decay.
• Portfolio of Experts : It treats a curated set of internal strategic presets as a portfolio of "experts".
• Adaptive Weighting : It runs an online learning algorithm that continuously measures the risk-adjusted performance of each expert (using a sophisticated reward function blending Expected Value and Brier Score).
• Dynamic Adaptation : The engine dynamically allocates more influence to the expert strategy that is performing best in the current market regime, allowing JINN’s core logic to adapt without manual intervention.
2. Lorentzian Classification and PCA-Lite EigenTrend
• Lorentzian Engine : A powerful probabilistic classifier that generates a continuous probability (0-1) of market state. Its adaptive, volatility-scaled distribution is specifically designed to handle the "fat tails" and non-Gaussian nature of financial returns.
• PCA-Lite EigenTrend : A Principal Component Analysis engine. It reduces the complex, multi-dimensional data from the Technical and Order-Flow ensembles into a single, maximally descriptive "EigenTrend". This factor represents the dominant, underlying character of the market, providing a pure, decorrelated input for the Lorentzian engine and other modules.
3. Adaptive Markov Chain Model
A forward-looking, state-based model that calculates the probability of the market transitioning between Uptrend, Downtrend, and Sideways states. Our implementation is academically robust, using an EMA-based adaptive transition matrix and Laplace Smoothing to ensure stability and prevent model failure in sparse data environments.
IV. The Execution Layer: JINN Execution Latch Options
A good signal is worthless without intelligent execution. The JINN Execution Latch is a suite of micro-rules and safety mechanisms that govern the "last mile" of a trade, ensuring signals are executed only under optimal, low-risk conditions. This is your final pre-flight check.
• Execution Latch and Dynamic Cool-Down : A core safety feature that enforces a dynamic cool-down period after each trade to prevent over-trading in choppy, whipsaw markets. The latch duration intelligently adapts, using shorter periods in low-volatility and longer periods in high-volatility environments.
• Volatility-Scaled Real-Time Threshold : A sophisticated gate for real-time entries. It dynamically raises the entry threshold during sudden spikes in volatility, effectively filtering out noise and preventing entries based on erratic, unsustainable price jerks.
• Noise Debounce : In market conditions identified as "noisy" by the Shannon Entropy module, this feature requires a real-time signal to persist for an extra tick before it is considered valid. This is a simple but powerful heuristic to filter out fleeting, insignificant price flickers.
• Liquidity Pressure Confirmation : An institutional-grade check. This gate requires a minimum threshold of "Liquidity Pressure" (a measure of volume-driven momentum) to be present before validating a real-time signal, ensuring you are entering with market participation on your side.
• Time-of-Day (ToD) Weighting : A practical filter that recognises not all hours of the trading day are equal. It can be configured to automatically raise entry thresholds during historically low-volume, low-liquidity sessions (e.g., lunch hours), reducing the risk of entering trades on "fake" moves.
• Adaptive Expectancy Gate : A self-regulating feedback mechanism. This gate monitors the strategy's recent, realised performance (its Expected Value). If the rolling expectancy drops below a user-defined threshold, the system automatically tightens its entry criteria, becoming more selective until performance recovers.
• Bar-Close Quantile Confirmation : A final layer of confirmation for bar-close signals. It requires the signal's final score to be in the top percentile (e.g., 85th percentile) of all signal scores over a lookback period, ensuring only the highest conviction signals are taken.
V. The Contextual and Ensemble Frameworks
1. Multi-Factor Ensembles and Bayesian Fusion
JINN is built on the principle of diversification. Its signals are derived from two comprehensive, fully customizable ensembles:
• Technical Ensemble : A weighted combination of over a dozen technical features, from cyclical analysis (MAMA, Hilbert Transforms) and momentum (Fisher Transform) to trend efficiency (KAMA, Fractal Efficiency Ratio).
• Order-Flow Ensemble : A deep dive into market microstructure, incorporating Volume Delta, Absorption, Imbalance, and Delta Divergence to decode institutional footprints.
• Bayesian Fusion : Move beyond simple AND/OR logic. JINN’s Bayesian engine allows you to probabilistically combine evidence from trend and order-flow filters, weighing each according to its perceived reliability to derive a final posterior probability.
2. Context-Aware Framework and Entropy Engine
JINN understands that a successful strategy requires not just a good entry, but an intelligent exit and a dynamic approach to risk.
• Shannon Entropy Filter : A direct application of information theory. JINN quantifies market randomness and allows you to set a precise entropy ceiling to automatically halt trading in unpredictable, high-entropy conditions.
• Adaptive Exits and Regime Awareness : The script uses its entropy-derived regime awareness to dynamically scale your Take Profit and Trailing Stop parameters . It can be configured to automatically take smaller profits in choppy markets and let winners run in strong trends, hard-coding adaptive risk management into your system.
VI. The Dashboard: Your Mission Control
JINN features a dynamic, dual-mode dashboard that provides a comprehensive, real-time overview of the entire system's state.
Mode 1: Signal Gate Metrics Dashboard
This dashboard is your pre-flight checklist. It displays the real-time Pass/Fail/Off status of every single gating and filtering component within JINN, including:
• Core Ensembles : Technical and Order-Flow Ensemble status.
• Trend Filters : VWAP, VWMA, ADX, ATR Slope, and Linear Regression Angle gates.
• Advanced Models : Dual-Lorentzian Consensus, Markov Probability, and JPV Veto status.
• Regime and Safety : Shannon Entropy, Execution Latch, and Expectancy Gate status.
• Final Confirmation : A master "All Hard Filters" status, giving you an at-a-glance confirmation of system readiness.
Mode 2: Quantitative Metrics Dashboard
This dashboard provides a high-level, institutional-style data readout of the current market state, as seen through JINN's analytical lens. It includes over 60 key metrics for both Signal Gate and Quantitative Metrics, such as:
• Ensemble and Confidence Scores : The raw numerical output of the Technical, Order-Flow, and Lorentzian models.
• Volatility and Volume Analysis : Realised Volatility (%), Relative Volume, Volume Sigma Score, and ATR Z-Score.
• Momentum and Market Position : ADX, RSI Z-Score, VWAP Distance (%), and Distance from 252-Bar High/Low.
• Regime Metrics : The numerical value of the Shannon Entropy score and the Model Confidence score.
VII. The User as the Head Strategist
With over 178 meticulously designed user inputs, JINN is the ultimate "glass box" engine. The internal code is proprietary, but the control surface is transparent and grants you architectural-level command.
• Prototype Sophisticated Strategies : Test complex, multi-model theses at your own pace that would otherwise take weeks of coding. Want to test a strategy that uses a Lorentzian classifier driven by the EigenTrend, arbitrated by JSA in "highest score" mode, and filtered by a strict Markov trend gate? These can be configured and unified.
• Tune the Engine to Any Market : The inputs provide the control surface to optimise JINN's behaviour for specific assets and timeframes, from crypto scalping to swing trading indices.
• Build Trust Through Configuration : The granular controls allow you to align the script's behaviour precisely with your own market view, building trust in your own deployment of the tool.
JINN is a commitment. It is a tool for the serious analyst who seeks to move from discretionary trading to a systematic, quantitative, and adaptive approach. If this aligns with your philosophy, we invite you to apply for access.
Disclaimer
This script is for informational and educational purposes only. It does not constitute financial, investment, or trading advice, nor is it a recommendation to buy or sell any asset.
All trading and investment decisions are the sole responsibility of the user. It is strongly recommended to thoroughly test any strategy on a paper trading account for at least one week before risking real capital.
Trading financial markets involves a high risk of loss, and you may lose more than your initial investment. Past performance is not indicative of future results. The developer is not responsible for any losses incurred from the use of this script.

Rate Of Change With HistogramCustomized standard ROC indicator to represent as Histogram instead of standard line

Goldsky - Gold Market SpecialistGoldsky is a sophisticated TradingView Pine Script indicator designed exclusively for XAUUSD (Gold) trading. It features adaptive parameter adjustment, session-based optimization, market regime detection, news event filtering, multi-timeframe analysis, and intelligent risk management specifically calibrated for gold's unique market characteristics.
Features
Adaptive System: Parameters adjust automatically based on market conditions
Session-Based Optimization: Different strategies for Asian/European/American/Overlap sessions
Market Regime Detection: TRENDING/RANGING/BREAKOUT/NEUTRAL market analysis
News Event Filter: Automatic detection and protection during high volatility
Multi-Timeframe Analysis: H1 trend + M15 structure + M5 execution confluence
RSI Integration: Advanced RSI filtering for entries and exits
Bollinger Bands Integration: Volatility analysis and extreme value detection
Risk Management: Gold-specific risk parameters and position sizing

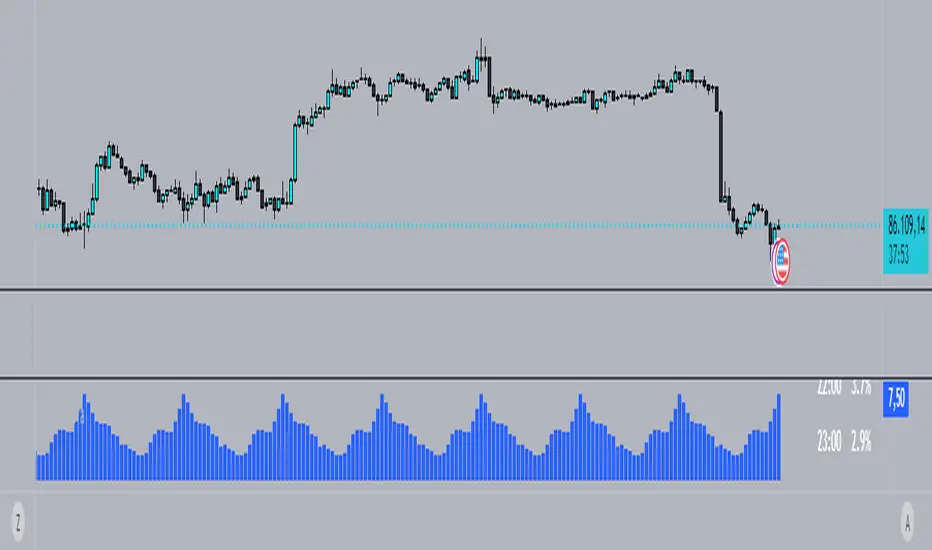
Combined Up down with volumeIndicates the day with a purple dot where price moved up or down by 5% or more

ZynIQ Volatility Master Pro v2 - (Pro Plus Pack)Overview
ZynIQ Volatility Master Pro v2 analyses expansion and contraction in price behaviour using adaptive volatility logic. It highlights periods of compression, breakout potential and increased directional movement, helping traders understand when the market is shifting between quiet and active phases.
Key Features
• Multi-layer volatility modelling
• Adaptive compression and expansion detection
• Optional trend-aware volatility colouring
• Configurable sensitivity for different assets and timeframes
• Clean visual presentation designed for intraday and swing analysis
• Complements breakout, trend, structure and volume indicators
Use Cases
• Identifying contraction phases before expansion
• Filtering trades during low-volatility conditions
• Spotting volatility increases that accompany breakouts
• Combining volatility context with your other tools for confluence
Notes
This tool provides volatility context and regime awareness. It is not a trading system on its own. Use it with your preferred confirmation and risk management.

ZynIQ Market Regime Master Pro v2 - (Pro Plus Pack)Overview
ZynIQ Market Regime Master Pro v2 identifies shifts in market conditions by analysing volatility, directional flow and structural behaviour. It highlights when the market transitions between trending, ranging, expansion and contraction phases, giving traders clearer context for decision making.
Key Features
• Multi-factor regime detection (trend, range, expansion, contraction)
• Adaptive volatility and momentum analysis
• Direction-aware colour transitions
• Optional HTF regime overlay
• Configurable sensitivity to match different markets
• Clean visuals suitable for intraday or swing trading
• Complements trend, breakout, liquidity and volume tools
Use Cases
• Determining whether the market is trending or ranging
• Identifying expansion phases vs contraction phases
• Filtering signals during unfavourable regimes
• Combining regime context with structure or breakout tools
Notes
This tool provides regime classification and contextual analysis. It is not a trading system by itself. Use with your own confirmation and risk management.

ZynIQ Core Pro Suite v2 - (Pro Plus Pack)Overview
ZynIQ Breakout Core Pro Suite v2 is an advanced breakout engine designed to analyse compression, expansion and directional bias with high precision. It incorporates multi-factor filtering, adaptive volatility logic and refined breakout mapping to highlight moments where the market transitions from contraction to expansion.
Key Features
• Adaptive breakout zones with refined volatility filters
• Direction-aware breakout confirmation
• Optional multi-stage filtering for higher-quality expansions
• Pullback and continuation gating to reduce noise
• Integrated structure awareness for more reliable triggers
• Clean labels and minimal chart clutter
• Optimised for intraday, swing and high-volatility markets
Use Cases
• Identifying structurally significant breakout points
• Avoiding false expansions during low-volatility phases
• Combining breakout logic with trend, structure or volume tools
• Mapping expansion phases after compression builds
Notes
This tool provides structural and volatility-aware breakout context. It is not a complete trading system. Use with your own confirmation tools and risk management.

ZynIQ Volume Surge Pro v2 - (Pro Pack)Overview
ZynIQ Volume Surge Pro v2 highlights abnormal changes in trading volume using multi-tier surge detection, churn analysis and optional divergence logic. It provides a detailed view of when market participation increases or decreases in a meaningful way.
Key Features
• Multi-tier surge detection (mild/strong/exceptional)
• Churn and absorption-style volume behaviour
• Optional volume-price divergence detection
• Configurable sensitivity for different markets and timeframes
• Clean labels marking surge conditions
• Optional HUD panel with surge state and metrics
• Works well for intraday and swing trading
Use Cases
• Confirming breakouts with strong participation
• Identifying exhaustion or stopping volume conditions
• Spotting divergences between price and volume
• Enhancing trend, structure or breakout analysis with volume context
Notes
This tool provides surge and participation context. It is not a standalone trading system. Use it with your own confirmation and risk management.
